
Timing & trends
May 26, 2015
- Today is gold options expiry day on the COMEX. Gold. As expiry day approaches, gold has a tendency to trade sideways to lower.
- Option traders tend to focus on round numbers, like $1200. As they battle amongst themselves for higher or lower prices, their actions can effectively cancel each out, and the price goes nowhere. On expiry day, both put and call options often expire with little or no value.
- Please click here now. That’s the daily gold chart. As options expiry drama comes to a head today, gold is likely to stage a small advance towards $1220, or a small decline towards $1170.
- The blue triangle pattern and the black bull wedge pattern suggest that $1220 is more likely, while the sell signal on the 14,7,7 Stochastics series at the bottom of the chart suggests that $1170 is next.
- Swing trading can definitely form part of a general investment portfolio strategy, but no more than a small portion of an investor’s net worth should be allocated to it.
- For the past two years, most bank economists and Western gold gurus have unsuccessfully tried to forecast big moves higher and lower, for the price of gold.
- They have failed because the gold market is in a state of massive transition. For hundreds of years, the fear trade (bars and coin investment in the West) has dominated the market. Now, the Chindian economies are experiencing the greatest industrialization in the history of the world.
- Mainstream media in the West doesn’t seem to really understand the enormous size of this process, or its ramifications for the global economic order.
- The gigantic populations of China and India are focused on the love trade (jewellery), and in the coming years they will overwhelm the actions of Western fear traders. For now though, the global gold market is essentially unpredictable.
- Price discovery is now the result of a bizarre mix of fear traders and love traders, who each have totally different views about what economic news means for the price.
- Please click here now. While there may or may not be a “grand conspiracy” by Western banks and governments to keep the price of gold under pressure, there’s no question that banks have engaged in market “games” from time to time.
- Regulators are now moving their focus from a regional one in London to a global one. That’s good news. It adds legitimacy to the market, and attracts institutional investors to what I view as the world’s greatest asset.
- From a seasonal perspective, there’s no question that the first half of the year is generally soft, and the second half is usually firm. June is almost upon us now, and it’s the last month of gold’s soft season.
- Please click here now. Next, please click here now. These snapshots of the latest gold and silver COT reports show that investment funds (non-commercial traders) were covering short positions and adding longs recently, as the gold market rallied towards $1230.
- Commercial traders tend to have a better track record than the funds. They added a lot of short positions into that rally. Their actions fit nicely with the general seasonal softness.
- Based on their analysis of the next potential move for gold, some analysts are urging Western gold community investors to “Sell now, and buy back later!” Some are urging a strategy that is essentially….“Buy the final decline, before the train leaves the station!”
- I think it’s important for Western investors living the fear trade legacy to be very realistic about their personal situation. That’s much more helpful to building wealth than guessing about what may or may not be around the corner in the short term.
- The bottom line: If an investor has, reasonably systematically, bought some precious metals and related equities into the weakness of the past couple of years, there’s no need to get wildly emotional about whether gold is set to decline $100, rally $100, or just trade generally sideways.
- China, India, and Dubai are building an enormous gold market infrastructure for what I call the “bull era”. It will take about two years before Western gold price enthusiasts see the fruits of those labours reflected in the gold price on a daily basis, but I expect many gold mining stocks will show relentless uptrends during the building period.
- To understand why that is likely, please click here now. I use this weekly chart of China’s largest gold jewellery retailer, as a key leading indicator for Western mining stocks.
- The drama surrounding the COT reports and option expiry day can cause investors to panic, but most gold demand comes from Chinese and Indian jewellers. Chow Tai Fook is in the midst of a spectacular expansion program. Over the next five years, I expect the company will easily increase the number of its stores from about 2000 to 4000.
- Please click here now . That’s another look at the Chow Tai Fook weekly chart. I believe there’s an enormous inverse head and shoulders bottom pattern in play, and the right shoulder itself is a massive bullish wedge. I think Chow Tai Fook will trade at $100 by the time the expansion program is complete, and perhaps sooner; Hong Kong and China are merging their stock markets in July, with a mandate to trade 300 billion yuan a day. Chow Tai Fook based in Hong Kong, and institutional money managers are likely to invest heavily as the merger is completed.
- Please click here now. This GDX chart shows that most of the bigger gold stocks are grinding a bit lower, after rallying from mid-March to mid-May. Nothing is out of the ordinary.
- The most successful investor now is the one who dials down their obsession with predicting the next price move, and simply pours themselves a glass of fine bull era infrastructure construction wine.Enjoy the month of June!
May 26, 2015
Stewart Thomson
Graceland Updates
website: www.gracelandupdates.com
email for questions: stewart@gracelandupdates.com
email to request the free reports: freereports@gracelandupdates.com
Tuesday May 26, 2015
Special Offer for Money Talks readers: Send an email to freereports@gracelandupdates.comand I’ll send you my free “Gold Stock Gaps With Volume!” report. Numerous intermediate and junior gold stocks are staging volume-based upside breakouts with price gaps now. I highlight six of the best ones that bull era fans may want to buy now!
Graceland Updates Subscription Service: Note we are privacy oriented. We accept cheques. And credit cards thru PayPal only on our website. For your protection we don’t see your credit card information. Only PayPal does.
Subscribe via major credit cards at Graceland Updates – or make checks payable to: “Stewart Thomson” Mail to: Stewart Thomson / 1276 Lakeview Drive / Oakville, Ontario L6H 2M8 / Canada
Stewart Thomson is a retired Merrill Lynch broker. Stewart writes the Graceland Updates daily between 4am-7am. They are sent out around 8am. The newsletter is attractively priced and the format is a unique numbered point form; giving clarity to each point and saving valuable reading time.
Risks, Disclaimers, Legal
Stewart Thomson is no longer an investment advisor. The information provided by Stewart and Graceland Updates is for general information purposes only. Before taking any action on any investment, it is imperative that you consult with multiple properly licensed, experienced and qualifed investment advisors and get numerous opinions before taking any action. Your minimum risk on any investment in the world is 100% loss of all your money. You may be taking or preparing to take leveraged positions in investments and not know it, exposing yourself to unlimited risks. This is highly concerning if you are an invetor in any derivatives products. There is an approx $700 trillion OTC Derivatives Iceberg with a tiny portion written off officially. The bottom line:

 The world authorities have run out of ammunition as rates remain stuck at zero. They have no margin for error as economy falters
The world economy is disturbingly close to stall speed. The United Nations has cut its global growth forecast for this year to 2.8pc, the latest of the multinational bodies to retreat.
We are not yet in the danger zone but this pace is only slightly above the 2.5pc rate that used to be regarded as a recession for the international system as a whole.
It leaves a thin safety buffer against any economic shock – most potently if China abandons its crawling dollar peg and resorts to ‘beggar-thy-neighbour’ policies, transmitting a further deflationary shock across the global economy.
The longer this soggy patch drags on, the greater the risk that the six-year….continue reading HERE

 The Chinese stock market’s spectacular run is turning into a stagger:
Two more Hong Kong stocks collapse after Hanergy crash
(AFP) — Two of Hong Kong’s best-performing stocks plunged more than 40 percent Thursday, a day after a mysterious crash of almost 50 percent in Chinese solar firm Hanergy that saw almost $20 billion wiped off its market value.
Goldin Financial sank 43.34 percent to HK$17.48 and Goldin Properties crashed 40.91 percent to HK$14.36, after soaring more than 300 percent since the start of January, according to Bloomberg News.
The drop slashed the firms’ combined market value by more than $20 billion.
The companies, which have interests ranging from property development in Hong Kong and China to vineyards in
California and France are owned by Chinese tycoon Pan Sutong.
The dramatic sell-off came after a 47 percent dive in Beijing-based solar energy firm Hanergy Thin Film Power (HTF).
Trading in the firm was suspended after 24 minutes, but not before $19 billion was struck off the firm’s value. The company said it would make an announcement containing “insider information” in the wake of the suspension, although it has not yet done so. HTF had surged more than sixfold in the past year, making it the world’s largest solar power company by market value, but prompting questions over its valuation and revenue sources.
Even by tech standards, those are big, fast moves. And the bull market in which they occurred is also pretty epic. From London’s Telegraph:
China’s stock market bubble shows no sign of bursting yet
Last week I wrote that the market in German Bunds had become a bit too exciting for some investors. By the orderly standards of fixed income investing, the ups and downs of bond prices may have been a bit frisky. But they pale into insignificance compared to what’s going on in Shanghai and Shenzhen. China is becoming the Wild West of investment.
Since the start of the year, the Shanghai index has risen by 37pc and its sister exchange in Shenzhen is up by 53pc. Over the past year the two markets have risen by 122pc and 96pc respectively. That’s punchy enough, but it fails to tell the whole story. Many individual shares have done much more. Beijing Baofeng Technology, a video company, rose by 44pc on its first day on the Shenzhen market in March and then by the 10pc daily limit each day every day for a month. It is currently worth more than 40 times its IPO price. The flotation was nearly 300 times oversubscribed.
Consider, too, that around half the stocks listed in Shenzhen are valued at more than 50 times their expected earnings and nearly a fifth at more than 100 times. Margin trading, where investors buy shares with borrowed money, has more than quadrupled since last summer to be worth nearly £200bn. At 8pc of total trading volumes, these risky trades have reached a level that not even previous manias in Taiwan and Japan approached. The average valuation multiple on Shenzhen’s index for start-ups, ChiNext, is over 100 despite (or because of) the fact that one in five of the companies listed there is not even covered by any investment analysts.
There’s more. The volume of trading on China’s major exchanges has reached nearly £140bn on several days this year. That’s around four times the value of daily deals on the New York Stock Exchange. In one week recently, a record 3.3m new trading accounts were opened. There are now more than 200m accounts being used by an estimated 100m investors. Worryingly, half of these new investors received no education beyond high school against a quarter of existing account holders. The shoe-shine boys are tipping stocks again.
Why this bubble now? Because of the usual mix of catalysts: Aggressive government borrowing abetted by a central bank that most people expect will shortly join the global currency war, and, as the Telegraph article notes, deregulation that has allowed millions of new players (most with a limited understanding of how share prices normally relate to underlying earnings) to belly up to the buffet.
What happens next is also pretty standard, and it generally begins with a few notable high fliers that never should have been reverting to their true value. We won’t know if these are them until after the fact, but today’s numbers do make the inevitable look imminent.

It always has been. And on a value basis, it’s also a good buy. Silver has been chugging more than gold but once it pops up, it could take off like a bandit.
There are many reasons why silver will go higher and it’s just a matter of time. And as our dear friend Richard Russell points out, JP Morgan is aggressively accumulating physical silver by the hundreds of millions of ounces.
This is the largest accumulation of physical silver by a private entity in history!
Plus, it’s three times the 100 million ounces acquired by the Hunt Brothers in 1980 or by Warren Buffet in 1998.
Some of you may remember when the Hunt Brothers tried to corner the silver market at the peak in 1980 when silver soared to the $50 level. It was a wild moment. And today is even more wild.
Headed Higher
JP Morgan obviously thinks silver is going up, and we do too. We think your patience today will be well rewarded in a future rise.
Alan Greenspan also believes gold will be considerably higher in the years ahead. So it’s not only central bankers who are looking ahead. Others are too.
Chart 1 shows silver close up since 2013. It has steps, like gold, as you can see. Keep an eye on these levels as they’ll tell the story.

First of all, it’s important for silver to continue holding above its seven month support at $15.40. If it then rises and stays above both its old 2013 support and 65 week moving average at $18.50 and $18.20, it’ll start on a bullish path.
Silver could then jump up to the $22 -$24 levels, its next step. By then, it could clearly test the $30, which would be the following step.
The bottom line is, silver has great potential and it appears to be leading the other metals.

Last week we wrote that the precious metals complex had not broken out yet and had more work to do before it could attempt a true breakout. The metals had some more upside and so did the shares. However, the poor performance of the shares this past week could warn of a larger reversal.
We thought the gold miners could rally up to resistance at the 400-day moving average. Instead of pushing a bit higher, their rally reversed course at the 200-day moving average. Note the action since last summer. The miners had a strong rally up to the 400-dma and later recovered to both moving averages when they were quite close in January. This recent rally did not reach the 400-dma and that signals weakness.
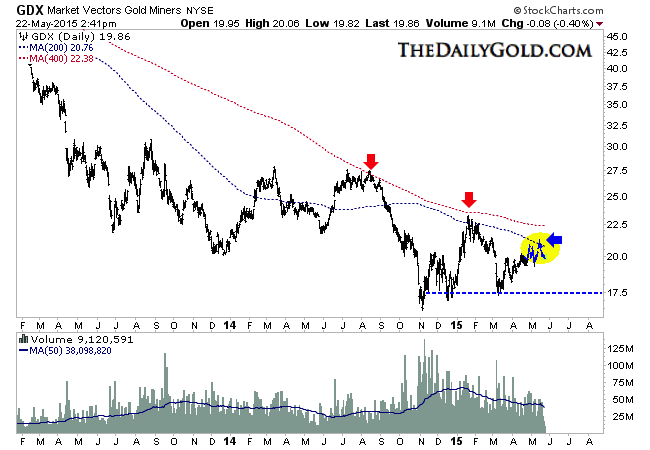
GDX Daily
The weakness in the shares is a warning sign for the entire complex and could also be a signal that the metals have not bottomed yet. Over the past eight months Gold and Silver have essentially traded in a tight range (except for several weeks). Gold has spent most of that period between $1150 and $1225 while Silver has spent most of that time between $15.50 and $17.50. The metals’ failure to extend recent strength could signal a move down to the bottom of those ranges and threaten a breakdown.
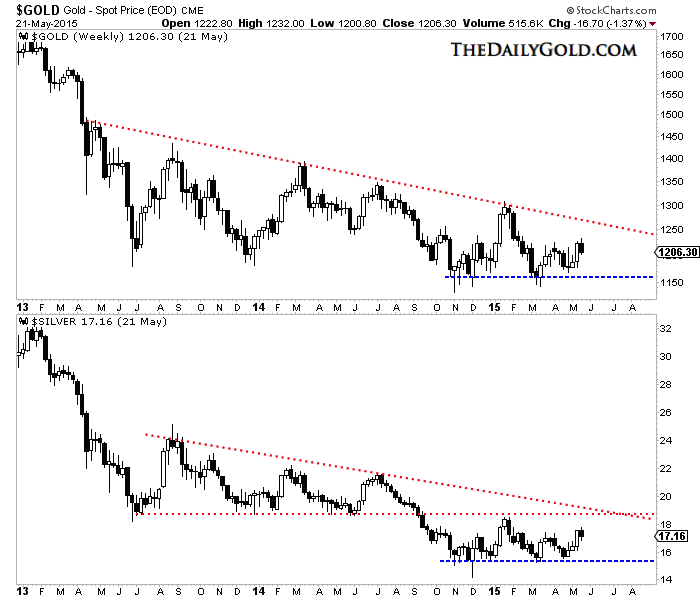
Gold & Silver Weekly
Last week we noted that gold miners would only truly breakout (above their 80-week moving averages) if metals were to surpass their January highs.
I’m skeptical metals will do that on this rebound as their relative performance is weak considering the big drop in the US$. The worst is likely over for the miners but if Gold can’t reach or takeout its January high then the miners are at risk for remaining in the range they have been in for the past eight months. Until something changes, buying support and oversold conditions works better than chasing strength.
GDX has 12% downside to strong support and 17% downside to its daily low. Be patient and use support to your advantage. If metals are heading to new lows then it would likely create one last chance to buy miners at fire sale prices. Consider learning more about our premium service including our current favorite junior miners which we expect to outperform in the second half of 2015.
Jordan Roy-Byrne, CMT


-
I know Mike is a very solid investor and respect his opinions very much. So if he says pay attention to this or that - I will.
~ Dale G.
-
I've started managing my own investments so view Michael's site as a one-stop shop from which to get information and perspectives.
~ Dave E.
-
Michael offers easy reading, honest, common sense information that anyone can use in a practical manner.
~ der_al.
-
A sane voice in a scrambled investment world.
~ Ed R.
Inside Edge Pro Contributors

Greg Weldon

Josef Schachter

Tyler Bollhorn

Ryan Irvine

Paul Beattie

Martin Straith

Patrick Ceresna

Mark Leibovit

James Thorne

Victor Adair