
Personal Finance
Is Your Money Safe?
 We saw it happen in Cyprus, too. The government there (working with the big banks) changed the terms of the deal – suddenly and, for depositors, catastrophically.
It gave big depositors – with over $100,000 in the bank – a haircut and a shave equal to nearly half their money. Why?
The Cypriot banks had bought Greek government debt. The fall in value of those bonds (the Greeks couldn’t pay then, either) left the banks on the edge of bankruptcy.
The loss was very real. Who ended up paying for it?
The banks that made the bad investments? The government that regulated the banks and forced them to buy government bonds?
Nope. The depositors! Innocent, but perhaps naïve, the depositors got scalped.
And now, Greek depositors – the smart ones, at least – are taking precautions. They yanked out €3 billion ($3.4 billion) this week – or about one-quarter of all deposits for the year.
In the U.S., the FDIC guarantees individual deposits at member banks up to $250,000.
How good is that guarantee?
In a pinch, all sorts of things that you took for granted suddenly have question marks behind them.
What’s the bank’s collateral really worth? How much does the bank have in reserves? How much does the FDIC have? How long will I have to wait to get my money? What will it be worth then? What will I do in the meantime?
You may want to take precautions too.
….read more from Bill Bonner on Markets, Europe & Greece HERE

It was another volatile week in the markets. The interest rate decision by the U.S. Fed on Wednesday was a non-event with no change in the Fed’s monetary policy. The market reacted with a spike in stocks, bonds, and precious metals, while the U.S. dollar took a dive. Also, the unfolding drama in Greece spooked markets and metals; stock markets are nervous while metals mostly get bids each time the Greek crisis flares up.
We focus on gold’s seasonality in this column and what it could mean for gold’s secular trend.
Between 1982 and 2012, gold typically started rising in early July, corrected slightly in October, and finished the year strongly higher. The first chart, courtesy of our friend, author, and market analyst Dimitri Speck, shows that the second week of June typically kicked off the yearly rise with a final dip.

Courtesy: Seasonal Charts
Included within that 30 year time frame was a secular bear market (until 2001) and a secular bull market (as of 2002). We look more closely at gold’s seasonality since the secular bull market started in 2002. The second chart, courtesy of
StockCharts, shows the number of months in which gold closed higher than it opened. Clearly, July through September stand out with the largest number of higher monthly closes, while October is one of the weakest months in the year.

The same seasonality picture for the period between 1990 and 2000, the last decade of gold’s secular bear market, shows a random picture of up and down months, without a consistent rise during the summer months. We assume that is typical behavior during a weak market.

We conclude that gold bulls want a strong summer which will confirm that the gold secular bull market is still intact.
Looking one level deeper into the summer rallies in the current secular bull, we found some interesting insights. The table below shows the exact period in which gold had a summer rally, along with the % price rise in USD. Interestingly, we see that gold started to rally between June and mid-July in 8 out of the last 10 years. Over that same period, the average price rise during those rallies was 16.3%.
What does this mean in the context of the current cyclical bear market within gold’s secular bull? To answer that question we rely on the long term trendlines on the weekly and monthly charts. The trendline on the weekly is marked in red.

The general rule is that the significance of a trendline increases substantially with every touchpoint. The red trendline on the weekly chart has the highest number of touchpoints. We believe that gold broke out mid-March of this year, as indicated with the green oval. One could argue that the breakout went unnoticed, as few have spoken about this “event,” concluding that it was unimportant. Our view is the opposite. Because it went unnoticed during a cyclical correction (bear market), it increases the odds that it was THE important event. That is how bear markets end, and especially when nobody talks about it.
This summer’s seasonality is quite important. If gold’s summer rally is strong, we will conclude two things. First, we will have a confirmation of the seasonal trend during the secular bull market, increasing the probability that the secular bull is still intact. Second, the probability increases that the breakout point already occurred in March.
However, even if the summer rally does not occur and we see a continuation of the sideways pattern, there is still evidence that gold remains in a secular bull market. The next chart shows that the secular trendline marked in blue will touch the $1200 price level in about a year. That means gold can trade sideways for a year without invalidating its secular bull trend.

Smart investors do not anticipate a particular move, they prepare themselves for what is likely to happen. A breakout in gold and silver is a high probability move. That is why we recommend an investing roadmap based on the very best gold and silver plays.
It is our duty to select those investments in the Gold & Silver Report!

 Despite the greatest government rescue operations of all time, the U.S. economic recovery has been one of the weakest in history. Most Americans continue to suffer through tough times. And new dangers loom.
Indeed, the pattern of the past 15 years is now clear: First a great speculative bubble … then a great bust … followed by massive government stimulus, bailouts and money printing … and then … still another, even greater bubble.
Invariably, when the dust settles from each bubble-and-bust cycle, some people make fortunes. But millions of average hard-working people lose their jobs, sink deeper into debt, and even risk abject poverty.
Right now, a series of time bombs, planted years ago, are beginning to explode all over the world
Fourteen years minus three months ago, a small group of terrorists attacked the very heart of our nation. They killed almost 3,000 people. They caused at least $10 billion in damage.
They set off a tragic chain of events that have continued to ricochet through time, with a tremendous cost in life — and treasure: The U.S. invasion of Iraq. The fall of Saddam Hussein. The emergence of al Qaeda in Iraq. And now, the rise of the Islamic State, the most brutal, most powerful terrorist organization of all time.
This chain of events has greatly weakened our nation’s leadership in the world. It has propelled our government to spy on us. And it has now brought us around full circle to the danger of larger terrorist attacks than 9-11.
At the same time, in parallel to the global war on terror, we’ve also had a global war on financial crises.
Fifteen years and six months ago, well before al-Qaeda’s first attacks on America, our tech stocks began to crumble, only to crash even further after 9-11.
Over $5 trillion in equity value was wiped out. Our entire economy was temporarily paralyzed. And that crisis also set off a tragic chain of economic events that continue to ricochet through time: Radical interest-rate cuts by Fed Chairman Greenspan.
A great housing bubble — and bust. The implosion of major Wall Street firms. The emergence of a deadly debt crisis. And the most risky and largest Fed money-printing operation of all time, under Fed Chairmen Bernanke and Yellen, pumping $4 trillion into the U.S. banking system.
This chain of events has been a big factor in the recovery of the American economy. But it has also propelled many investors to take unprecedented risks. And it’s likely to bring us around full circle to the brink of another, potentially bigger, financial crisis.
 The global war on terror. The global war on financial crisis. Two parallel and powerful historical sequences that are gaining momentum and reaching a crescendo.
But they are only two of the global crises now smoldering and spreading globally. So let me show you some maps that tell the story in a nutshell.
Here are all the countries of the world today where the Islamic State has conquered territory, has mounted massive brutal attacks on the local population or has successfully enlisted affiliate organizations that conquer and attack — much of the Middle East, North Africa and Asia. And that’s just the Islamic State.
These are the countries involved in some kind of civil or international wars. Look at how the red has virtually taken over the globe.
And while we’re talking about red ink, here are the countries burdened with heavy debts and big deficits, many of which they will never be able to pay. That includes all of North America, most of Europe, plus the two most populous countries of the world — China and Japan.
All this sounds very bad, doesn’t it?
Well, it is. But there’s also a silver lining, especially for the United States. Of all the countries on all these maps, the only one that combines a powerful military, a stable government, a huge economy and, most important, giant liquid financial markets is the United States.
Despite America’s big debts, government gridlock, and past stumbles, it is now viewed as the last remaining large safe haven on the planet.
 As a result, the geopolitical and financial troubles overseas are driving huge amounts of money into U.S. markets. In fact, based on data from the IMF and OECD, total foreign ownership of U.S. assets rose from $16.6 trillion in 2009 to nearly $27 trillion in 2014. That’s a total of $10 trillion that has flowed into U.S. investments from abroad.
Again, remember the great sequence of events of our times:
Extreme easy money in the 1990s, leading to a tech bubble and the Great Tech Wreck …
Even more extreme easy money in the early 2000s, leading to the housing bubble and the Great Debt Crisis …
And now, the most extreme easy money of all time, leading to an unprecedented bubble in bond markets and government debt, the subject of my column next week.
Good luck and God bless!
Martin

Two weeks ago, I stated that that the markets were oversold enough for a bounce. That bounce came with a vengence this week as the lack of Fed action on raising interest rates spurred the bulls with a continuation of ultra-accomodative policy.
- Important Note: There have been MANY articles/commentaries suggesting that the bull market won’t end when the Fed starts raising interest rates. Despite much evidence to the contrary, here is a thought – IF the markets continue to rally each time the Fed DELAYS hiking rates, what do you think will happen WHEN they actually do? Just something to think about.
The problem is that the rally this past week retested the previously violated bullish uptrend. As I discussed with one of my favorite reporters yesterday:
“While the rally this week was nice, it failed to break back above resistance which it needs to do to reestablish the bullish trend. Currently, the markets have held the long-term bullish trend line that has remained intact since December of 2012 with two successful tests over the past month. That is bullish for now and indicates buyers are still in the market. However, there is a BATTLE being waged between the bulls and the bears as prices have continued to deteriorate from early-year highs. That battle should be resolved soon, and for now the bears have the advantage.“
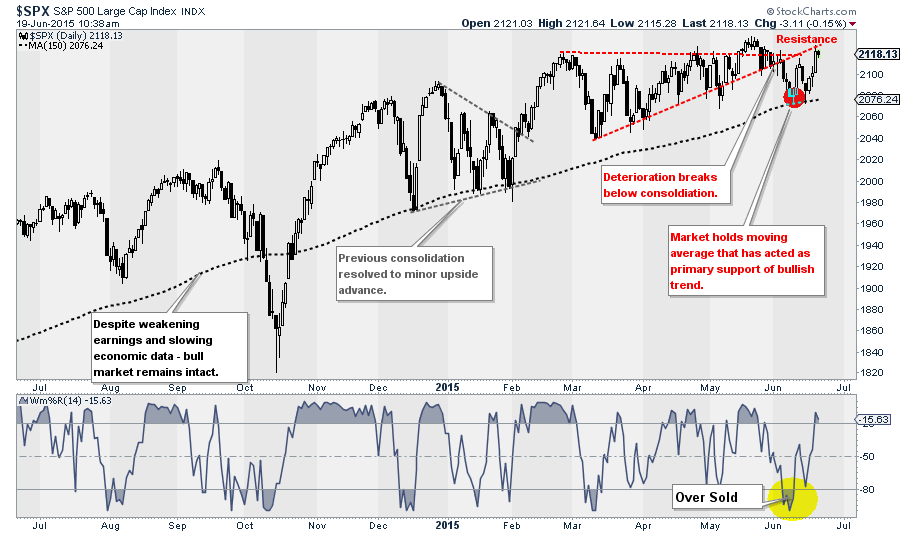
 Importantly, notice that the previoulsy OVERSOLD condition in the lower panel is now back to OVERBOUGHT. This suggests that the rally is likely near completion. This does not mean that the markets can NOT rally to new highs, they certainly could. However, the risk, for the moment is to the downside. However, as stated above, the BULLISH TREND remains intact which keeps portfolios allocated towards equities.
Very importantly, the last sentence above does not mean that the elevated risks that currently prevail should be ignored. As I stated…..
…..click HERE or on the “inside THIS ISSUE” to read more

Watch out! That is what the headline said on the cover of the latest edition of The Economist (June 13-19, 2015). The world is not ready for the next recession. The Economist went on to declare “the fight against financial chaos and deflation is won”….the IMF says, for the first time since 2007 every advanced economy will expand…. Growth should exceed 2% for the first time since 2010….and (the Fed) is likely to raise rock-bottom interest rates.”
Well that is the forecast of the IMF. The Economist doesn’t seem to be quite as optimistic as even their 2015 forecast is suggesting GDP growth of 2.3% for the US, 0.8% for Japan, 1.8% for Canada and 1.5% for the Euro zone. That seems a bit shy of 2% for the rich world. At least The Economist admitted there remains risk from the “Greek debt saga” to “China’s shaky markets”. But one of the big problems is that six years following the biggest financial crisis since the Great Depression the global economy is at best muddling along while the risks appear to be rising not falling.
Take Greece as an example. There are many who believe that Greece is not much of a problem given that they only represent roughly 2% of the Euro zone economy. On the other hand, there are many who believe that a Greek default could represent a Lehman Brothers moment for the Euro zone. If there is a difference the collapse of Lehman Brothers in September 2008 came as a shock to the market while the potential for a Greek default has been “in the headlines” for months. On the other hand, someone, most likely the ECB, the Bundesbank, or the IMF could be left holding worthless Greece debt. It is believed that the EU banks are no longer exposed to Greece. What is unknown is whether the collapse of Greece could spread to other countries (contagion).
Whether Greece stays or leaves the EU or continues to use the Euro should not be a major concern. There are countries who are not EU members but use the Euro (Kosovo, Montenegro and others) and there are countries who are members of the EU but do not use the Euro (United Kingdom, Poland and others). If there are fears concerning Greece, it is the potential for contagion. The entire Euro zone is in need of reform not just Greece. If Greece collapses and leaves the Euro zone the focus could shift to other countries in the Euro zone where the problems with pensions and the social welfare system are not much different. Italy and France are the most mentioned as other potential debt bombs waiting to go off but there are numerous other Euro zone countries that have debt problems as well. The thought of the potential for more sovereign defaults could put further upward pressure on interest rates.
Greece has numerous other problems that go beyond the headlines of the ongoing negotiations with its creditors. There has been considerable social unrest. There have been numerous suicides as people fail to cope with the ongoing crisis. Withdrawals from the banking system have continued at a rapid pace with word that depositors pulled some €2 billion out of the banking system in a matter of 3 days recently. That is double what the ECB recently provided the Greek banks as emergency liquidity assistance (ELA). Capital controls could be next as was seen in Cyprus in 2013. Official unemployment is 25.6% but youth unemployment exceeds 50%. Yet they talk about Greece being only in a recession. Many others believe the evidence suggests they are in a depression.
China has been one of the largest borrowers since the financial crisis of 2008. Chinese debt has soared by upwards of $30 trillion more than quadrupling debt since 2007. The Chinese total debt (government, corporate, household) has soared to around 300% of GDP a level that puts them closer to the US and larger than Germany. Much of the new debt has emanated in China’s overheated real estate market or the unregulated shadow banking system. As well, numerous local governments have issued potentially unsustainable levels of debt.
All of this comes against the background of a slowing Chinese economy. Chinese trade data suggests that China’s growth may be slowing faster than the government wants. As well, the Chinese stock market has soared into what many term as bubble territory as it has drawn in numerous retail traders and other speculators looking to make a quick buck (or is it Yuan). If there is any positive to this massive debt growth in China is that the central bank (PBOC) still has considerable capacity to bail out the economy if it should falter further or if defaults mount. Chinese GDP growth has recently fallen under 7% the lowest level in years.
Debt could become a “dirty” word. China and Greece are in some respects just the tip of the iceberg. Yet oddly, The Economist article appears to pay lip service only to what potentially could become a huge problem. Average debt to GDP ratios have grown sharply since the 2008 financial collapse and are estimated on average to have grown 40%. There are a couple of ways of measuring debt to GDP. The most common is government debt to GDP. According to December 2014 figures government debt to GDP for the G7 countries were as follows: Japan 230%, Italy 132%, USA 102%, France 95%, United Kingdom 89%, Canada 87% and Germany 75%. Anything over 100% takes at least 1-2% off GDP growth.
When one takes into consideration total debt (government, corporate and household), the numbers can be even more astounding. The following is the total debt to GDP (public plus private) for the G7 as of 2013. The levels are most likely higher today: Japan 650%, United Kingdom 550%, US 350%, Canada 300% and the Euro zone 475%. It is estimated today that global debt has grown to $223 trillion from roughly $157 trillion in 2008. The growth rate of debt has far surpassed the growth rate of GDP.
Below is a chart of public and private debt to GDP for the US. Note how sharply it has grown since the depths of around 1950. The chart only goes to Q1 2013. Today total public and private debt to GDP is around 343%. The biggest debt growth for the household since the 2008 financial crisis has been student loans, consumer credit card debt and auto loans (8 year financing for auto loans). And as with the subprime mortgage market that was at the heart of the 2008 financial collapse much of this debt has been securitized and sold off in packages.

Source: www.bls.gov, www.stlouisfed.org, www.cbo.gov, www.census.gov
With all the debt maybe it is not surprising that interest rates are rising. It was only a short while ago that in the Euro zone there was roughly $2.5 trillion of debt trading at negative interest rates. With the recent back up in interest rate yields (prices that move inversely to yields fell); there is apparently only about $1 trillion of debt trading at negative interest rates now. German 10 year bund rates rose by a factor of 10 from roughly 0.08% to over 0.80% since April 2015. On that basis, it would put bund buyers who purchased securities over the past year underwater. It is unknown as to what losses might have occurred given the rapid back up in yields.
Interest rate rises have not been exclusive to the Euro zone. All developed countries have experienced a rise in interest rates mostly at the longer end of the yield curve. All the talk has been about the Fed hiking interest rates. The bond market appears to be doing it for them. Only the Fed doesn’t control the long end of the yield curve as they do with the short end of the curve. The trouble with a rise in interest rates at the long end of the yield curve is that it has a negative impact on a host of loans particularly the mortgage market.
Evidence has suggested that as a result of concerns about the bond market that dealer inventories have been falling, dealers have become more reluctant to make a market for product particularly for corporate bonds, and overall volumes have fallen. Evidence also suggests that bond funds and others have increased their holdings considerably during the market rally in yields that took place between 2013 and 2015.

Source: www.stockcharts.com
The chart of the 10-year German bund shows that the rapid interest rate rise since April has wiped out all of the gains since at least November 2014.

Source: www.stockcharts.com
The longer dated chart of the iShares Barclays 20+ year Treasury bond fund (TLT-NYSE) shows they have fallen $20 since late January 2015. Major support does not come in until down around 100. Major bond market lows have been seen roughly every 6/7 years since the major low in 1981. Major bond lows were seen in 1987, 1994, 2000 and 2006/2007. There was, however, also a major bond sell-off in 1984. Counting from that low using the same 6/7 year cycle there were visible bond lows in 1990, 1997, 2004 and 2010. If that cycle is being followed then a major bond low could be seen in 2016.
Major declines in bond markets have in the past been accompanied by considerable market turmoil. Bond yields were pushed down by overblown expectations for the QE program of the European Central Bank (ECB) and the ongoing QE program of the Bank of Japan (BOJ). The Federal Reserve’s QE program came to an end in October 2014. But expectations in particular from the ECB QE program helped push yields down to new lows (prices to new highs). Now oversupply and growing credit concern has reversed much of the decline in yields quickly. This has a potential negative impact not only for bond speculators but a host of funds and pension funds. Of larger concern is the $700 trillion derivatives market. Interest rate swaps (IRS) dominate that market. In addition Credit Default Swaps (CDS) could also become a problem as was seen during the 2008 financial crisis that brought the giant insurance company AIG close to bankruptcy. Liquidity has suddenly become a concern as buyers dry up and regulatory changes (capital requirements) at the major banks may also be impacting the capability of the major financial institutions to participate in the bond markets.
Bond funds have grown sharply since the 2008 financial crisis pushed by low interest rates and an endless stream of supply. And it has not just been concerns over sovereign debt that has helped push yields back up. The collapse in oil prices has left upwards of $5 trillion worth of oil debt vulnerable. Much of this debt was borrowed at low rates when oil prices were high. This is not to suggest that all this debt is vulnerable but that some portion of it may be vulnerable. Of larger concern might be upwards of $14 trillion of emerging market debt much of it issued in US$. The US$ has gone up sharply since July 2014 with the US$ Index going from 80 to 100. The opposite side of a sharply rising US$ is other currencies have been falling. The result is the US$ debt has become considerably more expensive for those foreign borrowers. Already there have been defaults but it has not yet become major problem.
But if concern over sovereign defaults and other defaults grow there could be a further rush into US$, which would put further pressure on the mountain of US$ debt issued by emerging markets. Finally all the talk of a Fed rate hike has not helped. If the Fed were to hike interest rates in September (and again in December) as many seem to be speculating that could in turn put further upward pressure on the US$ and in turn further pressure on the mountain of US$ debt.
The problem for the central banks is that their ability to respond to another financial crisis and recession has been severely compromised. Central bank balance sheets have experienced explosive growth since the 2008 financial crisis as the chart below attests.

Source: www.qz.com
The key central bank is the Federal Reserve. The Fed has seen its balance sheet explode to $4.5 trillion including $1.7 trillion of mortgage-backed securities of potentially questionable quality. The monetary base has exploded to $3.9 trillion from $875 billion just prior to the financial crisis of 2008. Much of the monetary base is reserves being held for the money centre banks. The monetary base is defined as currency in circulation and reserve balances (deposits held by banks and other depository institutions in their accounts with the Federal Reserve).
No wonder the EU, the USA, Canada and Japan have moved from bailouts to bail-ins in the event of another financial crisis. Bail-ins mean that bond holders and depositors are at risk in the event of another round of bank failures on the scale of what happened in 2008. Traditional methods of fighting a recession have been compromised. With interest rates already at zero or close to it in many of the G7 countries, it is difficult to lower interest rates further. The Fed rate has been at 0-0.25% (mostly 0%) since 2009. No wonder the Fed wants to hike rates so they have room to lower them later. While many are speculating that the Fed will hike in September and even again in December neither is a given. For now, the market is happy that the Fed did not hike interest rates in June.
Greece, China and the bond market are real risks. Yet the stock market continues to trade at or near its record highs. Volatility as measured by the VIX is at or near record lows. Many continue to believe that no matter what, the Fed will “ride to the rescue” in the event of another crisis. As noted, that is not a given.
There is also an overlooked risk. The recent cyber-attack on the Government of Canada’s computers highlights the risks of the potential for an attack on the global financial system. The ongoing tensions in the Ukraine and the South China Seas highlights the growing military tensions that exist today. While many believe the odds of a military clash are low there are many who also believe the odds of cyber warfare is high. This is a consideration that many are overlooking yet the capability of conducting cyber warfare exists with China, Russia, the US, the EU and Japan and others. While cyber warfare works both ways, the thought of major disruptions in the global financial markets could cause considerable chaos.
No wonder there are thoughts that the end game may be in play as tensions play out on the world’s stage.
Copyright 2015 All rights reserved David Chapman
General Disclosures
The information and opinions contained in this report were prepared by Industrial Alliance Securities Inc. (‘IA Securities’). IA Securities is subsidiary of Industrial Alliance Insurance and Financial Services Inc. (‘Industrial Alliance’). Industrial Alliance is a TSX Exchange listed company and as such, IA Securities is an affiliate of Industrial Alliance. The opinions, estimates and projections contained in this report are those of IA Securities as of the date of this report and are subject to change without notice. IA Securities endeavours to ensure that the contents have been compiled or derived from sources that we believe to be reliable and contain information and opinions that are accurate and complete. However, IA Securities makes no representations or warranty, express or implied, in respect thereof, takes no responsibility for any errors and omissions contained herein and accepts no liability whatsoever for any loss arising from any use of, or reliance on, this report or its contents. Information may be available to IA Securities that is not reflected in this report. This report is not to be construed as an offer or solicitation to buy or sell any security. The reader should not rely solely on this report in evaluating whether or not to buy or sell securities of the subject company.
Definitions
“Technical Strategist” means any partner, director, officer, employee or agent of IA Securities who is held out to the public as a strategist or whose responsibilities to IA Securities include the preparation of any written technical market report for distribution to clients or prospective clients of IA Securities which does not include a recommendation with respect to a security.
“Technical Market Report” means any written or electronic communication that IA Securities has distributed or will distribute to its clients or the general public, which contains an strategist’s comments concerning current market technical indicators.
Conflicts of Interest
The technical strategist and or associates who prepared this report are compensated based upon (among other factors) the overall profitability of IA Securities, which may include the profitability of investment banking and related services. In the normal course of its business, IA Securities may provide financial advisory services for issuers. IA Securities will include any further issuer related disclosures as needed.
Technical Strategists Certification
Each IA Securities technical strategist whose name appears on the front page of this technical market report hereby certifies that (i) the opinions expressed in the technical market report accurately reflect the technical strategist’s personal views about the marketplace and are the subject of this report and all strategies mentioned in this report that are covered by such technical strategist and (ii) no part of the technical strategist’s compensation was, is, or will be directly or indirectly, related to the specific views expressed by such technical strategies in this report.
Technical Strategists Trading
IA Securities permits technical strategists to own and trade in the securities and or the derivatives of the sectors discussed herein.
Dissemination of Reports
IA Securities uses its best efforts to disseminate its technical market reports to all clients who are entitled to receive the firm’s technical market reports, contemporaneously on a timely and effective basis in electronic form, via fax or mail. Selected technical market reports may also be posted on the IA Securities website and davidchapman.com.
For Canadian Residents: This report has been approved by IA Securities, which accepts responsibility for this report and its dissemination in Canada. Canadian clients wishing to effect transactions should do so through a qualified salesperson of IA Securities in their particular jurisdiction where their IA is licensed.
For US Residents: This report is not intended for distribution in the United States.
Intellectual Property Notice
The materials contained herein are protected by copyright, trademark and other forms of proprietary rights and are owned or controlled by IA Securities or the party credited as the provider of the information.
Regulatory
IA Securities is a member of the Canadian Investor Protection Fund (‘CIPF’) and the Investment Industry Regulatory Organization of Canada (‘IIROC’).
Copyright
All rights reserved. All material presented in this document may not be reproduced in whole or in part, or further published or distributed or referred to in any manner whatsoever, nor may the information, opinions or conclusions contained in it be referred to without in each case the prior express written consent of IA Securities Inc.


-
I know Mike is a very solid investor and respect his opinions very much. So if he says pay attention to this or that - I will.
~ Dale G.
-
I've started managing my own investments so view Michael's site as a one-stop shop from which to get information and perspectives.
~ Dave E.
-
Michael offers easy reading, honest, common sense information that anyone can use in a practical manner.
~ der_al.
-
A sane voice in a scrambled investment world.
~ Ed R.
Inside Edge Pro Contributors

Greg Weldon

Josef Schachter

Tyler Bollhorn

Ryan Irvine

Paul Beattie

Martin Straith

Patrick Ceresna

Mark Leibovit

James Thorne

Victor Adair