
Currency
Quotable
“And what would you do, … if you could rule the world for a day? I suppose I would have no choice but to abolish reality.”
― Robert Musil, The Man Without Qualities Vol. 1
Commentary & Analysis
Vulnerable Aussie – Chinese stocks and the Reserve Bank of Australia
The Australian dollar has fallen a long way from its high against the US dollar. And from a technical perspective may have done enough; at least it may be poised to “correct” higher in the near- to medium-term. But an examination of the fundamental factors suggests there could be more room to fall—maybe a lot more room.
Two considerations come to mind:
1. The Chinese connection. Over the last few years, when speaking at conferences and peening these missives to Currency Currents readers, I have suggested Australia has become a satellite country of China. A bit of hyperbole? Yes indeed. But used in an effort to make the point Australia’s economy is closely linked with China’s; especially in regards to China’s demand for raw materials.
China’s economy is slowing, most of us know that. But most of us likely don’t give much thought to just how far and how fast economic growth in China has fallen.
From the Financial Times 6/23/15:
20 per cent to less than 6 per cent in the first quarter, which is a much more dramatic slowdown that many people realise,” said Chen Long, China economist at Gavekal Dragonomics in Beijing.
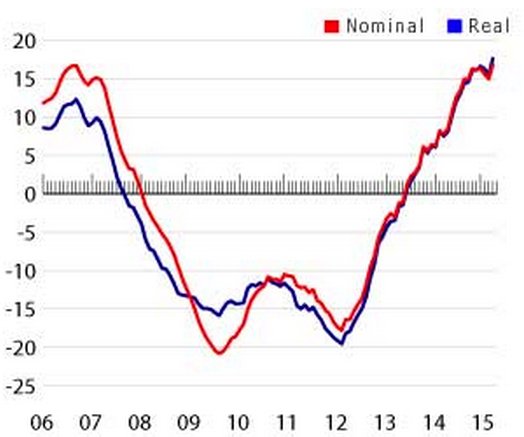
• Revenue growth for companies listed in mainland China, which excludes volatile energy and financial stocks, closely matches the trend in nominal growth rate
From the Financial Times 6/23/15:
- “A lot of the arguments over whether China’s official growth rate of 7 per cent is real or not actually miss the point that the nominal GDP growth rate has fallen from more than 20 per cent to less than 6 per cent in the first quarter, which is a much more dramatic slowdown that many people realise,” said Chen Long, China economist at Gavekal Dragonomics in Beijing.
- Revenue growth for companies listed in mainland China, which excludes volatile energy and financial stocks, closely matches the trend in nominal growth rates over the last decade.


This is a list of the nine markets that had prices jump more than 7% year-over-year based on data from the Global Property Guide. Five of the nine countries were from Europe, with Ireland leading the way:
For the expectations of how much the Irish economy is expected to grow in 2015 and 2016, more analysis on Ireland and the other 8 “hot” markets continue reading HERE

 Habit #1 – Know Your Numbers
“But in my opinion, all things in nature occur mathematically.”
― René Descartes
When I am assessing a business or leader of that business, I listen carefully during the first few minutes of the conversation for the sign of a number, any number! If I hear it, I draw a sigh of relief, knowing that I am talking to someone who is serious about the business. If I don’t hear a number early on, I start to worry and ask a series of close ended questions to tease out some hope, such as: “What was your sales growth last year?”, “What are your gross margins, or any margins for that matter?”,”Can you tell me one or two key ratios?”. This line of questioning invariably separates the wheat from the chaff and the truly exceptional business owners begin to emerge.
In my experience, knowing how to describe your business numerically is one of the top, tell tale traits of exceptional
entrepreneurs, business owners, CEOs, executives and managers. Why? Because good numbers are objective, not a figment of someone’s imagination, dreams, hopes, wishes and desires. Good numbers show how the money flows through a business, which helps clarify the business systems and obstacles. Good numbers show trends which can moderate or accelerate executive actions through enlightenment. Good numbers are a common language and give common comparisons across sectors and the globe.
Here is how I recommend business owners get into the habit of developing financial numeracy skills.
Focus on a critical few, not the trivial many: Identify a small number of key financial indicators, no more than 6. This should include measures of revenue, margins, working capital and cash flow. Don’t try to boil the ocean.
Make it relevant: Pick financial measures that are relevant for your industry sector and stage of growth. This will keep you focused on what truly matters and will give you real and valuable tools to manage and grow the business.
Improve your financial literacy: If you lack a business degree from Wharton, don’t panic. Take some extra education in the form of seminars, webinars, continuing education or what ever works for you. Treat it seriously and you will learn quickly.
Add financial capability to your exceptional team: A top notch CFO, Controller or Accountant is imperative for the success of your business. Hire one and get someone good, really good! Ask them to explain everything to you in detail and make them full partners in managing the entreprise. They must keep their finger on the financial pulse of the business.
Pick good financial indicators: While these may vary by sector and stage, here are a few financial indicators that I look at and are applicable across many situations:
- Revenue (most recent period and change from previous period)
- CAGR (Compound Annual Growth Rate) for a key metric
- Gross Margin % (Revenue – COGS / Revenue)
- Acid Test Ratio (Cash+A/R+S/T Investments / Current Liabilities)
- Current Ratio (Current Assets / Current Liabilities)
- Net Profit Margin (% of Revenues remaining after operating expenses, interest and taxes)
- Cash and Working Capital Measures (i.e. A/R, A/P and Operating Cash Flow Ratio)
Becoming well versed in a few key metrics will give you more clarity in the operations and prospects of your business, while giving your investors, employees and partners more confidence that the business is in good hand. Take the time to learn and do it right!

 Despite the lackluster dog days of summer trading in the financial markets setting upon us — nearly every single market on the board is now setting up for a series of major tipping points.
I told my Real Wealth Report subscribers all about the biggest of them all in my latest issue — including my specific recommendations on how to protect their wealth.
In today’s column, I will tell you what I am seeing — plus I’ll give you a road map to help you see for yourself where the fireworks are likely to begin in each of the major markets.
But before I do, let’s take a look at the major underlying fundamental forces at work.
I’m not going to bore you with all the details, nor am I going to address the stuff of corporate earnings, balance sheets, economic stats, etc.
For in the end, such fundamental analysis tells you only about the past, never about the future.
Instead, what matters most is the mass psyche of the participants in the financial markets and the forces they are truly responding to, each market in its own way.
I see two major fundamental forces at work impacting all markets:
First and foremost is the ramping up of the war cycles that I have been warning you about since late 2012.
Just like the 1930s, the U.S. dollar is showing very resilient strength, due largely to frightened capital fleeing from other parts of the world, especially Europe.
Make no mistake about it: The cycles of war that I have studied — starting in my college years 40 years ago — are real.
They are based on scientific studies of both domestic and international war data extracted from the annals of Raymond Wheeler’s studies on war and subjected to rigorous fact-finding.
They are as concrete as the seasons of the year, and they tell you, in no uncertain terms, when society is likely to be most predisposed to conflict, both domestically and internationally.
The fact is that the war cycles are now ramping up all the way into the year 2020, and with an intensity that even I underestimated.
From Russia and Eastern Europe … to Nigeria … to Iraq and Syria … Jordan … Israel and Gaza.
From the Islamic State in Iraq and Syria (ISIS) killing tens of thousands …
To China, brazenly occupying the South China Sea, the Senkaku and Spratly Islands, hunting down oil and gas resources, ready to wage war if need be …
To Ferguson and Baltimore, merely the beginnings of civil unrest in our own country.
To Texas’ latest move to petition the Federal government to move the state’s $650 billion of gold back to Texas and into a new just-approved vault to be built — a sure-fire sign of the state’s growing desire to secede.
And many of the other secession movements occurring herein the U.S. and in Europe.
Not to mention Greece, which will have to default, no matter what, setting off a major crisis in the hair-brained single currency and economic union experiment of Europe’s inept leaders.
And if all that isn’t bad enough, the war cycles won’t stop there …
Second, are the draconian financial war measures that Western world leaders in Europe, Japan and the U.S. are implementing because of their country’s bankrupt socialist policies and balance sheets.
I’m talking about how leaders in Europe, Japan and the United States wage war against their own citizens.
How they hunt down the rich and raise a battle cry for class warfare … which later backfires by widening the gap between the rich and poor, often driving the rich out of town, along with their companies and jobs.
How they target the average citizen, by camouflaging hidden tax increases (such as Obamacare) and gimmicky retirement programs that merely lock up your capital for their benefit.
How they brazenly transfer wealth from you to government coffers, such as Europe has done in the Cyprus haircut, forcing bank depositors to pay when banks fail …
How they openly endorse the IMF’s recent 10 percent wealth surtax on every citizen, already in the works in Europe … and also actively considered behind closed doors in Washington.
How they are now moving, especially in Europe, toward capital controls and even toward a cashless society.
Then there’s all that spying going on, all that trampling of basic rights to liberty, privacy and other basic freedoms — all of which remain in place.
It’s all part and parcel of how bankrupt empires fade away into the sunset, and we will be no different.
The crisis is picking up steam each and every day, and according to my models, will not peak until at least 2020.
And all of it is already beginning to have an astounding impact on financial markets.
The dollar, for example, remains poised for substantial new highs. Why? Because trillions are still flooding into our markets, the last bastions of capitalism.
Ironically, the strong dollar though will eventually prove to be the kiss of death for our economy and our government’s finances. It will usher in even more deflation, more hoarding of wealth, and make our government’s debt burden all that more unsustainable.
 And even more ironically, despite all the troubles the world faces, the U.S. equity markets will remain extremely resilient longer-term as rising civil unrest and international conflict throughout the world pours into U.S. equity markets.
Also consider crude oil. Think its bear market is over? No, it isn’t. Instead, its recent bounce is nearly over and a new leg down will soon begin.
Why? For a fundamental explanation, it’s simple. First, the global economy is weakening. Second, OPEC members are ramping up their war against our newly built energy supplies by flooding the market with their oil, looking to put U.S. shale producers out of business.
Then there are the agricultural and soft commodities, still caught in a severe slump, with new, much deeper lows ahead still for wheat, corn, soybeans, for bean oil, for coffee, sugar, cocoa and more.
Then there are the precious metals, which have not yet bottomed. But when they do bottom — in the not-too-distant-future — will be the buys of a century …
Not because of inflation fears, but instead, because the Western world governments of Europe, Japan and the United States will soon begin to crumble right before our very eyes.
Right now, my best advice is to watch my weekly system support and resistance levels, which I outline for you below:
For gold: Support lies at the $1,169 level, followed by $1,137, $1,127 and $1,119.
A closing below $1,119 should pave the way to a move to longer-term support levels, which stand at $1,027, $997, $925, $900 and $825.
Overhead resistance is formidable at $1,205 and $1,225.
Silver: Support remains at $15.26, a break of which will lead to a re-test of the $14.50 level. A close below $14.50 will lead to a new leg down to the $12.50 level.
Overhead resistance is formidable at $16.50 and $16.75.
Mining shares: Headed still lower. Do NOT buy any at this time.
Crude Oil: Resistance still at the $64 and $68 levels. Key support levels are still at the $44.80, $41.00, and $39.00 levels. A close below $39.00 will set off a plunge to the $30 level, where I expect crude oil to bottom, mid-2016.
U.S. Dollar, basis the U.S. Dollar Index, nearest futures (DXU5): Resistance at 100.90 and 101.75. Support at the 94.00 and 92.42 levels.
A close above 101.75 will see the dollar rocket higher, with my target becoming the 112 area.
Dow Industrials: The danger of a correction is still there. But, long-term, the U.S. equity markets are headed much higher.
MAJOR resistance still holding at the 18,500 to 18,600 level. Major long-term support — which will likely be tested before there is any major new move higher — at 16,300 followed by 14,800.
Best wishes, and stay safe …
Larry


-
I know Mike is a very solid investor and respect his opinions very much. So if he says pay attention to this or that - I will.
~ Dale G.
-
I've started managing my own investments so view Michael's site as a one-stop shop from which to get information and perspectives.
~ Dave E.
-
Michael offers easy reading, honest, common sense information that anyone can use in a practical manner.
~ der_al.
-
A sane voice in a scrambled investment world.
~ Ed R.
Inside Edge Pro Contributors

Greg Weldon

Josef Schachter

Tyler Bollhorn

Ryan Irvine

Paul Beattie

Martin Straith

Patrick Ceresna

Mark Leibovit

James Thorne

Victor Adair