
Stocks & Equities
Volatility. It is what we expected and it is what we have with Tuesday’s big down and upward reversal, down hard again yesterday and today very green in pre-market. This volatility applies to most assets markets including the precious metals. It is the nature of the beast during a news-rich summer, with many operators on vacation or semi-vacation (with some players not able to resist peeking?).
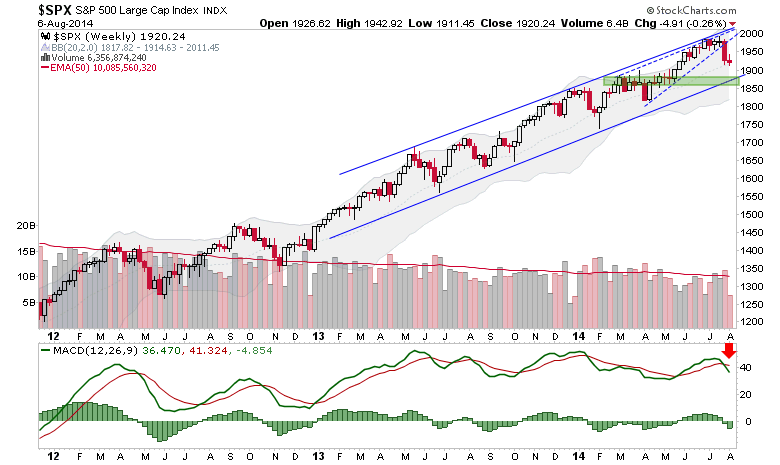
The S&P 500 has satisfied the 1st level of anticipated correction by weekly chart. It does not look like much, does it?

But it has been enough to launch pessimism to its highest level in many months. One definition of volatility: “liable to display rapid changes of emotion.” This is perfect for the whipsaw up and down backdrop going on by daily charts.

SPX daily shows that story clearly, with large swings up and down with a downward bias (series of lower highs and lower lows) since topping in mid-May.

Given the fading participation we noted last week (by Bullish % indexes) and the daily down trends (weekly remains up), the market is now bearish until it proves bullish on a short-term basis. Long-term it remains in bullish trends until it proves otherwise. In the meantime, welcome to volatile Whipsaw City.
Here is the updated sentiment indicator graph (courtesy of Sentimentrader.com) showing that people got a little braver yesterday.

With this morning’s burst of joy about some Greek noise this reading should get tamped down some more. Meanwhile, the pre-market pop implied in the futures will only bring SPX back to the top of the recent range and resistance. More resistance is at the EMA 50 and SMA 50 around 2100.
Bottom Line
Sentiment became unsustainable in its bearishness and the market had to bounce to clear this condition. The whipsaw continues and parameters are clear. Until these resistance parameters are cleared and held it is a risky thing to be buying stocks just because the whipsaw happens to be whipping upward today.
Excerpted from an extensive multi-market NFTRH update (including global stocks, commodities and precious metals) yesterday morning:
NFTRH.com and Biiwii.com

The precious metals sector is enduring losses for the third straight week. The gold miners and Silver have led the way down, though Silver has rallied over the past two sessions. Gold has also rallied yet remains dangerously close to making a new weekly low for the bear market. While the metals recovered some losses on Wednesday and Thursday, the gold miners failed to generate anything positive and closed near their lows for each session. The inability of the miners to recover to even a small degree augurs badly for the entire sector in the days ahead.
Continued weakness in the miners is not much of a surprise considering they are breaking down from their 2008 and 2014 lows. We plot monthly bars below for GDM (forerunner to GDX) and the HUI. GDM closed at 468 and lacks strong support until 400. The HUI is in full blown breakdown mode and does not have strong support until the low 100s.

In the chart below we plot the HUI’s weekly price going back 20 years and two oscillators which can serve as overbought and oversold indicators. We plot the HUI’s distance from its 40-week exponential moving average and its rolling 40-week rate of change. The HUI is certainly oversold but these two oscillators argue the HUI is some distance from reaching the extreme oversold condition seen in spring 2013, late 2008 and late 2000.

Turning to Gold, it appears ripe for a breakdown below $1150/oz in the days ahead. If that comes to pass, then the focus should be on its next strong support around $1000/oz to $1040/oz. The chart below includes the weekly plot of Gold as well as the net speculative position as a percentage of open interest. The net speculative position will be updated Friday and figures to be close to 10%. In our view that needs to go below 5% (the 2013 low) for sentiment to be considered extreme. A reading below 5% would mark a 14-year low.

We appear to be in the early stages of the final act in this precious metals bear market. Gold breaking below $1140-$1150/oz could put us in the middle stages. Our work shows that miners are not yet extremely oversold and have room to fall before reaching strong support. Gold breaking below $1150/oz and then $1100/oz would initiate further losses in the miners and bring them very close to that extreme oversold condition. It is the combination of an extreme oversold condition coupled with strong technical support that creates a very favorable buying opportunity.
A few weeks ago we noted that it was potentially a very dangerous time for bulls. It still its. However, the closer the miners get to extremely oversold and the closer Gold is to $1000/oz then the closer we are to risk favoring the bulls. It is always darkest before dawn. At somepoint within a few months, the switch will flip and we could have some epic buying opportunities in the precious metals complex.
Consider learning more about our premium service including our favorite junior miners which we expect to outperform in the second half of 2015.

 It looks like the Federal Open Market Committee, in the Fed minutes, may have to change its target on raising rates as the global economic story continues to change minute by minute.
The Fed, while saying that outlook for the rate hike still looked good, is possibly worried about China and Greece concerns that may cause the Fed to rethink that target. The concern is that plunging commodity prices may start to cement in a deflationary mood to the market. Also, it’s possible a rate-hike in the United States may cause even more harm to those Euro zone markets. Also, we could harm our markets–a possible capital flight could raise the dollar to dangerous levels.
Despite the turmoil in China, and Europe economic data out of Japan and Germany and an artificial rally in the Shanghai composite is giving crude oil some hope.
LONDON – This morning, a desperate message from our analyst in Beijing puts us in a lighthearted mood:
 I’m sure you must have heard about the recent disaster in the Chinese stock market.
It’s my first time experiencing something like this. And it shocked me. It’s like the world is suddenly turning upside-down. Everyone is running for themselves.
People here feel hopeless, as they see so many government bailout plans fail.
There are so many rumors I can’t tell what’s true and what’s not. Some even said that it was U.S. capital shorting Chinese index futures.
Opportunities Everywhere!
At the Diary, we always look on the bright side: We see opportunity everywhere.
Investors in U.S. stocks seemed to wake up yesterday with a start. They didn’t panic. But they were at least beginning to worry. The Dow dropped 261 points – wiping 1.5% off its value.
There is probably a lot more where that came – an opportunity on the downside.
To recap: Greece’s creditors have given Athens until midnight to come up with an acceptable reform plan.
Nobody knows what will happen. But Greeks are pulling as much cash out of ATMs as they can…
There have been lines at gas stations and food stores…
And Greek stocks are selling with as much as 20% dividend yield and just over two times earnings. This could be a (highly speculative) opportunity on the upside.
Meanwhile in China, investors have seen roughly $3.5 trillion in paper wealth evaporate over the last two months… as stock prices there plunged.
The Chinese are not sophisticated stock market investors. They have only been at it for a few decades. So, they tend to get over-excited in both directions.
It was only a few weeks ago that Chinese brokers were opening new accounts in record numbers. From farmers to hairdressers, everyone was itching to get a piece of the action, as the stock market soared.
A Gambler’s Market
It isn’t the first boom and bust for China. Between 2005 and 2007, Chinese stocks rose nearly 500%.
Then, too, the moms and pops rushed in, hoping to make their fortunes. In 2008, the market crashed, losing 73% of its value.
In the 12 months leading up to the peak of the recent rally, on June 12, Shanghai stocks gained about 150%. Now, the Shanghai Composite Index is down by just under one-third.
These ups and downs are great for seasoned investors. The idea is to buy low and sell high. What better place to do it than where prices go very high and very low?
When you are investing in stocks, you either earn returns as the companies you own equity in become more profitable, or you take returns from other investors.
So if you are hoping to make money in U.S. stocks, at current prices, you have a hard row to hoe. The economy is barely growing and corporate profits are already near record levels.
In China, there are more stock market gamblers than there are in the U.S. They buy too high and sell too low.
Overnight, Chinese stocks surprised to the upside – with a nearly 6% jump. It was the biggest gain since 2009. Most likely, though, it was not a genuine bounce; it was the result of government rigging.
In the past few days, the Chinese feds have unveiled a set of market interventions bigger than Washington’s TARP bank bailout package in the depths of the global financial crisis.
Investors tend to do dumb things in China; so do regulators.
In addition to cutting interest rates and reserve requirements for banks, regulators have suspended trading in roughly half of Chinese shares… eased margin requirements… ordered state-owned companies to buy back their own shares… and ordered state-owned banks to fund those buybacks.
And the government has warned the financial press – including our office in Beijing – not to say anything “negative” about stocks.
It’s even promised investors that the Shanghai Composite will hit 4,500 points – about 20% higher than where it stands today.
Another Front in the Zombie War
Of course, we never say anything negative. So when stocks fall, it is a positive thing.
It is an opportunity. It means you can get more value for your money. It also means fewer resources are drawn into the financial sector, leaving more for the productive economy.
The trouble in China has little to do with the stock market. The trouble is in the economy. It is managed, controlled, and centrally planned.
China is just another front in the Zombie War. The authorities there are under more and more pressure to hold onto their power, their money, and their status.
The result: too much debt and malinvestment.
And China’s zombie feds are using all the tricks in the book to try to prevent an economic slump – just like in the U.S., Japan, and Europe.
This has wide-ranging repercussions. China is the world’s biggest consumer of commodities. As colleague Chris Lowe reports below in Market Insight, that’s why a slowdown in Chinese demand is hitting commodity prices hard.
Global mining stocks have lost $143 billion – nearly 20% of their value – in the last 10 days. Crude oil prices have fallen, too. Some analysts now say oil will drop as low as $20 a barrel.
As we warned Bill Bonner Letter readers in April, China could fall into a recession or even a depression.
And unlike Greece, China – the world’s second largest economy – will have a huge effect on the rest of the world.
We wait to see what will happen next…
Regards,
Bill


The chart above shows the average detached housing prices for Vancouver, Calgary, Edmonton, Toronto*, Ottawa* and Montréal* (the six Canadian cities with over a million people) as well as the average of the sum of Vancouver, Calgary and Toronto condo (apartment) prices on the left axis. On the right axis is the seasonally adjusted annualized rate (SAAR) of MLS® Residential Sales across Canada.

The Plunge-O-Meter tracks the dollar and percentage losses from the peak and projects when prices might find support.
….read more analysis on the Plunge-o-Meter HERE


-
I know Mike is a very solid investor and respect his opinions very much. So if he says pay attention to this or that - I will.
~ Dale G.
-
I've started managing my own investments so view Michael's site as a one-stop shop from which to get information and perspectives.
~ Dave E.
-
Michael offers easy reading, honest, common sense information that anyone can use in a practical manner.
~ der_al.
-
A sane voice in a scrambled investment world.
~ Ed R.
Inside Edge Pro Contributors

Greg Weldon

Josef Schachter

Tyler Bollhorn

Ryan Irvine

Paul Beattie

Martin Straith

Patrick Ceresna

Mark Leibovit

James Thorne

Victor Adair