
Stocks & Equities
Reviewing the US stock market picture from a few different angles…
NFTRH been using the Equity Put/Call ratio to gauge pressure on the US stock market for all of 2015. Many people think that anxiety indicators like this and the VIX are contrary indicators (i.e. when they spike you buy the fear in the markets, which often does work well) but when smoothing out CPCE using a moving average (weekly EMA 20 in this case) you get a trend.
The market benefited over long stretches from the calm atmosphere and the down trend in put buying vs. call buying. One explanation is that the market felt safe in mommy and daddy’s arms (Bernanke and Yellen, amidst ‘peak confidence’ in the Fed with a side of Goldilocks).
Then came transition and then came uptrend. The market has gone exactly sideways for all of 2015.

Meanwhile, gold is breaking out vs. commodities, so a counter-cyclical message is back in play. Now, this has not stopped the market yet, as the implication has been to this point, a Goldilocks scenario for the US.

Except that this time Palladium-Gold ratio, a cyclical indicator, has joined its bearish fellow above, in making a counter-cyclical turn.

As long as the stock market’s price is in an uptrend, which it is, then that is the primary ruler of things. The Dow is in an uptrend because it has not violated the October low and it is at the weekly EMA 85, which has supported every routine correction since 2011.
Bullish % (faded into background) is another of those indicators you could consider a contrary indicator, i.e. buy the correction, but there is one notable difference between this instance and the previous ones where BP declined; in this case BP (a measure of market participation) has ground lower while the Dow went sideways before recently dropping. Previously, BP has plunged in concert with corrections.

S&P 500 is more egregious, as it is still sideways and only testing the the first key moving average. This is a very thinned out market as the majority of components have been weak.

Nasdaq 100 has a bigger divergence, still. Price has continued up, as fewer big tech captains do the heavy lifting.

As noted above, price is the ultimate decider and price has not yet decided. Dialing in the view of SPX to a daily once more, we note an index getting pinched between the daily SMA’s 50 and 200. Price direction, up or down, will be coming soon.

Subscribe to NFTRH Premium for your 25-35 page weekly report, interim updates and NFTRH+ chart and trade ideas or the free eLetter for an introduction to our work. Or simply keep up to date with plenty of public content at NFTRH.com and Biiwii.com. Also, you can follow via Twitter @BiiwiiNFTRH.

 “Given a sufficient number of people and an adequate amount of time you can create insurmountable opposition to the most inconsequential idea.” ~ Anonymous
Contrarian investing is a dynamic field and not a static one. The assumption that it’s a static field is held by the new breed of fashion contrarians, whose only donation to this field has been to glamorize it and distort the correct notion of being a contrarian investor. These fashion contrarians are no different from those with the mass mindset; they only pretend to do things differently, but the moment fear or uncertainty is in the air, they flee for the exits like bandits being chased by the hounds of hell. A true contrarian in most cases understands the basic rules of mass psychology. If you are not familiar with these rules, you are doing yourself a disservice and should catch up on them ASAP.
At the Tactical Investor, while we embrace the concept of contrarian investing our true focus is on the joining the key rules of contrarian investing with the authoritative concept of mass psychology. We believe this combination creates one of the most robust trading systems out there; psychology is the key driving force behind almost every human action, so understanding should be one of the main goals of every investor.
We are going to provide a list of rules that we believe are the most important in terms of contrarian investing. It will provide both the novice and seasoned trader with ideas that should help improve your trading skills if implemented properly. Discipline and patience are the keys to successful investing; nothing comes easily, for if it did, everyone would be able to do it and then it would cease to be profitable, as the masses never win in the long run.
These contrarian guidelines by no means encompass all the rules associated with the concept of contrarian investing. However, they do provide you with a firm foundation on which to build your investment career.
1) Trendy media (magazines, news outlets, newspapers, TV stations, etc) should be treated in the same light as toilet paper; it has some use, but its function is to perform a distasteful action. Use these outlets to determine what the masses are frothing about and what you should avoid or start getting out off or into. Remember the emotions should be at boiling point. You do not oppose the masses just because they started to jump on the bandwagon; its only when the bandwagon is overloaded and about to buckle under the load its carrying that you should look for an exit and vice versa.
2) Technical analysis plays a key part when it comes to investing, regardless of whether you choose to be a contrarian investor or not. It is imperative that you take time to understand the basic tenets of this very important field. Do your best not to follow or focus only on the most popularly used Technical analysis indicators. You will be amazed at how effective some of the lesser known indicators are once you get to understand how they function and operate.
3) Spend time understanding the markets you are going to target or the sectors of the stock market you intend to play. We have put up an extensive list of resources, all of which are free here. Free Trading Resources
4) Formulate a sound plan. Don’t be an imbecile and sit there wishing and hoping to catch a home run. Those that adopt such notions, always catch a falling dagger, a process that is fraught with pain and misery. The plan should include profit targets on each and every trade, and, an exit plan, in case the trade does not work out.
5) Do not foolishly jump into Options until you grasp the key concepts of buying and selling stocks. In other words, understand when to buy and when to sell……… Make some money and then attempt your hand at options.
6) Learn to relax; if you don’t relax it’s really hard to win. Disease is a body not at ease, so if you are not at ease, you will most certainly perform dismally in the markets.
7) The law of balancing comes into play here. When you win a significant amount of money, help one person in your life time and your rewards will be 100 fold.
Other interesting points contrarian investors should adhere to
A real contrarian only jumps into the investment because the asset is trading at mouth-watering levels, and blood is flowing freely in the streets……….. Buy when the crowd is paralyzed with dread and panic and bail out when the crowd is buying hand over fist.
When you are excessively secure or feeling elated; fly for the exits.
Never get a hot head and think you know it all. Even the best can be taken out. Make sure you have stops in place; the markets are currently very volatile.
Contrarian investing is really about emotions. You are overcoming your emotions and playing/preying on the emotions (fear or greed) of the crowd by taking an opposing position.
When you take a position and people look at you with contempt or astonishment, you know you are doing the right thing…… When they pat you on the back or start giving you high five’s; the end is in sight and it’s time to flee for the exits… Buy low. Sell high.
“Everybody sets out to do something, and everybody does something, but no one does what he sets out to do.” ~ George Moore

Commodity Weakness Persists
In today’s Outside the Box, good friend Gary Shilling gives us deeper insight into the global economic trends that have led to China’s headline-making, market-shaking devaluation of the renminbi. He reminds us that today’s currency moves and lagging growth are the (perhaps inevitable) outcome of China massive expansion of output for many products that started more than a decade ago. China was at the epicenter of a commodity bubble that got underway in 2002, soon after China joined the World Trade Organization.
As manufacturing shifted from North America and Europe to China—with China now consuming more than 40% of annual global output of copper, tin, lead, zinc and other nonferrous metal while stockpiling increased quantities of iron ore, petroleum and other commodities—many thought a permanent commodity boom was here.
Think again, Australia; not so fast, Brazil. Copper prices, for instance, have been cut nearly in half as world growth, and Chinese internal demand, have weakened. Coal is another commodity that is taking a huge hit: China’s imports of coking coal used in steel production are down almost 50% from a year ago, and of course coal is being hammered here in the US, too.
And the litany continues. Grain prices, sugar prices, and—the biggee—oil prices have all cratered in a world where the spectre of deflation has persistently loomed in the lingering shadow of the Great Recession. (They just released grain estimates for the US, and apparently we’re going to be inundated with corn and soybeans. The yield figures are almost staggeringly higher than the highest previous estimates. Very bearish for grain prices.)
Also, most major commodities are priced in dollars; and now, as the US dollar soars and the Fed prepares to turn off the spigot, says Gary, “raw materials are more expensive and therefore less desirable to overseas users as well as foreign investors.” As investors flee commodities in favor of the US dollar and treasuries, there is bound to be a profound shakeout among commodity producers and their markets
(Excerpted from the August 2015 edition of A. Gary Shilling’s INSIGHT)
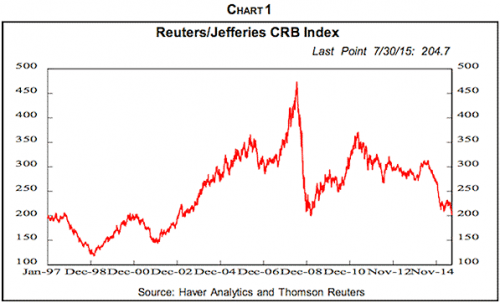
The sluggish economic growth here and abroad has spawned three significant developments – falling commodity prices, looming deflation and near-universal currency devaluations against the dollar. With slowing to negative economic growth throughout the world, it’s no surprise that commodity prices have been falling since early 2011 (Chart 1). While demand growth for most commodities is muted, supply jumps as a result of a huge expansion of output for many products a decade ago. China was the focus of the commodity bubble that started in early 2002, soon after China joined the World Trade Organization at the end of 2001.
China, the Manufacturer
As manufacturing shifted from North America and Europe to China – with China now consuming more than 40% of annual global output of copper, tin, lead, zinc and other nonferrous metal while stockpiling increased quantities of iron ore, petroleum and other commodities – many thought a permanent commodity boom was here.
So much so that many commodity producers hyped their investments a decade ago to expand capacity that, in the case of minerals, often take five to 10 years to reach fruition. In classic commodity boom-bust fashion, these capacity expansions came on stream just as demand atrophied due to slowing growth in export-dependent China, driven by slow growth in developed country importers. Still, some miners maintain production because shutdowns and restarts are expensive, and debts incurred to expand still need to be serviced. Also, some mineral producers are increasing output since they believe their low costs will squeeze competitors out. Good luck, guys!
Copper, Our Favorite
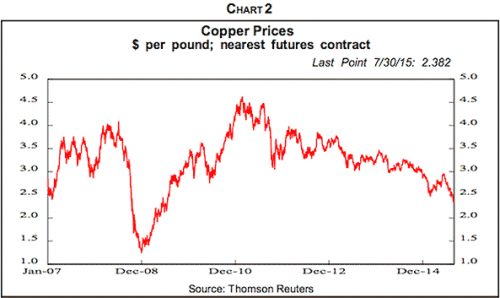
Copper is our favorite industrial commodity because it’s used in almost every manufactured product and because there are no cartels on the supply or demand side to offset basic economic forces. Also, copper is predominantly produced in developing economies that need the foreign exchange generated by copper exports to service their foreign debts. So the lower the price of copper, the more they must produce and export to get the same number of dollars to service their foreign debts. And the more they export, the more the downward pressure on copper prices, which forces them to produce and export even more in a self-reinforcing downward spiral in copper prices. Copper prices have dropped 48% since their February 2011 peak, and recently hit a six-year low as heavy inventories confront subdued demand (Chart 2).
Even in 2013, after two solid years of commodity price declines, major producers were in denial. That year, Glencore purchased Xtrata and Glencore CEO Ivan Glasenberg called it “a big play” on coal. “To really screw this up, the coal price has got to really tank,” he said at the time. Since then, it’s down 41%. But back in February 2012 when the merger was announced, coal was selling at around $100 per ton and Chinese coal demand was still robust.
Nevertheless, Chinese coal consumption fell in 2014 for the first time in 14 years and U.S. demand is down as power plants shift from coal to natural gas. Meanwhile, coal output is jumping in countries such as Australia, Colombia and Russia. China’s imports of coking coal used in steel production are down almost 50% from a year ago. Many coal miners lock in sales at fixed prices, but at current prices, over half of global coal is being mined at a loss. U.S. coal producers are also being hammered by environmentalists and natural gas producers who advocate renewable energy and natural gas vs. coal.
Losing Confidence?
Recently, major miners appear to be losing their confidence, or at least they seem to be facing reality. Anglo-American recently announced $4 billion in writedowns, largely on its Minas-Rio $8.8 billion iron ore project in Brazil, but also due to weakness in metallurgical coal prices. BHP took heavy writedowns on badly-timed investments in U.S. shale gas assets. Rio Tinto’s $38 billion acquisition of aluminum producer Alcan right at the market top in 2007 has become the poster boy for problems with big writeoffs due to weak aluminum prices and cost overruns.
Glencore intends to spin off its 24% stake in Lonmin, the world’s third largest platinum producer. Iron ore-focused Vale is considering a separate entity in its base metals division to “unlock value.” Meanwhile, BHP is setting up a separate company, South 32, to house losing businesses including coal mines and aluminum refiners. That will halve its assets and number of continents in which it operates, leaving it oriented to iron ore, copper and oil.
Goldman Sachs coal mines suffered from falling prices and labor problems in Colombia. It is selling all its coal mines at a loss and has also unloaded power plants as well as aluminum warehouses. The firm’s commodity business revenues dropped from $3.4 billion in 2009 to $1.5 billion in 2013. JP Morgan Chase last year sold its physical commodity assets, including warehouses. Morgan Stanley has sold its oil shipping and pipeline businesses and wants to unload its oil trading and storage operations.
Jefferies, the investment bank piece of Leucadia National Corp., is selling its Bache commodities and financial derivatives business that it bought from Prudential Financial in 2011 for $430 million. But the buyer, Societe Generale, is only taking Bache’s top 300 clients by revenue while leaving thousands of small accounts, and paying only a nominal sum. Bache had operating losses for its four years under Jefferies ownership.
Grains and other agricultural products recently have gone through similar but shorter cycles than basic industrial commodities. Bad weather three years ago pushed up grain prices, which spawned supply increases as farmers increased plantings. Then followed, as the night the day, good weather, excess supply and price collapses. Pork and beef production and prices have similar but longer cycles due to the longer breeding cycles of animals.
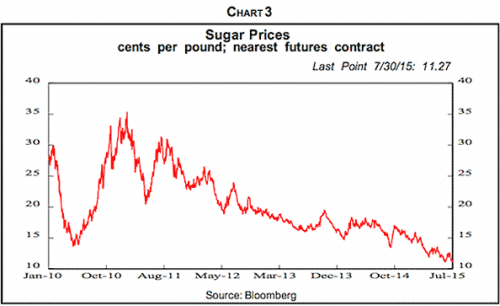
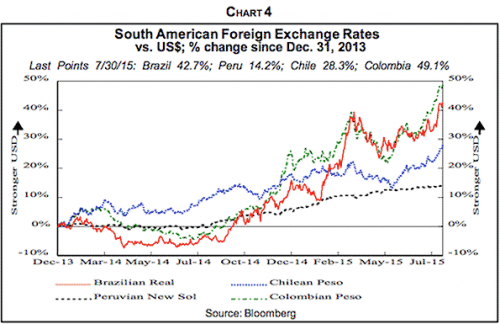
Sugar prices have also nosedived in recent years (Chart 3). Cane sugar can be grown in a wide number of tropical and subtropical locations and supply can be expanded quickly. Like other Latin American countries, Brazil – the world’s largest sugar producer – enjoyed the inflow of money generated from the Fed’s quantitative easing. But that ended last year and in combination with falling commodity prices, those countries’ currencies are plummeting (Chart 4). So Brazilian producers are pushing exports to make up for lower dollar revenues as prices fall, even though they receive more reals, the Brazilian currency that has fallen 33% vs. the buck in the last year since sugar is globally priced in dollars.
Oil Prices
Crude oil prices started to decline last summer, but most observers weren’t aware that petroleum and other commodity prices were falling until oil collapsed late in the year. With slow global economic growth and increasing conservation measures, energy demand growth has been weak. At the same time, output is climbing, especially due to U.S. hydraulic fracking and horizontal drilling. So the price of West Texas Intermediate crude was already down 31% from its peak, to $74 per barrel by late November.
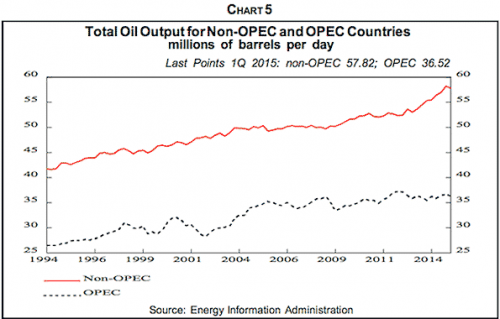
Cartels are set up to keep prices above equilibrium. That encourages cheating as cartel members exceed their quotas and outsiders hype output. So the role of the cartel leader—in this case, the Saudis—is to accommodate the cheaters by cutting its own output to keep prices from falling. But the Saudis have seen their past cutbacks result in market share losses as other OPEC and non-OPEC producers increased their output. In the last decade, OPEC oil production has been essentially flat, with all the global growth going to non-OPEC producers, especially American frackers (Chart 5). As a result, OPEC now accounts for about a third of global production, down from 50% in 1979.
So the Saudis, backed by other Persian Gulf oil producers with sizable financial resources—Kuwait, Qatar and the United Arab Emirates—embarked on a game of chicken with the cheaters. On Nov. 27 of last year, while Americans were enjoying their Thanksgiving turkeys, OPEC announced that it would not cut output, and they have actually increased it since then. Oil prices went off the cliff and have dropped sharply before the rebound that appears to be temporary. On June 5, OPEC essentially reconfirmed its decision to let its members pump all the oil they like.
The Saudis figured they can stand low prices for longer than their financially-weaker competitors who will have to cut production first. That list includes non-friends of the Saudis such as Iran and Iraq, which they believe is controlled by Iran, as well as Russia, which opposes the Saudis in Syria. Low prices will also aid their friends, including Egypt and Pakistan, who can cut expensive domestic energy subsidies.
The Saudis and their Persian Gulf allies as well as Iraq also don’t plan to cut output if the West’s agreement with Iran over its nuclear program lifts the embargo on Iranian oil. As much as another million barrels per day could then enter the market on top of the current excess supply of two million barrels a day.
The Chicken-Out Price
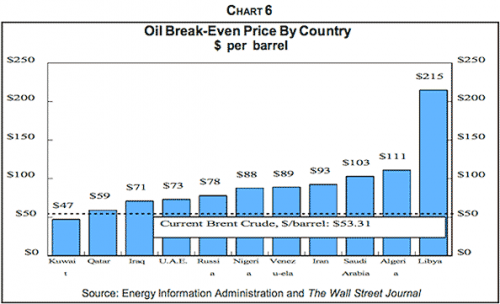
What is the price at which major producers chicken out and slash output? It isn’t the price needed to balance oil-producer budgets, which run from $47 per barrel in Kuwait to $215 per barrel in Libya (Chart 6). Furthermore, the chicken-out price isn’t the “full-cycle” or average cost of production, which for 80% of new U.S. shale oil production is around $69 per barrel.
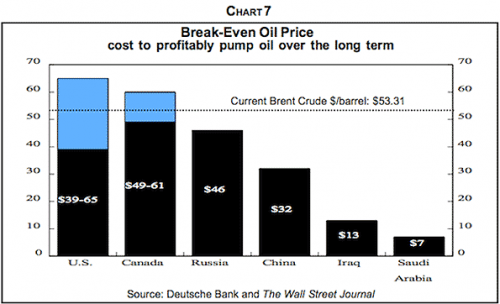
Fracker EOG Resources believes that at $40 per barrel, it can still make a 10% profit in North Dakota as well as South and West Texas. Conoco Phillips estimates full-cycle fracking costs at $40 per barrel. Long-run costs in the Middle East are about $10 per barrel or less (Chart 7).
In a price war, the chicken-out point is the marginal cost of production – the additional costs after the wells are drilled and the pipelines laid – it’s the price at which the cash flow for an additional barrel falls to zero. Wood Mackenzie’s survey of 2,222 oil fields globally found that at $40 per barrel, only 1.6% had negative cash flow. Saudi oil minister Ali al-Naimi said even $20 per barrel is “irrelevant.”
We understand the marginal cost for efficient U.S. shale oil producers is about $10 to $20 per barrel in the Permian Basin in Texas and about the same on average for oil produced in the Persian Gulf. Furthermore, financially troubled countries like Russia that desperately need the revenue from oil exports to service foreign debts and fund imports may well produce and export oil at prices below marginal costs—the same as we explained earlier for copper producers. And, as with copper, the lower the price, the more physical oil they need to produce and export to earn the same number of dollars.
Falling Costs
Elsewhere, oil output will no doubt rise in the next several years, adding to downward pressure on prices. U.S. crude oil output is estimated to rise over the next year from the current 9.6 million level. Sure, the drilling rig count fell until recently, but it’s the inefficient rigs – not the new horizontal rigs that are the backbone of fracking – that are being sidelined. Furthermore, the efficiency of drilling continues to leap. Texas Eagle Ford Shale now yields 719 barrels a day per well compared to 215 barrels daily in 2011. Also, Iraq’s recent deal with the Kurds means that 550,000 more barrels per day are entering the market. OPEC sees non-OPEC output rising by 3.4 million barrels a day by 2020.
Even if we’re wrong in predicting further big drops in oil prices, the upside potential is small. With all the leaping efficiency in fracking, the full-cycle cost of new wells continues to drop. Costs have already dropped 30% and are expected to fall another 20% in the next five years. Some new wells are being drilled but hydraulic fracturing is curtailed due to current prices. In effect, oil is being stored underground that can be recovered quickly later on if prices rise Closely regulated banks worry about sour energy loans, but private equity firms and other shadow banks are pouring money into energy development in hopes of higher prices later. Private equity outfits are likely to invest a record $21 billion in oil and gas start-ups this year.
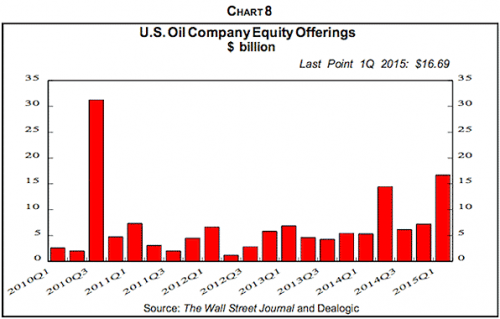
Earlier this year, many investors figured that the drop in oil prices to about $45 per barrel for West Texas Intermediate was the end of the selloff so they piled into new equity offerings (Chart 8), especially as oil prices rebounded to around $60. But with the subsequent price decline, the $15.87 billion investors paid for 47 follow-on offerings by U.S. and Canadian exploration and production companies this year were worth $1.41 billion less as of mid-July.
Dollar Effects
Commodity prices are dropping not only because of excess global supply but also because most major commodities are priced in dollars. So as the greenback leaps, raw materials are more expensive and therefore less desirable to overseas users as well as foreign investors. Investors worldwide rushed into commodities a decade ago as prices rose and many thought the Fed’s outpouring of QE and other money insured soaring inflation and leaping commodity prices as the classic hedge against it. Many pension funds and other institutional investors came to view them as an investment class with prices destined to rise forever. In contrast, we continually said that commodities aren’t an investment class but a speculation, even though we continue to use them in the aggressive portfolios we manage.
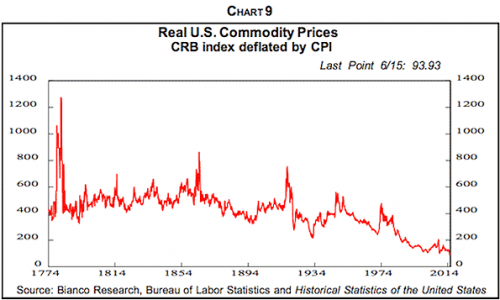
We’ve written repeatedly that anyone who thinks that owning commodities is a great investment in the long run should study Chart 9, which traces the CRB broad commodity index in real terms since 1774. Notice that since the mid-1800s, it’s been steadily declining with temporary spikes caused by the Civil War, World Wars I and II and the 1970s oil crises that were soon retraced. The decline in the late 1800s is noteworthy in the face of huge commodity-consuming development then: In the U.S., the Industrial Revolution and railroad-building were in full flower while forced industrialization was paramount in Japan.
At present, however, investors are fleeing commodities in favor of the dollar, Treasury bonds and other more profitable investments. Gold is among the shunned investments, and hedge funds are on balance negative on the yellow metal for the first time, according to records going back to 2006. Meanwhile, individual investors have yanked $3 billion out of precious metals funds.
Commodity Price Outlook
Commodity prices are under pressure from a number of forces that seem likely to persist for some time.
- Sluggish global demand due to continuing slow economic growth.
- Huge supplies of minerals and other commodities due to robust investment a decade ago.
- Chicken games being played by major producers in the hope that pushing prices down with increasing supply will force weaker producers to scale back. This is true of the Saudis in oil and hard rock miners in iron ore.
- Developing country commodity exporters’ needs for foreign exchange to service foreign debt. So the lower the prices, the more physical commodities they export to achieve the same dollars in revenue. This further depresses prices, leading to increased exports, etc. Copper is a prime example.
- Increased production to offset the effects on revenues from lower prices, which further depresses prices, etc. This is the case with Brazilian sugar producers.
- The robust dollar, which pushes up prices in foreign currency terms for the many commodities priced in dollar terms. That reduces demand, further depressing prices.
It’s obviously next to impossible to quantify the effects of all these negative effects on commodity prices. The aggregate CRB index is already down 57% from its July 2008 pinnacle and 45% since the more recent decline commenced in April 2011. To reach the February 1998 low of the last two decades, it would need to drop 43% from the late July level, but there’s nothing sacred about that 1998 number. In any event, ongoing declines in global commodity prices will probably renew the deflation evidence and fears that were prevalent throughout the world early this year. And they might prove sufficient to deter the Fed from its plans to raise interest rates before the end of the year.
SUBSCRIBE TO GARY SHILLING’S INSIGHT AND YOU’LL RECEIVE:
12 MONTHLY REPORTS (25-35 PAGES) VIA E-MAIL FOR $335
($375 VIA REGULAR MAIL)
PLUS
A FREE COPY OF OUR JANUARY 2015 INSIGHT FEATURING
ALL OF OUR INVESTMENT THEMES FOR 2015
PLUS
A FREE SPECIAL REPORT DETAILING GARY SHILLING’S OUTLOOK
FOR THE U.S. ECONOMY
TO SUBSCRIBE, CALL US AT 1-888-346-7444 OR 973-467-0070.
OR E-MAIL US AT INSIGHT @ AGARYSHILLING.COM.
BE SURE TO MENTION OUTSIDE THE BOX TO GET YOUR FREE COPY OF OUR JANUARY 2015 INSIGHT AS WELL AS THE FREE SPECIAL REPORT.
(THIS OFFER IS AVAILABLE ONLY TO NEW SUBSCRIBERS)
The article Outside the Box: Commodity Weakness Persists was originally published at mauldineconomics.com.
Related podcast interview:
Dr. Gary Shilling: The Era of Slow Growth Is Not Over – 30 Year Treasury Bond Could Hit 2% CLICK HERE to subscribe to the free weekly Best of Financial Sense Newsletter .
 Habit #4 – Knowing the Market
The more you engage with customers the clearer things become and the easier it is to determine what you should be doing.
John Russell
Successful business owners are exceptional problem solvers, especially when it comes to solving their customers’ problems. Over the years, I have seen many early stage and emerging companies fail as they “push” their offer into the market, while more seasoned company’s offers get “pulled” into the market. The difference is in the mindset of the leader, executive, entrepreneur or business owner who is responsible for the business. This attitude is not only limited to the world of tech startups, but many inexperienced business people can fall into the trap of believing they know what the customer wants better than the customer themselves! They are thinking of a solution, before solving the problem.
While the customer may not know the precise form of the solution and may not even be able to articulate the problem, they do
know it hurts and that they are willing to pay for a solution. For instance, prior to purchasing the fledging Seattle coffee shops that eventually became Starbucks, Howard Shultz famously toured hundreds of coffee shops in Italy and found that the secret to great coffee shops was not the great coffee, but great meeting places. His solution was to create a great place that sold coffee, and the rest, as they say, is history!
Here are the four things you can do to develop the habit of other successful business owners in knowing your market:
Serve a Segment: Avoid boiling the ocean and identify one segment of the market you not only plan to serve, but dominate! It can be segmented by demographics, industry vertical, income levels, consumer behavior or buying patterns. Whatever it is, be very specific about what segment you are serving, and understand that segment intimately.
Feel the Pain: Focus on what pain or problem the customer is experiencing. If it’s B2C, it’s likely about service convenience or cost. If it’s B2B, the pain is usually too much risk, not enough time or too much money. Find it, understand it, define it and solve it!
Above Average Growth: Successful business owners focus on markets that are growing, preferably above the average for the industry or the economy. This drives higher margins and greater opportunities to dominate, particularly during the early stages of new markets.
Sell Globally: Often said, but not always done. While it is a great strategy to start small and regional in order to prove out the concept, the business strategy must be focused on global markets, no matter what business you are in. In the information age, even a small regional player can build a global following. Think global and act global!
Developing the habit of becoming clear, concise and deeply knowledgeable of the market you are selling into will help you become a better business leader and accelerate the growth of your business.
Selling innovative, well-priced and good value offers into this market, particularly those growing fast and with a global presence, will increase the probability that you can ultimately dominate the sector, and create an unassailable competitive advantage.
Thinking like your customer and focusing on how you can solve meaningful problems for them is the fastest way to build a great company!
By Eamonn Percy
For all 10 Habits and other articles go HERE

 Neil Howe predicted in 1997 that America entered a major turning period, a fourth turning as he called it, starting around 2005 with the Great Financial Crisis of 2008. Given that each period tends to last around 20 years, Howe believes America will face a number of significant upheavals into the late 2020s.
“We’re kind of eight years into it, so we have a long ways to go. This is not just a single event. This is an era. It will be filled with blows and hits and ultimately what we come out of the fourth turning with is…..

-
I know Mike is a very solid investor and respect his opinions very much. So if he says pay attention to this or that - I will.
~ Dale G.
-
I've started managing my own investments so view Michael's site as a one-stop shop from which to get information and perspectives.
~ Dave E.
-
Michael offers easy reading, honest, common sense information that anyone can use in a practical manner.
~ der_al.
-
A sane voice in a scrambled investment world.
~ Ed R.
Inside Edge Pro Contributors

Greg Weldon

Josef Schachter

Tyler Bollhorn

Ryan Irvine

Paul Beattie

Martin Straith

Patrick Ceresna

Mark Leibovit

James Thorne

Victor Adair