
Gold & Precious Metals
Originally published August 9th, 2015.
In this update we are only going to look at one chart, because I don’t want to dilute its impact by including anything else. There are many other charts supportive of a positive outlook for the Precious Metals sector going forward, which we will look at separately.
The chart we are now going to look at is the long-term ratio chart for the large cap S&P500 index divided by the XAU index for large cap gold and silver stocks. So that we can achieve a big picture overall perspective, our chart goes right back to the mid 80’s.

This astounding chart largely speaks for itself. The main point it makes clear of course is the extraordinary and extreme undervaluation of Precious Metals stocks relative to the broad stockmarket. This ratio is an amazing 9 times higher than it was at its 2011 lows! Another point revealed by this chart is that PM stocks are now much better value relative to the broad market than they were even at the PM sector low late in 2000, before the great PM sector bullmarket of the 2000’s began.
Finally, the MACD indicator at the top of this chart has risen to a wild unprecedented extreme reading, which means one of two things is going to happen – either the broad market is going to drop hard soon, which we are in fact expecting, or the Precious Metals sector is going to rally, or both at the same time. Either way you are much better off in Precious Metals stocks than in the broad marke

1. Top 6 Myths Driving Oil Prices Down
“Earlier in the year I documented half a dozen media reports which turned out to be 100 percent false. Now I expose another half dozen in just the past few weeks. “….continue reading HERE
2. People’s Bank of China Freaks Out….
“The PBOC’s freak-out came after all heck had already broken loose in China over the weekend” …..continue reading HERE
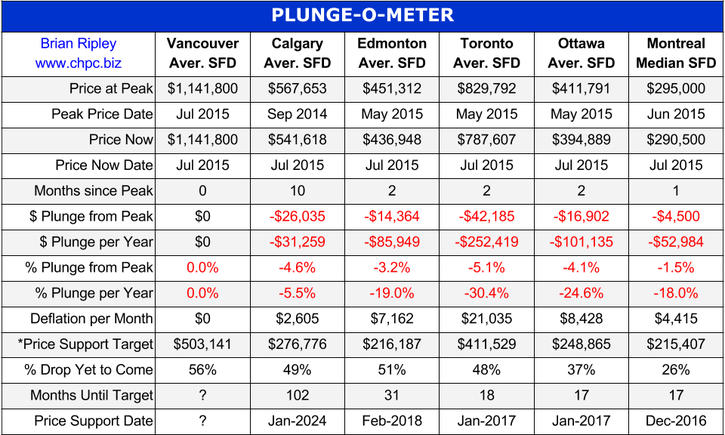
3. Canada 6-City Housing & the Plunge-O-Meter
The chart below tracks the dollar and percentage losses from the peak and projects when prices might find support. The other chart shows the average detached housing prices for the six largest Canadian cities HERE


“America is going to win the currency war,” Schiff said Tuesday on CNBC’s “Futures Now.” “I think we’re going to win, but right now you have a dollar bubble.”
The dollar bubble claims fly in the face of how the U.S. common currency has performed this year. The dollar index is up more than 7 percent year to date.
But according to the Euro Pacific Capital CEO, the Federal Reserve will hold off on raising rates as long as possible, and over time, that will cause the dollar to collapse…

 ALSO JUST RELEASED: Richard Russell – The Big Picture, Chaos In China And The Monster That’s Scaring All Investors CLICK HERE.
From Egon Greyerz
“this coming September – October all hell will break loose in the world economy and markets. A lot of factors point to that, both fundamental and technical indicators and this indicates that we could have a number of shocks this autumn”.….read more from Egon von Greyerz

-
I know Mike is a very solid investor and respect his opinions very much. So if he says pay attention to this or that - I will.
~ Dale G.
-
I've started managing my own investments so view Michael's site as a one-stop shop from which to get information and perspectives.
~ Dave E.
-
Michael offers easy reading, honest, common sense information that anyone can use in a practical manner.
~ der_al.
-
A sane voice in a scrambled investment world.
~ Ed R.
Inside Edge Pro Contributors

Greg Weldon

Josef Schachter

Tyler Bollhorn

Ryan Irvine

Paul Beattie

Martin Straith

Patrick Ceresna

Mark Leibovit

James Thorne

Victor Adair