
Asset protection
 The global financial system is now getting out of control. While the clowns on the financial networks continue to regurgitate the same bullish propaganda, “that everything will be fine”, quite the opposite is the case. The system is so broken and the leverage propping it up is so extreme, the result will be the largest financial and economic calamity the world has ever seen.
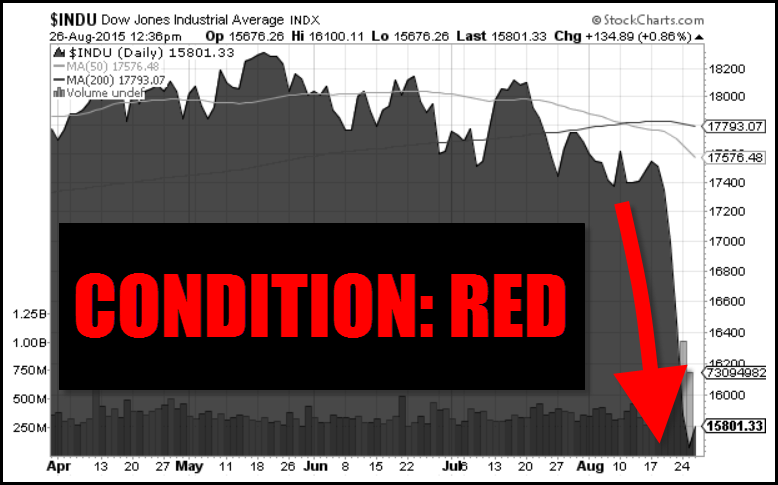
To get an idea just how broken the system has become, here is the Dow Jones chart of Monday’s trading activity from Zerohedge’s article Behold: Insanity:

After the Asian markets received a financial enema Sunday night as the Hang Seng fell more than 1,200 points and the Nikkei nearly 950 points (at their lows), the Dow Jones experienced one of the strangest trading days ever. Of course, the Dow Jones suffered large single-day losses before, but never the sort of volatility as it experienced this Monday, August 24th.
I would imagine this type of volatility can be explained by the HFT – High Frequency Traders that have now taken over the majority of trading in the markets. This type of stock market insanity wouldn’t have taken place 10 years ago as the system still had a great deal of retail traders. Thus, human retail trading activity would move slower and take more time in mulling over information.
The Dow Jones moved over 4,500 points (up & down) on Monday. This should be a warning to investors that serious dislocations in the market are coming.
Beginning Stages Of A Run On The Retail Precious Metal Market??
Ever since the middle of June when Greece threatened to leave the European Union, sales of gold and silver bullion exploded. Investors purchased a record 176,000 oz of Gold Eagles in July. This was the highest monthly sales figures in several years.
Even though the rate of Gold Eagle sales declined in August compared to July, they picked up significantly over the past few days surpassing 30,000+ oz to a total of 68,500 oz for the month.
While sales of Gold Eagles have been the strongest in several years, Silver Eagle sales continue to beat all records. Not only are sales of Silver Eagles 12% higher at 31.5 million oz (Moz) compared to 28.2 Moz during the same period last year, total sales for June, July and August are a staggering 14.5 Moz. If the U.S. Mint continued to sell Silver Eagles at the same rate over the past three months, total sales would reach an annual 58 Moz.
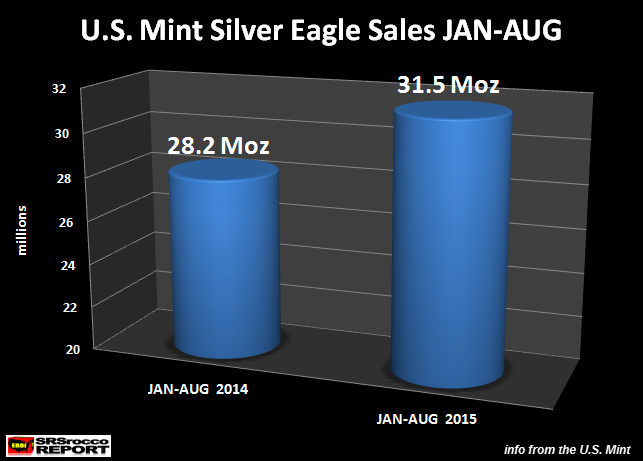
We also must remember, there is still another U.S. Mint update on August 31st. Most of the time, the U.S. Mint updates its sales figures on Monday, but this week they waited until Tuesday. If they update their sales figures on Monday, we could see total sales for August at 4.8-5 Moz.
I contacted a few dealers to see what was going on in the retail end of the market. Here was their reply:
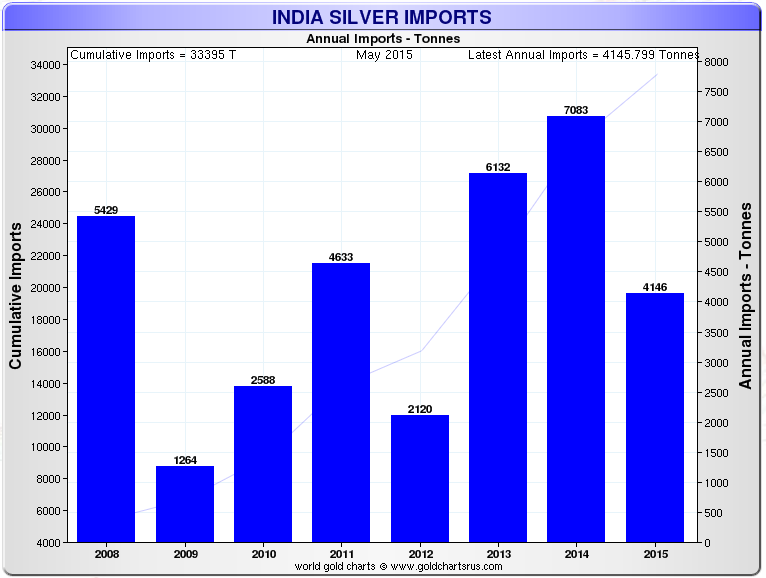
Indian Silver Imports in 2015 May Easily Surpass 9,000 Metric Tons
According to the data put out by Sharelynx.com, total Indian silver imports from Jan to May reached a staggering 4,146 metric tons (134 Moz):
According to ETF Securities May 2015 Precious Metals Monthly Report:
Demand from India continues to impress. From 2005 through 2013 India silver imports averaged just under 100 million (mn) ounces per year. In 2014, on the back of substantial restrictions put on gold use and the sharp drop in the silver price, India silver imports jumped to 230 mn ounces. With the election of Mr. Modi and some easing of the gold restrictions, silver use in India was generally expected to decline in 2015. But this has not been the case, as of the end of May. The latest data through April show India silver imports running about 30% above the 2014 record pace, on track for about 300 mn ounces of imports in 2015. India imports alone are on pace to consume about 1/3 of total global silver supply available in 2015. The rapid pace of India imports is likely to subside but indications of strong demand for silver are clear.
Two important points from the ETF Securities analysis on Indian silver demand:
1) Annual silver imports averaged less than 100 Moz from 2005-2013. This increased significantly in 2014 (230 Moz) and 2015 (300-320 Moz). Basically, Indian silver imports in 2015 are on track to be three times their 2005-2013 rate.
2) Most analysts forecasted a decline of Indian silver use due to new election of Mr. Modi and his easing of gold restrictions in 2015. However, the opposite is the case and Indian silver imports Jan-May are 62% higher than the same period last year.
Investors need to realize this huge increase of Indian silver imports is just another sign that ALL IS NOT WELL in the system. If things get out of control with the broader stock markets in September-October, Indian silver demand could actually push their total imports to 10,000 metric tons (320 Moz).
Don’t Be Fooled By The Dow Jones Dead Cat Bounce
Today the Dow Jones closed up 619 points. I would imagine the nitwits on CNBC are smacking each other on the back stating, “A Victory is Near.” How can the Dow Jones be up 619 points, while oil is down in the $38 range and most commodities are in the red?? Shouldn’t stocks be indicative of the health of the overall economy? LOL… not anymore.
This is nothing more than the typical Dead Cat Bounce. Why? Markets never go down in a straight line and I imagine the Dow Jones needed to take a breather after suffering a total 1,842 point loss since the declines started last Wednesday. If there are any folks out there who are still playing a game of “CHICKEN” by trying to time the markets, you may be in for a rude awakening.
The Degree Of Stupidity In The Financial Media Is Off The Charts
Recently, John Mauldin (a regular guest on King World News) put out one of the most ludicrous articles on energy that I have seen in quite some time. Now, of course I’ve read some lousy ones by the MSM, but Mauldin is an analyst with a foot in the alternative media camp… which makes it even worse.
His article, Riding The Energy Wave To The Future was so awful, it invoked a reply from energy perma-bear James Howard Kunstler: As Fracking Implodes, The Clowns Deny Reality. Even though I enjoyed Kunstler’s reply by posting it on my site, I wanted to include a rebuttal from one of the best energy analysts that I follow.
I sent Mauldin’s article to Art Berman who has his own energy blog called ArtBerman.com. I suggest those interesting in knowing what’s really going on in the energy industry, to check out his blog. Art replied to Mauldin’s nonsense with the following:
John Mauldin Defends Faith, Fails Economics 101
Mauldin says he is an economist and yet there is no economic data in his monologue. It is fascinating that production efficiency has become the new justification for the continued inefficient use of energy. For him, growing production volume equals commercial success.
He worships at the alter of technology but fails to grasp its cost and its limits. He blindly accepts the self-promoting proclamations of oil company executives without testing whether their claims are supported by economic facts.
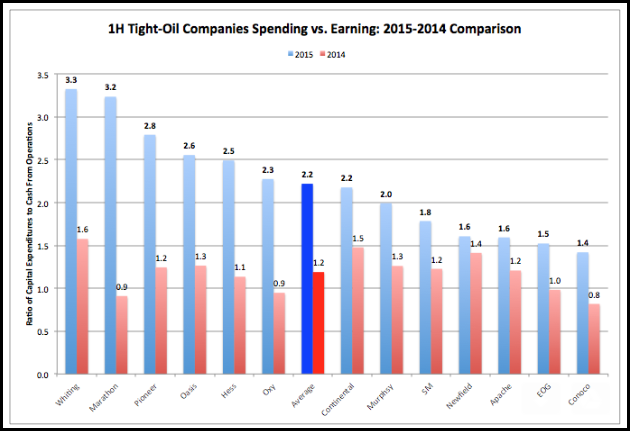
For example, he cites EOG’s claim that they are more profitable at low oil prices than they were a few years ago at high oil prices. All that is necessary is to compare EOG’s cash flow now vs. a year ago to see that is a false statement.
Source: Company 10-Qs and Google Finance.
Although EOG is one of the best of a bad lot when it comes to tight oil producers (and I own EOG stock), they were cash-flow neutral in 1H 2014 when oil prices averaged $101/barrel and they were cash-flow negative in 1H 2015 when oil prices averaged $53/barrel, spending $1.50 for every $1 they earn from operations.
EOG’s statement that he takes as true is easy to test and it proves to be false. But he is too much of a true believer or too lazy to run the simple test using Google Finance and taking less than 5 minutes.
Most of the claims of continued profits at lower oil prices are based on incorrect reserve assumption and the exclusion of significant costs of doing business like G&A and interest expense.
I recently completed an evaluation of key company average well reserves in the Bone Spring play in the Permian basin. My reserve estimates based on solid history matches suggest an average well EUR of 205 kboe using the top 6 operators in the play. Simmons & Company International published a report on break-even prices last week that uses 676 kboe per well. A more than 3-fold exaggeration in reserves will get you more favorable economics every day of the week, and they acknowledge no G&A, interest expense, geologic and geophysical costs, etc.
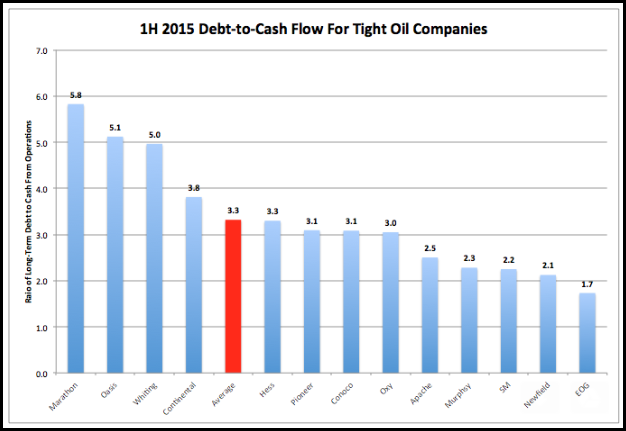
The 1H 2015 tight oil debt-to-cash from operations ratio is chilling.
Source: Company 10-Qs and Google Finance.
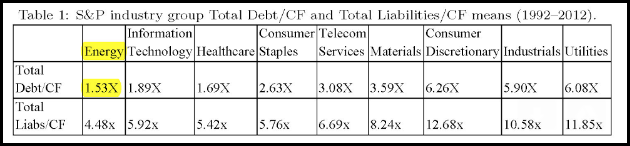
If the companies are truly making a profit at low oil prices why are they all above any reasonable debt covenant threshold (the 20-year E&P average is 1.53).
Source: Bank of Finland Research Discussion Papers 11-2014.
Please see the second half of my blog from Wednesday on 1H financial results: http://www.artberman.com/world-oil-supply-decreased-demand-increased-in-july-eia/
These are a few of my thoughts and observations about Mauldin’s piece.
Art does a great job cutting through all the BS, by stating some simple facts. I am surprised that Mauldin believes the garbage he wrote in that article. This is an ongoing phenomenon in the financial media.
This U.S. Shale Oil Industry is in serious trouble. Watch for serious declines in U.S. oil production over the next 6-12 months. As I stated several times, I believe U.S. oil production will fall 33% by 2020 and 60-70% by 2025. The KING DOLLAR gets its strength from controlling global energy markets. When U.S. oil production declines to less than 5 million barrels a day, and oil exporters will no longer take worthless Dollars for oil…. Americans will be in a world of hurt.
This is precisely the reason to own physical gold and silver. The U.S. and Global Markets are now entering CONDITION RED. Best to have your precious metal insurance while you can still get them.
Please check back for new articles and updates at the SRSrocco Report. You can also follow us at Twitter

 The US stock markets just suffered an extraordinary plunge, shocking traders out of their complacency psychosis. This cast the foundational premise behind recent years’ incredible stock-market levitation into serious doubt. Traders are finally starting to question whether central banks can indeed manipulate stock markets higher indefinitely. Any wavering in this faith has very bearish implications for stock prices.
Less than two weeks ago, the US’s flagship S&P 500 stock index (SPX) was up above 2100. It finished August’s middle trading day just 1.3% below the latest record highs from late May. At the time, the Wall Street analysts were overwhelmingly bullish and saw nothing but clear sailing ahead. Predictions for the SPX ending this year above 2250 were ubiquitous, and retail investors were urged to aggressively buy stocks.
But warning signs abounded on fundamental, technical, and sentimental fronts as I’ve discussed in our newsletters extensively. The US stock markets were radically overvalued relative to historical norms in trailing-twelve-month price-to-earnings-ratio terms. As the SPX left July, its 500 elite components had a simple-average trailing P/E of 25.6x! That was nearing 28x bubble territory, far above the 14x historical average.
Stock-market technicals were incredibly overextended too. By the SPX’s peak in late May, this massive broad-market index had powered higher for 3.6 years without any correction-magnitude selloffs. In normal bull markets, these 10%+ selloffs happen about once a year on average. They are healthy and necessary to rebalance sentiment. The longer since the last major selloff, the greater the odds for the next one.
And without normal corrections to bleed away excessive greed periodically, it was really getting extreme. The VIX S&P 500 implied-volatility index has long been the definitive fear gauge. And it had spent the month between mid-July and mid-August averaging just 12.9 on close. That showed American stock traders feared nothing, they were exceptionally complacent and full of hubris. Mounting selloff risks were ignored.
Yet these very conditions were perfect for spawning a selloff, as all students of the markets know. The only reason it took so long to arrive was traders’ fanatical faith in central banks to keep acting to boost stock prices. Traders believe central-bank easing has the power to eradicate normal stock-market cycles. While market history shatters this myth of central-bank omnipotency, it is universally assumed today.
The US Federal Reserve birthed and then carefully nurtured this notion. Back in December 2008 the Fed implemented its zero-interest-rate policy in response to that year’s once-in-a-century stock panic. It was promised to be a temporary measure. After that the Fed started conjuring new dollars out of thin air to buy trillions of dollars of bonds, outright debt monetizationpleasantly euphemized as quantitative easing.
While the first and second QE campaigns had preset sizes and end dates determined at launch, the Fed radically shifted its modus operandi for the third campaign. Spun up to full speed in early 2013, QE3 was open-ended. The Fed deftly used this ambiguity to entice and badger capital into stocks. Whenever the stock markets threatened to fall, Fed officials rushed to hint that they could ramp QE3 to arrest the selling.
The result was the extraordinary stock-market levitation since early 2013. With the Federal Reserve’s implicit promises to backstop stocks, traders flooded in with reckless abandon. Every minor selloff was quickly met with aggressive buy-the-dip purchases, usually on some strategically-timed comment by a top Fed official. Near every major SPX low, Fed officials goosed stocks by arguing QE3 could be expanded.
So traders ignored the entire highly-cyclical history of the stock markets to keep on bidding them higher in recent years. Without any material selloffs thanks to Fed jawboning, complacency and greed quickly ballooned to dangerous extremes. Leading the way were countless hundreds of billions of dollars in corporate stock buybacks, largely financed through cheap borrowing courtesy of the Fed’s zero-bound rates.
But something had to give, as the stock markets are forever cyclical. Not even the central banks’ printing presses can eradicate the greed and fear in traders’ hearts, and those emotions are what ultimately drive market cycles. Traders wax too greedy and bid stock prices way above fundamentally-righteous levels, leading to subsequent major selloffs. Then traders fearfully run for the exits, leaving stocks too cheap.
Earlier this summer, the failure of China’s popular speculative mania should have irreparably damaged the omnipotent-central-bank myth. China’s central bank had engineered an extreme stock-market rally through exquisitely-timed rate cuts. China’s flagship Shanghai Composite stock index had soared an astounding 110.8% higher in less than 7 months by early June! Most traders thought that rally was unassailable.
There is no government in the whole world with more power over its local economy than China’s. So its government-nurtured stock-market bubble was the ultimate test of the all-powerful-central-bank thesis. And despite extreme and unprecedented efforts to manipulate stocks higher, the Shanghai Composite still plummeted by 32.1% in less than a month as greed turned to fear when that stock bubble popped.
Since history has proven countless times that central banks can only temporarily delay stock-market cycles, never eliminate them, we bet against that Chinese stock bubble before it popped. We bought and recommended puts trades on the leading Chinese-stock ETF, and our subscribers soon realized profits averaging +137% in just several months. Central banks can’t manipulate stock prices for long.
Yet amazingly, the Fed-deluded American traders ignored the sobering example of China’s gross failure of central-planned stock markets. They still clung to their zealous faith in the American central bank’s magical ability to levitate stock markets indefinitely. This was foolish, as I’ve argued many times in the past couple years. Artificially delaying selloffs makes markets feel less risky, but greatly amplifies risks in reality.
My favorite analogy of the risks of central-bank stock-market manipulation is wildfires. However noble governments’ intentions, when they send firefighters to quickly extinguish small wildfires that just lets underbrush flourish unchecked. Sooner or later there is so much dry fuel laying around that some small wildfire quickly mushrooms into a hellfire conflagration. Suppressing small fires guarantees far bigger ones later!
The same is true of suppressing normal and healthy stock-market selloffs. Those firefighting efforts by the central banks enable dangerous levels of sentimental and technical underbrush to choke off the stock markets. Then it’s only a matter of time until the right spark arrives, and the whole fuel-rich mess flashes into intense and uncontrollable flames. These dwarf central-bank printing presses’ ability to help.
The Fed’s extreme selloff-suppression efforts fueled one of the most extraordinary stock-market runs in history in recent years. While no one could know in advance when the catalyst would arrive to ignite all that epic complacency, it emerged out of the blue with no warning just a week ago. And even the initial resulting devastation is incredible, as this Fed-levitation-era chart of the VIX and leading SPY S&P 500 ETF shows.
While the Fed formally launched QE3 in September 2012 just in time to sway the national elections in Democrats’ favor, it didn’t ramp to full steam to include direct monetizations of US Treasuries until a few months later in December. That’s when the surreal QE3-stock-market era started. Between late December 2012 and May 2015, that dominant SPY SPDR S&P 500 ETF tracking that index soared 52.5%!
But that extreme straight-up stock-market advance was always unnatural. It improbably began late in a maturing cyclical bull when stock prices were already high and overvalued. And it continued powering higher with nothing approaching a correction. Every time the stock markets started to dip, Fed officials would quickly step up to the microphones to assure traders they were ready to ease more if necessary.
Most of those proto-selloffs were artificially stunted before they even hit the 4% pullback threshold. The only one that even threatened a correction-magnitude 10%+ came in October 2014. That heavy selling started accelerated on poor European economic data, and SPY ultimately dropped 7.7% in 20 trading days. But that selloff ended on Fed jawboning and a parallel surprise European Central Bank easing.
But even in that only significant selling episode of the Fed’s entire stock-market levitation, it never got bad enough to generate enough fear to eradicate excessive greed. The highest VIX close in that whole episode was just 25.5. While that’s certainly elevated, it was nowhere near high enough to indicate serious fear. So the extreme complacency and hubris of 2013 and 2014 spilled into this year as well.
But the Fed-goosed stock markets were running out of steam as tinder-dry sentiment underbrush grew wild. By early March the SPX was up near 2120, levels that would still barely be exceeded by late May. Not even uber-dove Janet Yellen’s most-easy Federal Reserve ever seen could manage to stoke new buying. The writing was on the wall, and any shift in Fed policy was a major risk as I warned in mid-June.
It hadn’t just been the 2.4 years of the Fed’s SPX levitation by its latest record highs in late May where the US stock markets hadn’t experienced a normal correction, but a whopping 3.6 years! The last one came in summer 2011 just after the Fed ended its earlier QE2 debt-monetization campaign. And not surprisingly in stock markets at price levels that are almost entirely a Fed-conjured fiction, the Fed dispelled it.
On Wednesday August 19th, the minutes from the Fed’s latest Federal Open Market Committee meeting held at the end of July were due out. They were super-important because they offered the last glimpse into Fed officials’ thought processes and internal debates before the FOMC’s next meeting. It is coming on September 17th, and has long been assumed to be the highest-probability target for rate hikes to start.
This is a huge deal since the Fed hasn’t raised interest rates a single time in 9.2 years, since June 2006. And the Fed has never, ever attempted to tighten after a prolonged ZIRP episode. So the coming rate hikes are wildly unprecedented. The release of those FOMC minutes was botched when Bloomberg accidentally broke an embargo nearly a half-hour early. And stock traders didn’t like what they saw.
There was nothing in those latest FOMC minutes to dispel the growing fears that the Fed was ready to start its next rate-hike cycle at its next mid-September meeting. Since the entire stock-market levitation since early 2013 was fueled by epic Fed easing and the resulting extreme corporate stock buybacks, this cast serious doubts on this extraordinary stock rally’s longevity. So stock traders started to drift to the exits.
The SPX retreated 0.8% that FOMC-minutes day last Wednesday, which was no big deal. But the Fed worries really intensified on Thursday. Traders couldn’t figure out if they were more worried about the Fed hiking rates in September, or not hiking rates in September. The latter scenario would mean the US central bankers still perceive the US economy as too weak to withstand even a trivial quarter-point rate hike.
So the stock selling escalated, pummeling the SPX down 2.1% to close at its lows. This shattered its 200dma, which had been major support for the Fed’s entire SPX levitation as the SPY chart above shows. It also dragged the SPX to a new post-topping low of 2036. That formally forced the US stock markets into pullback territory with a 4.5% drop since late May. But the selling pressure sure wasn’t over yet.
Complacency had become so extreme that there was choking underbrush for that wildfire to feed on. Last Friday, some weak Chinese factory data amplified long-festering fears of a global slowdown. So American stock traders’ selling started getting frantic, pummeling the SPX 3.2% lower. That was its biggest down day in 3.8 years, since November 2011. The SPX’s total pullback had ballooned to 7.5%.
This not only rivaled that previous-largest-of-Fed-levitation October 2014 pullback, but the VIX closing at 28.0 was the highest levels of fear seen since December 2011. In other words, American stock traders had not been so scared for the Fed’s entire SPX levitation since early 2013! The Fed’s endless selloff-suppression efforts had finally failed, the wildfire of cascading selling was starting to rage out of control.
Coddled stock traders aren’t used to serious selloffs, and had a whole weekend to stew over the SPX being back at levels first seen in July 2014. An entire year’s progress had been erased in just two trading days! So they came back this past Monday morning ready to sell and get the heck out of Dodge. An exacerbating factor emerged in China, the further failure of the omnipotent-central-bank thesis.
Since China’s stock markets had collapsed back down near their initial post-bubble lows of early July, local traders expected the People’s Bank of China to again ride to the rescue over the weekend with a rate cut. But the PBoC failed to act, so the Shanghai Composite plummeted an astounding 8.5% on Monday! It was down a staggering 37.9% in just 10 weeks. This heavy selling soon spilled into Europe.
Germany’s flagship DAX stock index plummeted 4.7% that day, and France’s CAC 40 was even worse with a 5.4% loss. So SPX futures just collapsed as the globe spun back to the US, falling over 100 points. The financial media was calling it “Black Monday” that morning, although this selloff was nothing like October 1987’s real Black Monday that saw the SPX crash 20.5% in a single trading day.
Still the SPX plunged another 3.9% on Monday, taking its total post-topping selloff to 11.2% which was well into 10% correction territory. After a 3.6-year Fed-induced delay, the long-overdue correction has finally arrived. The heavy selling continued on Tuesday, where early-day short-covering gains rolled over into a 1.4% closing loss on heavy mutual-fund redemptions and margin calls. The selloff was brutal.
While the SPX was down 12.4% since late May, it had plummeted 10.2% in just 4 trading days straddling last weekend! This wasn’t crash-magnitude, which requires 20% in a couple trading days, but was challenging stock-panic levels which is 20% over a couple of weeks. The Fed’s surreal stock-market levitation of recent years was finally failing. Real fear was back, with the VIX soaring to a 40.1 close on Monday.
Although no one could predict such a catastrophic failure of the Fed’s SPX levitation, the odds certainly favored a serious selloff. We were prepared with SPY puts, bets that the SPX was due for a material drop. We liquidated some tranches of these Tuesday for average realized gains for our subscribers of +150%! It pays big to be contrarians when everyone is convinced some manipulated market trend will run forever.
While such an extreme selloff guaranteed a powerful oversold bounce on short covering, the critical question is what happens after that? It was the illusion of central-bank omnipotency, that the Fed can boost stock markets indefinitely, that pushed the SPX so high in the past couple years. With rate hikes inexorably nearing, and the stock markets cracking, odds are that blind faith in the Fed is crumbling.
And that has super-bearish implications. The stock markets are forever cyclical, bears inevitably follow bulls. This next chart zooms out to show the entire stock-market bull in SPY terms since early 2009. If a new bear is indeed looming on the first Fed tightening in over 9 years, the downside from here remains enormous. Today’s central-bank-coddled investors aren’t ready to face the unyielding fury of a real bear.

This amazing cyclical stock bull was righteous and on a normal trajectory until late 2012, when the Fed launched its wildly-unprecedented open-ended QE3 campaign. That sparked the decoupling that resulted in the Fed’s incredible stock-market levitation. Virtually everything since 2013 is just a Fed-conjured illusion, and there’s going to be hell to pay as these artificial stock-market extremes inevitably reverse.
Since it’s been a record span since the last correction, today’s isn’t likely to prove mild at just over 10%. There are vast amounts of complacency underbrush to burn, incredible bastions of greed for fear to bleed away. So even if this exceptionally long-in-the-tooth and outsized stock bull is still miraculously alive as stock traders desperately hope, a full-blown correction approaching 20% is almost certainly required.
That would drag the SPX back down to levels first seen in mid-2013, wiping out the past couple years’ extraordinary gains. But odds are the selling won’t stop there. Today’s stock markets are not only wildly overvalued and overextended, but today’s spoiled-rotten-by-the-Fed traders would likely freak out with years of gains vaporized. Once a selloff crosses the 20% threshold, it formally becomes a new bear market.
Bear markets tend to be symmetrical with preceding bulls, the larger the bull the larger the subsequent bear. And after one of the biggest bull markets in history thanks to the Fed’s gross manipulations, the reckoning isn’t going to be small. Even at a 50% bear over the next couple years, which is merely average in terms of cyclical-bear size, the damage that would be done to the stock markets is breathtaking.
A full 50% cyclical bear would drag the SPX all the way back down to levels first seen in late 2009! That would destroy all vestiges of bullish stock-market psychology, and drag stock prices back to undervalued levels relative to trailing earnings. And that’s exactly what stock bears exist to accomplish. Bulls leave the stock markets overvalued and greed extreme, then bears follow to maul away the resulting excesses.
And contrary to the Fed-inspired myth today that stock bears are rare, they certainly aren’t. While we’ve yet to see a stock bear this decade, the 2000s saw no fewer than two! After seeing similar overvalued and overextended stock-market conditions to this summer’s, the SPX suffered a 49.1% bear market over 2.6 years ending in October 2002 and a second 56.8% cyclical bear over 1.4 years ending in March 2009.
This past week’s extreme stock selloff was exceptional. Apparently there’ve only been 8 times since 1980 where the S&P 500 has suffered consecutive 3%+ down days! It’s hard to imagine such an extreme selloff not severely damaging traders’ faith in central-bank omnipotency. This coupled with the Fed’s coming rate-hike cycle is almost certain to spawn a new bear market given the topping conditions leading into it.
But the extreme selloff this past week is nothing like bear markets, which are slow and methodical. A typical bear lasts a couple years, which encompasses about 500 trading days. To get to a 50% total decline over that time requires an average daily loss of just 0.1%, nothing. By unfolding slowly, bears work to trap bulls into staying fully invested for as long as possible without realizing the grave danger they’re in.
And if the overdue next cyclical bear is indeed upon us, it’s rarely been more important to cultivate a studied contrarian perspective on these markets. That’s our specialty at Zeal. We’ve spent decades studying market cycles, and understand how to thrive in bears with investments moving counter to stock markets. Since 2001 including those last two bear markets, all 700 stock trades recommended in our newsletters have averaged annualized realized gains of +21.3%!
We share our ongoing trading strategies and specific stock recommendations in our acclaimed weekly and monthly newsletters for contrarian speculators and investors. They draw on our exceptional market experience, knowledge, and wisdom to explain what’s going on in the markets, why, and how to trade them with specific stocks. With big changes afoot, you ought to subscribe today! Time is running out on our 33%-off sale.
The bottom line is the Fed’s extraordinary stock-market levitation of the past couple years is failing. The stock markets plummeted this past week after the Fed offered no clues that it was delaying its upcoming rate-hike cycle any longer. That selling quickly cascaded, greatly damaging traders’ faith in that myth that central banks can artificially manipulate stock markets higher indefinitely. This has very bearish implications.
If the Fed can no longer suppress stock-market cycles, the next cyclical bear market is overdue to charge in with a vengeance. And it’s likely to be an exceptionally large one following such an outsized cyclical bull. Bear markets see average declines near 50% over a couple years or so, which serve to maul stock prices back in line with underlying earnings fundamentals. That’s going to crush Fed-coddled stock traders.
Adam Hamilton, CPA
August 28, 2015
So how can you profit from this information? We publish an acclaimed monthly newsletter, Zeal Intelligence, that details exactly what we are doing in terms of actual stock and options trading based on all the lessons we have learned in our market research.

Recommendation: EUR/USD: short (a stop-loss order at 1.1445; the downside target around 1.0938)
Although the University of Michigan showed that its index of consumer sentiment slipped to 91.9 this month from 92.9 in July, positive data from the U.S. Bureau of Economic Analysis (which showed that the goods trade deficit narrowed to $59.12 billion in the previous month) in combination with rising U.S. personal spending and U.S. personal income supported the greenback. Thanks to these circumstances, the USD Index climbed above the level of 96. What impact did this increase have on our six currency pairs?
In our opinion the following forex trading positions are justified – summary:
- EUR/USD: short (a stop-loss order at 1.1445; the downside target around 1.0938)
- GBP/USD: none
- USD/JPY: none
- USD/CAD: none
- USD/CHF: none
- AUD/USD: none
EUR/USD

….for larger charts and all of the currency pairs and analysis go HERE

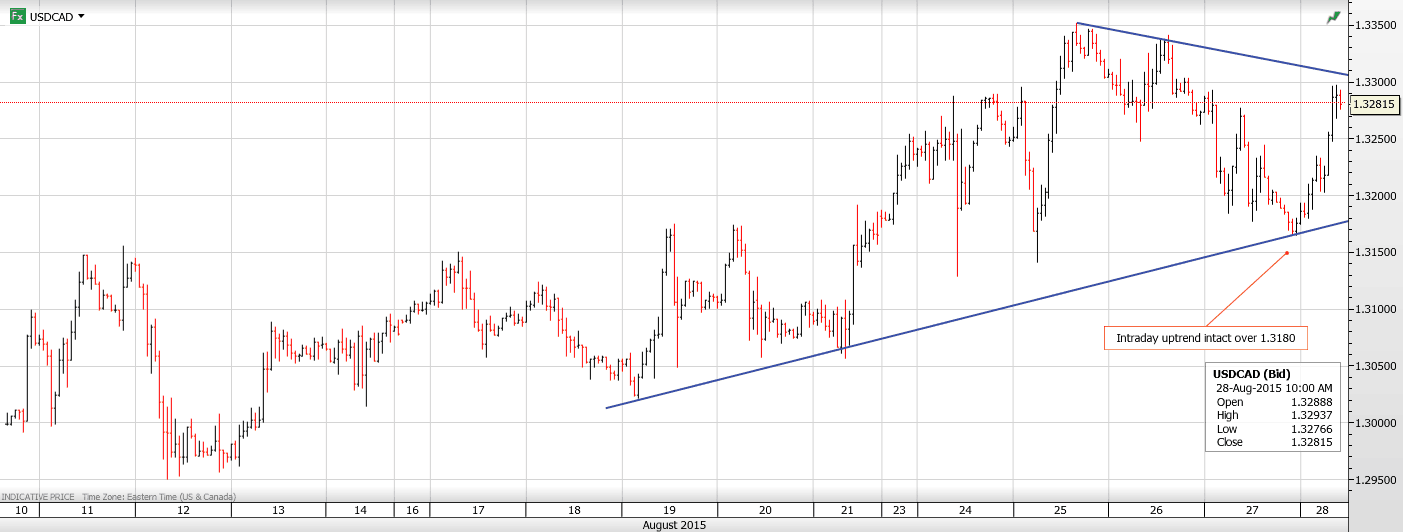
USDCAD Range 1.3170-1.3298
USDCAD is flirting with levels not seen since June 2004 and we can thank former drama teacher, Justin Trudeau for that. Even though the Liberal government hasn’t been in power since 2006, and their chances this year are slim, news headlines trumpeting Trudeau’s plan for 3 years of $10 billion deficits doesn’t inspire confidence in a currency already beaten up by low oil prices.
Overnight, G-7 currency volatility diminished as Asian equity indices moved higher and closed the week on a firm footing. That wasn’t the case in Europe. European equities are down and a slew of economic releases failed to inspire FX trading.
The Chinese market sell-off that created a mini-market meltdown across the globe is fading from memory as the focus shifts to the Jackson Hole Symposium. This meeting is garnering a lot of attention because pundits believe that the Fed Vice Chair, Stanley Fischer will use the forum to provide additional clarity surrounding a September rate hike. Don’t bet on it. Next Friday’s nonfarm payrolls report will be key to determining lift-off.
Technical Outlook
The intraday technicals are bullish. The move back above 1.3240 snapped a downtrend and renewed the upward bias with an initial target of 1.3350 and then 1.3450. The short term uptrend from June remains intact above 1.3140. For today, USD support is at 1.3240 and 1.3190. Resistance is at 1.3310 and 1.3350.
Today’s Range 1.3160-1.3240
Chart: USDCAD 1 hour Larger Chart
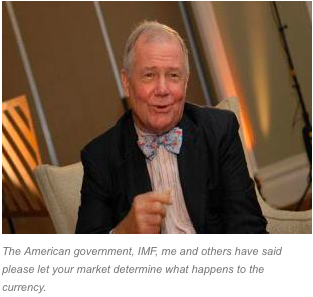 Jim Rogers of Rogers Holdings for his take on the Yuan devaluation and the global markets.
Jim Rogers: First of all, this is not devaluation. I am not sure why people outside China are saying that for many years. The American government, IMF, me and others have said please let your market determine what happens to the currency. So finally the Chinese said okay and the Yuan went down 2% one day and 1% another day. But that is not devaluation.
The Japanese Yen is down 50%……
…read more excerpts HERE

-
I know Mike is a very solid investor and respect his opinions very much. So if he says pay attention to this or that - I will.
~ Dale G.
-
I've started managing my own investments so view Michael's site as a one-stop shop from which to get information and perspectives.
~ Dave E.
-
Michael offers easy reading, honest, common sense information that anyone can use in a practical manner.
~ der_al.
-
A sane voice in a scrambled investment world.
~ Ed R.
Inside Edge Pro Contributors

Greg Weldon

Josef Schachter

Tyler Bollhorn

Ryan Irvine

Paul Beattie

Martin Straith

Patrick Ceresna

Mark Leibovit

James Thorne

Victor Adair