
Gold & Precious Metals
Long time readers of The Gold Update know that our microphones are just about everywhere, the latest instance being at Mission Control in Houston this past Thursday in concert with the Federal Open Market Committee’s policy decision as regards the Federal Reserve Bank’s Funds Rate:
“Uh, hullo Cape Canaveral, this is Cap Com Houston. Congrats on ‘Lift-Off’. We’ve got your vehicle tracking nicely.”
“Cap Com, this is Cape Canaveral. Must be some mistake: we’ve got the rocket still attached to gantry here on launch pad Fed…”
“Uh, Canaveral, this is Houston, no mistake: see to launch pad Gold. Flawless ‘Lift-Off’ recorded Thursday at 14:00 Eastern Daylight Time…


1. You Must Plan for the Next Financial Crisis BEFORE it Happens, Not While it is Happening
by JS Kim
“Most people seem to believe that they have to lose a great deal of money when crises materialize and forget that it is absolutely possible to prosper during crises as well.”
2. A crucial cycle is presently occurring!
by Chris Vermeulen – The Gold & Oil Report
“the investment community seems much closer to panic and hysteria than it does to euphoria and optimism. It would not take much more to depress the markets further; however, it would take a lot to make it feel confident and secure about the Fed’s ability to stay ahead of “the curve” and manage the transition smoothly.
“Bearish trends of this week are extremely potent”
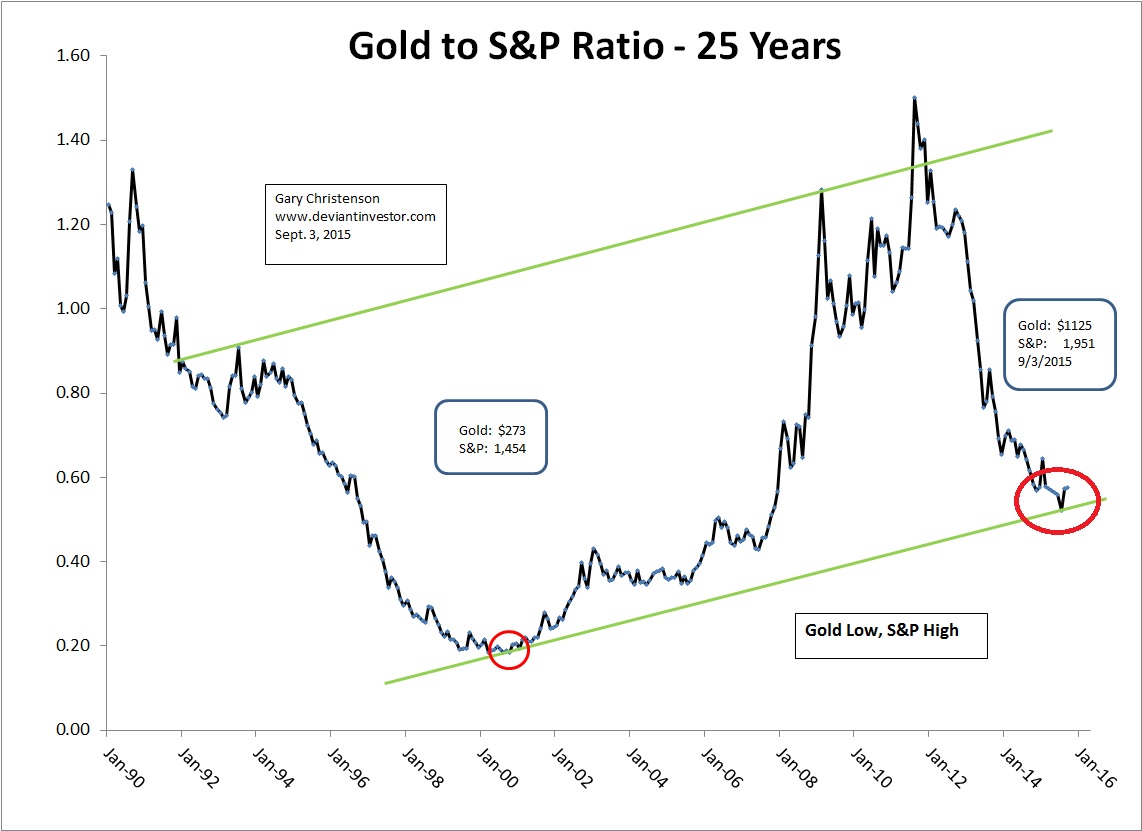
3. Buy Gold, Sell the S&P
by Gary Christenson – The Deviant Investor
Buy low, sell high! The better choices are buying gold and selling the S&P 500 Index and relevant stocks.
Why?
Examine the graph of the ratio of Gold to S&P 500 Index for the past 25 years. The ratio is low now and likely will correct higher. I think gold will move higher and the S&P will move lower.
….view more analysis and charts HERE

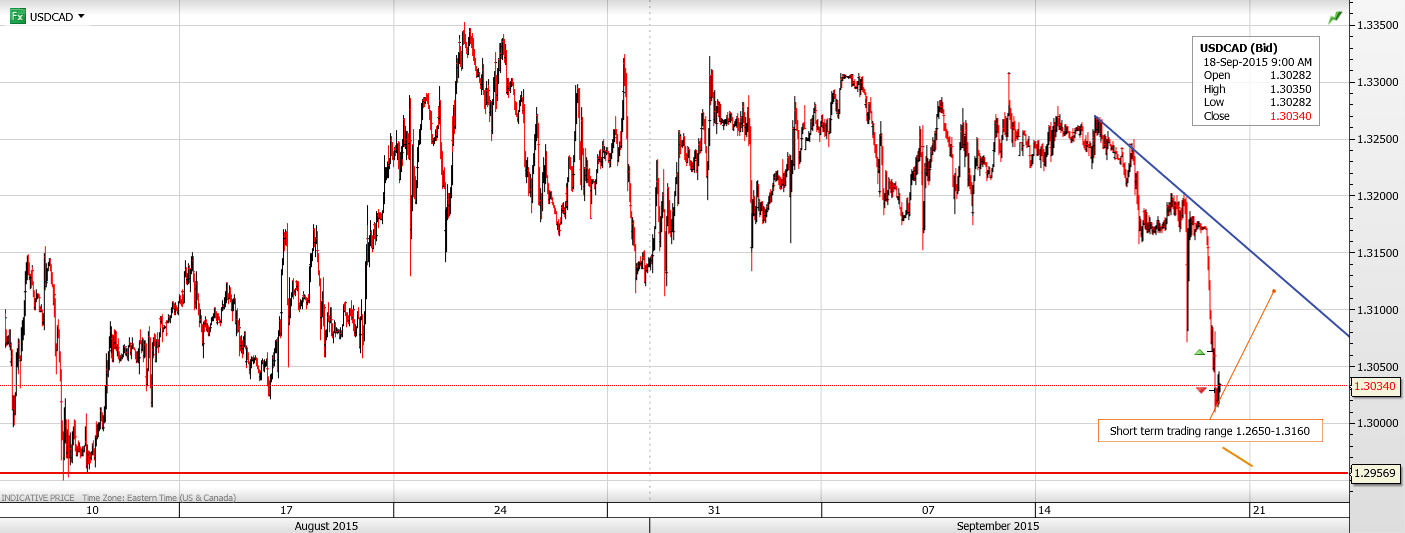
USDCAD Range 1.3015-1.3182
USDCAD sank following the FOMC decision but recouped all of its losses almost immediately in what in hindsight proved to be a bizarre move. USDCAD dropped from 1.3180 just prior to the news, touched 1.3077, immediately afterwards and then rebounded back to 1.3180 in a heartbeat. Asia traders took note of the doveish FOMC statement and sold dollars across the board, including USDCAD, a theme that continued throughout the European session. USDCAD sank even lower than the post FOMC low and currently sits at 1.3050.
USDCAD opened in New York with a negative bias and barely budged on the release of the as-expected Canadian CPI data.
The surprisingly doveish FOMC statement appears to have shifted the driver of US interest rates from American inflation and Labour reports to Chinese data and their economic outlook. Even though the door remains wide open for a rate increase in December, China developments could derail the process in a hurry.
The balance of the day should see a continued bias to sell US dollars although intraday profit taking could slow any losses. The Greece elections and weekend Fed speakers will set the tone to start next week’s action.
Technical Outlook
The intraday technicals are bearish USDCAD while trading below 1.3160 with a break below 1.3010 leading to 1.2960. There is additional support in the 1.2910-40 zone. A recovery above 1.3160 targets 1.3230 and suggests that the 1.2960-1.3350 trading band will remain intact. For today, USDCAD support is at 1.3010, 1.2980 and 1.2950. Resistance is at 1.3080, 1.3130 and 1.3180.
Today’s Range 1.3010-1.3080
Chart: USDCAD 30 minute LARGER CHART

 Listener to MoneyTalks have heard many analysts and conservative money managers talk about using options to protect their portfolio from volatility and increase income.
We’ve arranged, in partnership with Desjardins Online Brokerage, to have Patrick Ceresna, Chief Strategist of Learn to Trade Global, to put on a FREE live webinar on how to use options following the show – 10:05am Pacific on Sept 26th.
Patrick will show examples of how you can use options to protect your capital, generate additional income and obtain quality stocks at discount prices.
The webinar system can support only the first 500 people who register.
If you have any difficulty with the registration system contact daniel.suen@vmd.desjardins.com directly.

The following is part of Pivotal Events that was published for our subscribers September 10, 2015.
Commodities
Agricultural prices (GKX) recorded an oversold at new lows at 280 in June. The short-covering rally drove it to 327 in only two weeks. It was the most overbought in a year.
It slumped to a new low at 273 and another oversold on Monday. A seasonal low is possible in early October and again in early November.
The most important thing is that GYK has been making new lows since the cyclical peak in 2011.
The GYX has been suffering metal fatigue since the cyclical peak of 502 set in April 2011. It became Weekly very oversold at 257 on August 24th. The rebound in base metals has made it to 280 today. This is at the 50-Day ma.
It could get briefly above. Copper can set a seasonal high in mid-September and the key seasonal low could be found in late November.
The next slide could again set new lows.
As we noted, crude oil can set a seasonal up in July and a seasonal down in late August. The rebound can be finished in mid-September, with the key low likely in late December. The chart has been tracking well.
On the bigger picture, our work in early 2014 concluded that after firming into around that June crude’s price could begin a critical decline. The reasoning was that the post-bubble bear market in other commodities had yet to get crude. Within this was the probability that oil prices would get in line with the new price regime established for natural gas.
It had nothing to do with the Saudis trying to knock out US shale production. That was likely public relations stuff. After all, bureaucrats will say anything to maintain the appearance of being in control.
In gold terms, we expected crude to fall to around one-quarter of the high. The index of crude/gold rose to 84 in June 2014 and plunged to 34 in January. The rebound was to 52 in June and it was turned back by the 50-Day.
The next hit was to 33 on August 24th. As bad as it was, it was not down to the one-third of the high level.
The bounce in WTIC jumped from 37.75 to the declining 50-Day at 48 on Tuesday. In the nominal price, crude has further to decline and the full decline could take a year or so.
WTIC’s high in June 2014 was 107. In round numbers, the one-third decline would be at the 35 level. The low on Black Monday was 37.75.
The full one-quarter decline would be to the 27 level.
Thermal coal price declined to 41 in June and has been holding 43 since July.
Met coal rallied from 83 in May to 90 at the end of June. It is now at 87.
Iron ore set a low at 51 in April and a high at 62 in June. The low in July was 51 and now it is at 58. Not getting hit going into Black Monday is noteworthy.
Of compelling interest, Carbon Emissions broke above the daunting 8.02 resistance level and made it to 8.09.
This page has always had a high regard for small mercies.
Precious Metals
When this sector’s bear started we did not look around to see how long it would last. In 2011, the RSI on the silver/gold ratio soared to 92. Anything above 78 indicates that speculation had become dangerous. The only other time it hit 92 was in the fateful January of 1980.
All of this was reviewed many times and the conclusion was that the bear would not be as bad as that followed 1980.
They are all dismal and far too long.
The one after 1980 lasted for two years and seven months.
Post-1988, it lasted for two years plus eight months.
After the 1996 high the bear lasted for three years plus seven months. There was a nice low at 275 in August 1998 – at the 2 years plus 8 months count, but the LTCM disaster took the low out to 253 in 1999.
The count from the peak in 2011 is now an unrelenting 4 years.
Did we have to review all this pain?
Yes and we are looking for the bottom.
Gold stocks will need to be rising relative to the bullion price. The last one failed in May and the decline drove the Weekly RSI down to 19 on August 6. It was lower in 2013 but the bear was not ready to end then.
However, it is almost as bad as the oversold in October 2008. With the most dynamic part of that crash.
The time duration has been exceptional. The dynamics are now exceptional.
Over the past two weeks, gold stocks relative to the bullion price have been stabilizing. Considering the above two points this is constructive.
Gold stocks relative to the S&P are also very depressed.
Of course, this is widely known, but it is worth looking at clinically.
We will let the stability continue for a while and then update with some other ways of identifying the opportunity.
Link to September 12, 2015 Bob Hoye and Ross Clark interview on TalkDigitalNetwork.com:http://talkdigitalnetwork.com/2015/09/this-week-in-money-16/
Listen to the Bob Hoye Podcast every Friday afternoon at TalkDigitalNetwork.com


-
I know Mike is a very solid investor and respect his opinions very much. So if he says pay attention to this or that - I will.
~ Dale G.
-
I've started managing my own investments so view Michael's site as a one-stop shop from which to get information and perspectives.
~ Dave E.
-
Michael offers easy reading, honest, common sense information that anyone can use in a practical manner.
~ der_al.
-
A sane voice in a scrambled investment world.
~ Ed R.
Inside Edge Pro Contributors

Greg Weldon

Josef Schachter

Tyler Bollhorn

Ryan Irvine

Paul Beattie

Martin Straith

Patrick Ceresna

Mark Leibovit

James Thorne

Victor Adair