
Gold & Precious Metals

Dow, Junk Bonds, & US Dollar Video Analysis
Gold, Silver, & Copper Video Analysis
Key Swing Trades Video Analysis
GDX, GDXJ, & Key Gold Stocks Video Analysis
Today’s videos and charts above (double click to enlarge)
Thanks,
Morris
| Friday, Oct 16, 2015 Super Force Signals special offer for Money Talks Readers: Send an email to trading@superforcesignals.com and I’ll send you 3 of my next Super Force Surge Signals free of charge, as I send them to paid subscribers. Thank you! |
The SuperForce Proprietary SURGE index SIGNALS:
25 Surge Index Buy or 25 Surge Index Sell: Solid Power.
50 Surge Index Buy or 50 Surge Index Sell: Stronger Power.
75 Surge Index Buy or 75 Surge Index Sell: Maximum Power.
100 Surge Index Buy or 100 Surge Index Sell: “Over The Top” Power.
Stay alert for our surge signals, sent by email to subscribers, for both the daily charts on Super Force Signals at www.superforcesignals.com and for the 60 minute charts at www.superforce60.com
About Super Force Signals:
Our Surge Index Signals are created thru our proprietary blend of the highest quality technical analysis and many years of successful business building. We are two business owners with excellent synergy. We understand risk and reward. Our subscribers are generally successfully business owners, people like yourself with speculative funds, looking for serious management of your risk and reward in the market.
Frank Johnson: Executive Editor, Macro Risk Manager.
Morris Hubbartt: Chief Market Analyst, Trading Risk Specialist.
website: www.superforcesignals.com
email: trading@superforcesignals.com
email: trading@superforce60.com
SFS Web Services
1170 Bay Street, Suite #143
Toronto, Ontario, M5S 2B4
Canada

Massive artificial stock, bond wealth will be looking for a place to go
By the time Goldman Sachs published its widely referenced warning of a third wave in the global financial crisis (mid October), the physical precious metals’ markets were already feeling the strain of very strong demand against a rapidly dwindling supply. China, the country seemingly at the epicenter of the developing emerging market crisis, by itself had taken 911 tonnes of gold off the market in the first half of 2015 – a number when annualized that represents nearly two-thirds of the world’s mine production. India, another of the so-called BRICS nations (Brazil, Russia, India, China and South Africa) was a strong second at 400-500 tonnes. In the occident, gold demand was strong, but silver demand was even stronger. Global mints were reporting off-the-charts demand for silver bullion coins. Coin premiums were on the risein extremis at one point reaching almost $6 per ounce on the propular silver American Eagle.
Now with warnings of the next leg of the financial crisis surfacing almost daily, that demand could accelerate
to an even higher lever. The massive, artificial wealth built-up in the world’s stock and bond markets will be looking for a place to go and one likely beneficiary will be the underpriced gold and silver markets. If premiums in the silver market are telling us anything, it is that the migration to precious metals has already begun, and that it is being led by Main Street.
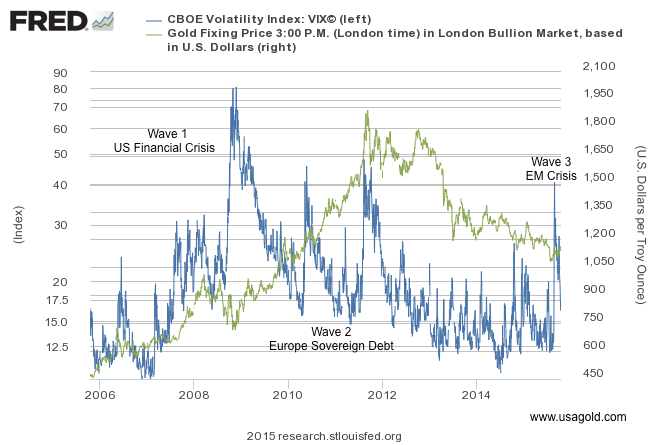
Goldman says that “increased uncertainty about the fallout from weaker emerging market economies, lower commodity prices and potentially higher U.S. interest rates are raising fresh concerns about the sustainability of asset price rises, marking a new wave in the Global Financial Crisis.” The Guardian, a British newspaper, draws similar conclusions. The IMF’s recently released Global Stability Report, it says, “makes for a sobering read, saying sustainable recovery has failed to materialise and cheap money has led to bubbles and debt. The next financial crisis is coming, it’s a just a matter of time – and we haven’t finished fixing the flaws in the global system that were so brutally exposed by the last one.”
Editor’s Note: With reference to the chart above, this overlay, modeled on Goldman’s third wave thesis, shows the relationship between the Volatility Index (blue line) and the price of gold (green line). “The CBOE Volatility Index,” according to Investopedia, “shows the market’s expectation of 30-day volatility. It is constructed using the implied volatilities of a wide range of S&P 500 index options. This volatility is meant to be forward looking and is calculated from both calls and puts. The VIX is a widely used measure of market risk and is often referred to as the ‘investor fear gauge.'” As you can see, gold lags the Volatility Index which, as Investopedia points out, is forward looking. If Goldman’s analysis is correct, and we are early in the process, the recent breakout in the gold price could be a harbinger of things to come. Please note the recent surge in volatility index – the investor fear gauge. Gold’s inflation hedge characteristics are well-known, but what is not widely understood or publicized is gold’s practicality as a disinflation and deflation hedge – a characteristic prominently illustrated in the chart which covers a distinctly disinflationary period.
“Volatility provides exposure to our collective insecurity towards an unknowable future. Likewise, to short volatility is to express personal confidence in the status quo of market affairs despite a broader fear of change. To go long volatility is to express fear that change is coming.” Artemis Capital Management
Instead of going long volatility, perhaps a simpler, more direct approach is called for:
“A recent IMF paper showed that gold was viewed by central banks as an asset that could be used to reduce risk. These results are consistent with a survey ANZ (Australia and New Zealand Banking Group) conducted with central banks and sovereign wealth fund managers in early 2014 which found that almost half of the respondents believed that gold was a safe haven asset over the long-term. Additionally, over 60% of respondents believed that gold would constitute a larger proportion of central bank reserves over the next two years, with just over 20% expecting a decline. Further, around half of the respondents thought holding more gold could mitigate portfolio risks, most of which were central bankers from ‘low-middle income’ countries.” – ANZ Research, “East to Eldorado: Asia and the Future of Gold”
Something happening in Shanghai
Quietly gold has started to register gains in the overnight Shanghai market. For a very long time, the overnight market (from a U.S. perspective) more or less followed along with the prevailing trend in London and New York. Over the past few weeks, the Shanghai market has taken on a life of its own with solid gains over the London and New York closes registered on a regular basis. In fact, as the chart below illustrates, a case could be made that much of the recent rise in the price of gold has occurred in the Hong Kong-Shanghai markets. These overnight price adjustments could foreshadow the gold market’s future. By this I do not mean to say that the direction is going to be exclusively to the upside. The real point is that China’s presence is going to be felt – up or down – and that presence is going to play significantly in the flow of real metal. The Shanghai Gold Exchange, as readers of this newsletter are already aware, is slated to launch its new fix by the end of 2015. In addition, the new London price setting regime already includes one Chinese bank with two others scheduled to join in the near future. As a result, China’s influence in the gold market, already a key factor, should increase markedly.
With its appetite for the physical metal now a well-established fact of life, China will likely serve as a foil to the current paper-based pricing regime. Chinese banks in London will be on the constant lookout for arbitrage opportunities that can be purchased and shipped to their home country. Meanwhile, the price posted in Shanghai will be for physical delivery only – no paper settlements or rollovers. In this new gold market, China, perhaps inadvertently, will act as a proxy for gold coin and bullion owners all over the world.
For deeper background and details on the London-Shanghai gold trade and what it might mean for the average gold owner, please see the following:
Will the Shanghai Fix ‘fix’ the gold market? China takes a seat at the gold pricing table
The Shanghai stock crash and China gold demand – What it means for the future of the gold market

Is helicopter money in our future?
“I certainly was not eager to bail out Wall Street,” Ben Bernanke reminisces, “and I had no reason to want to bailout Wall Street itself. But we did it because we knew that if the financial system collapsed, the economy would immediately follow.” With that Bernanke revealed the thinking behind the money printing extravaganza that followed thereafter – nearly $4 trillion added to the Fed’s balance sheet, billions in bailouts for Wall Street, and precious little for Main Street. Bernanke, in short, is saying that “the devil made me do it.” Now seven years later, we find ourselves no better off as a nation economically and staring a situation in the face that looks very much like the previous crisis, only this time with Wall Street likely to lead the slide into potential chaos, rather than the housing market.
More and more, investors and analysts alike are beginning to believe that another round of quantitative easing is in our collective futures and that, more than likely, is part of the psychology driving gold out of the doldrums. Some think that since quantitative easing had little impact the first time around, policy makers will try fiscal stimulus instead – infrastructure projects or even an outright universal helicopter money drop like manna from the heavens. That could become reality, but don’t rule out another helicopter drop on Wall Street for good measure. If you liked Ben Bernanke’s reaction to the economic crisis, you are going to love Janet Yellen’s. She wasn’t appointed by Barrack Obama because she had a problem letting the dogs loose if the situation warranted it.
We will end this short overview with a quote from billionaire hedge fund manager Paul Singer: “Although the levitation of financial assets has yet to levitate gold, we will grit our collective teeth on that score and await either ‘asset price justice’ or the ‘end times,’ whichever comes first.” Along with levitating gold, asset price justice is likely to lift silver as well.

American Eagle gold and silver bullion coins (Photo by USAGOLD’s Jen Dentry)
We invite you to visit USAGOLD’s Piles of Gold image gallery.
FYI – If you appreciate the kind of gold-based analysis you are now reading, you would probably find value in subscribing to News & Views and receiving regular issues and special reports promptly by e-mail. It comes free of charge and you can opt out of the service at anytime. Last, we will not deluge you with e-mails. Over 20,000 subscribe to this newsletter – one of the best and most widely read in the field. Never miss another issue. . . Please register here.

The stock market crashes were – alongside the devaluation of yuan – the most important recent developments in China. The stock market started rising during the summer of 2014, when the property market started to burst. The timing is no coincidence, as the government wanted to replace one bubble by another. By inflating (or at least cheerleading) the stock market bubble (by cutting interest rates and providing liquidity into the markets via the Pledged Supplementary Lending and Medium-Term Lending Facility, the Chinese version of quantitative easing both worth over the 2 trillion yuan), the Communist Party of China wanted to sell equity stakes of dangerously debt-burdened state enterprises and help clean up messy balance sheets, as well as to create a wealthy middle class, as a condition to move from exports/investment-led growth to domestic-consumption-led growth. Additionally, the start of the property market burst limited a viable investment opportunity for domestic investors, prompting them to reallocate their capital into the stock market. Consequently, China’s stock market surged more than 150 percent over the year, hitting a seven-year peak in the middle of June. Since then, mainly due to deleveraging, the Chinese stock prices have dropped nearly 40 percent (despite all government’s measures to prevent declines), culminating in a one-day drop of 8.5 percent on August 24 (the devaluation of the yuan has also added uncertainty to the stock market and triggered outflows from the stock market due to selling a yuan).
The Chinese stock market’s drop caused a decline in commodity and equity prices around the world, erasing $3 trillion in value from global stocks. The question is now whether China’s stock market’s burst spreads further into other markets and significantly affects the global economy and the gold market. Well, there are many arguments for saying that the burst of the stock market is less serious threat that the ongoing burst of the property market. Why? First, the PBOC and the regulators constantly pour liquidity into the markets. Second, the government launched a massive socialist-style rescue campaign and introduced many stock market regulations, limiting the potential decline. Third, the number of stock investors comprises less than 8 percent of the total Chinese population (while the home ownership rate is 90 percent). Fourth, the 0.03 percent of stock investors own 67 percent of the A-share market capitalization (A-share market combines shares traded in mainland China, which are available generally only to domestic investors). This means that the fate of the market depends not on the retail, non-educated investors, but on the bigger and smarter players. Fifth, the stock market is not the main channel to raise money in China. Equity funding is less than 5 percent of the total corporate financing pool (much lower than bonds and loans’ share) and it finances only about 2 percent of Chinese fixed asset investment. Sixth, stocks as a percentage of Chinese household financial assets amount to less than 15-20 percent (while real estate amounts to more than two-thirds of household wealth), so the declines should not significantly affect the real economy and consumption via the wealth effect (especially since the previous rally in the stock market did not trigger a boost in consumption indicating that gains remained largely unrealized).
However, it does not mean that the Chinese stock market’s performance is meaningless. Of course, the bust partially reflects the previous irrational exuberance not strongly tied to economic fundamentals, but the valuations of many companies rose due to the orgy of public spending and the real estate bubble. Therefore, China’s stock market crash should be viewed as a preview to the country’s coming crisis, when China’s credit and property bubbles will pop. This is why investors reacted so strongly to recent events in China – they could be a canary in a coal mine (usually, changes in stock markets reflect anticipated outcomes in the real economy) warning against the real crisis, which could potentially spark global contagion, and reminding global investors that stock markets all over the world are at unsustainable levels. During these times, valuations are so inflated for U.S. equity that the market is oversensitive to economic and financial news, therefore further declines in China’s stock market could trigger some chain reaction again, even if they are not a major cause for concern.
The chart below shows the performance of the Shanghai Exchange Market Composite Index and the price of gold. As one can see, there is no clear relationship between these two variables. Gold was gaining after the stock market crash in 2007-2008, however it was caused rather by weakness in the U.S. dollar and the U.S. stock markets. The current global economic situation seems to be more similar to the Asian/Russian crisis in 1997-1998 than to the Great Recession, so any potential gains due to safe-haven demand for gold may be capped by the upward pressure on the greenback.
Chart 1: The price of gold (London P.M. fix, red line, left scale) and Shanghai Stock Exchange Composite Index (green line, right scale) from 1997 to 2015
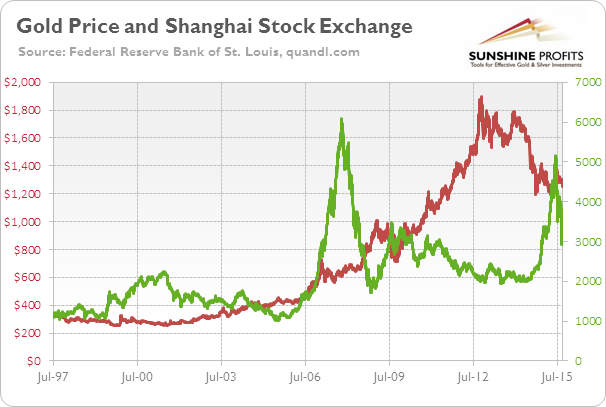
The key takeaway is that China’s stock market bubble came from developments in the property market, government meddling and irrational exuberance. The following crash is not likely to have major adverse consequences for China’s real economy, however it may be a preview of a coming crisis, which – given the current inflated valuations in global stock markets – may trigger some further bearish reactions. The bear market in stocks should be positive for the price of gold, however the appreciation of the U.S. dollar will likely exert downward pressure on the shiny metal. However, a lot “depends” and a lot “can change” in the meantime – we’ll keep monitoring the situation and describe the changes as they unfold.
If you enjoyed the above analysis and would you like to know more about the recent developments in China and their impact on the price of gold, we invite you to read the October Market Overview report. If you’re interested in the detailed price analysis and price projections with targets, we invite you to sign up for our Gold & Silver Trading Alerts. If you’re not ready to subscribe at this time, we invite you to sign up for our gold newsletter and stay up-to-date with our latest free articles. It’s free and you can unsubscribe anytime.
Thank you.
Arkadiusz Sieron
Sunshine Profits‘ Gold News Monitor and Market Overview Editor
Over the past 13 trading sessions, the benchmark S&P 500 Index climbed 7.6%.
It’s a big move in a short time. One that has many people asking if the correction is over… and if it’s safe to “go big” in stocks.
Our answer: We’re not out of the woods just yet. The recent rally is encouraging… But there are a few major obstacles the market has to overcome first…
In today’s essay, we’ll review our current investment thesis… And we’ll show you the three things to look for before getting aggressive with new stock purchases.
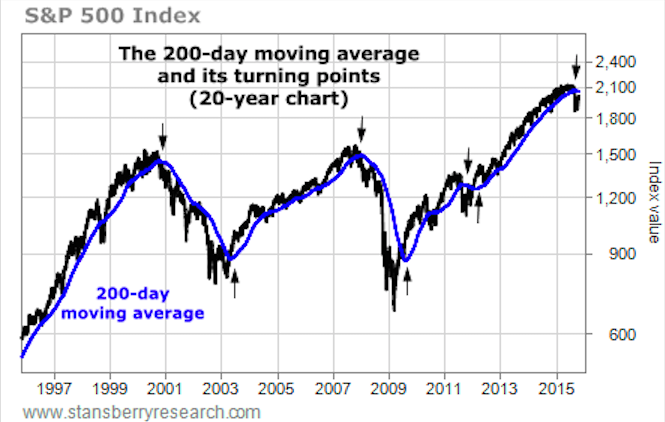
First, let’s discuss the 200-day moving average.
A lot of professionals like to use the 200-day moving average to size up a market’s long-term trend. It works by collecting an asset’s closing prices from the past 200 days, then taking the average of those prices. This produces a chart line that “smoothes out” market volatility.
There are two main things to consider when looking at the 200-day moving average:
- During bull markets, stocks tend to spend most of their time above the 200-day moving average. During bear markets, they spend most of their time below it.
- If the 200-day moving average itself changes direction, there’s a good chance a new big trend is underway.
You can get a good feel for these two ideas in the 20-year chart below. It shows the S&P 500 and its 200-day moving average. As you can see, during each of the three bull markets, the S&P 500 traded mostly above its 200-day moving average. And during the two bear markets, the S&P 500 traded mostly below it. The arrows show the seven times the 200-day moving average changed direction for at least a month.
As of August 21, the S&P 500 has traded below its 200-day moving average… and the 200-day moving
average itself has been moving lower. You can see this more clearly in the four-year chart below.
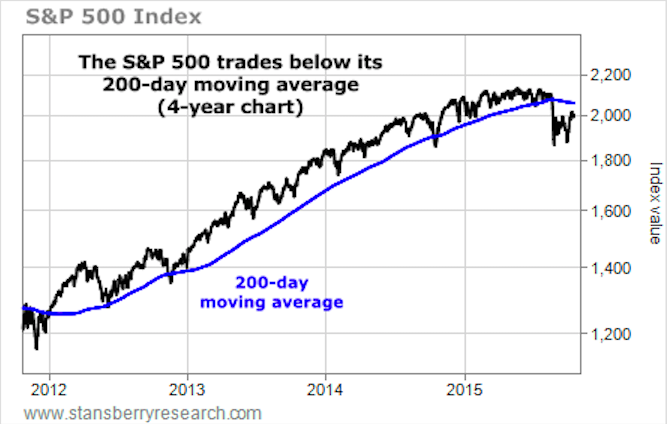
For now, the trend is down. And we remain cautious on stocks. If investors can push the S&P 500 back into an uptrend, we’ll be much more comfortable adding to our stock holdings and even speculating on higher prices.
Before we’ll trust the uptrend, though, three things need to happen:
- The S&P 500 needs to break above its 200-day moving average,
- The 200-day moving average itself needs to turn higher, and
- The S&P 500 needs to close above the 2,131 level.
No. 3 may be the final hurdle… Or it may come before the 200-day moving average turns higher. Either way, as we explained in our September 8 essay, we believe the stock market will only offer significant potential gains if the S&P 500 breaks 2,131 to the upside. Until then, the broad market is in “no man’s land.”
As you can see in the chart below, 2,131 (2,130.82 to be exact) is the all-time high for the S&P 500.
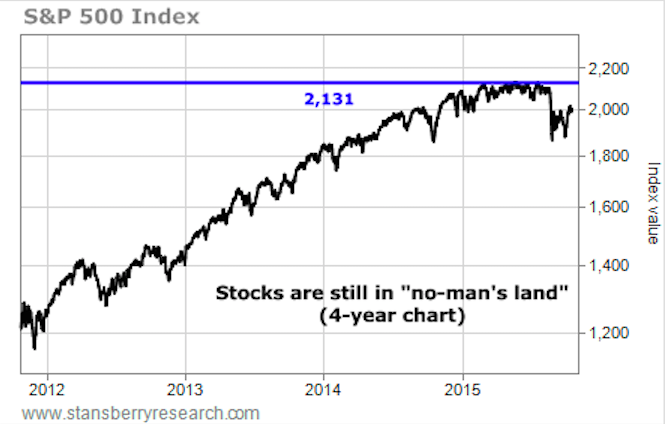
Old highs (like old lows) are important psychological levels. A move above 2,131 would mean investors believe the global economy is strengthening, not weakening. It would mean corporate profits are strong enough to shrug off today’s big worries, which include a recession in China, excessive corporate and government borrowing, and a strong U.S. dollar.
If the stock market were to break 2,131, it would go a long way toward repairing faith in the economy and the stock market.
The rapid 7.6% jump in stocks feels good. But that doesn’t mean it’s time to get aggressive… Until our three criteria are met, the stock market is “guilty until proven innocent.” The downside risk in stocks is larger than the upside potential.
So for now, our advice remains the same: Confine your stock purchases and trading to only the most attractive opportunities. Try some short trades. And keep plenty of cash on hand for any great buying opportunities that turn up.
Regards,
Brian Hunt and Ben Morris
Further Reading:
“If the S&P 500 falls 20% in the next year, how will your stock holdings perform?” Brian and Ben write. “If the S&P 500 climbs 20% in the next year, how will your stock holdings perform?” Thankfully, there’s a stock market strategy that allows you to make good money in either of these outcomes. You can learn all about it right here.
Brian and Ben say one of the simplest – and most important – ideas in all of investing is asset allocation. “It could save you hundreds of thousands of dollars over the course of your life,” they write. Get all the details here.

The title does not include a (?) after it and that is for a reason. The gold sector’s fundamentals, both sector-specific and macro, are improving and this was not the case during the last exciting upturn in the sector circa summer 2014.
Back then, everything from Russia’s move into Ukraine to the Ebola scare were imagined to be sound drivers of the gold price. This stuff proved, as expected, to be wrong when the whole complex made new lows in November of 2014 (prior to this year’s ultimate lows).
What is driving gold and the gold sector this year? The things that we have been saying for years now would be needed.
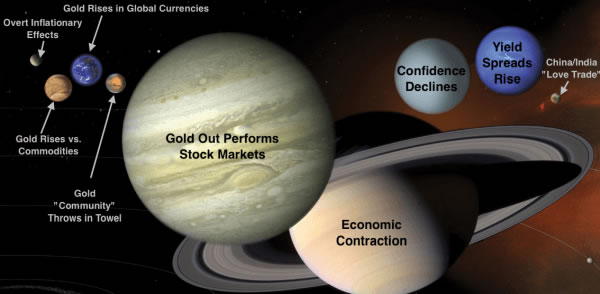
- Gold rising vs. commodities: Indicates a counter-cyclical global economic atmosphere (engaged)
- Gold rising vs. stock markets: Indicates an environment in which mainstream investors would be motivated to consider the sector (constructive, not yet engaged)
- Gold rising vs. global currencies: A self-explanatory indicator of waning confidence(constructive+)
- Declining junk/quality bond spreads: Indicates waning confidence in the financial system and those who have propped it up (engaged)
- Economic contraction as presented in mainstream economic data releases (constructive, not yet engaged)
- Treasury yield spreads rise: Indicates risk aversion to systemic stress, whether inflationary or deflationary and waning confidence (10yr-2yr inconclusive as of yet, 30yr-5yr engaging)
There are more details, but the above would paint a picture of a counter-cyclical environment, which is the investment environment for gold and would set quality miners up for a big rally or bull market. Here’s the Macrocosm (July 27) graphic again for a visual representation of the gold sector’s primary fundamental underpinnings.
Dial back to this past summer around the time the Macrocosm shtick was created by someone with
apparently too much time on his hands (not the case, I assure you!). Back then (July 17) the Wall Street Journal called a bottom on gold exactly 1 week before it made its low at 1072: Let’s Be Honest About Gold: It’s a Pet Rock
This was not a bunch of lunatics fighting each other for the right to get on the soap box and rally the troops to buy gold and hide in their bunkers for fear of the Russian horde (that and the Ebola headlines were so contrarian bearish it was palpable). This was a classic bullish contrary indicator and most recently as HUI dropped to the long-term Head & Shoulders target of 100 (101 and change) we watched it scrape along the bottom of its downtrend channel for signs of a bounce, noting that the fundamentals were firming and aided, not hurt by the media this time.
Here is the linear scale chart NFTRH used to gauge this possibility last summer for subscribers, even as log scale charts were put forth on the internet showing a breakdown below the channel for the relatively new cottage industry in gold bearishness to consider. Not this time boyz.
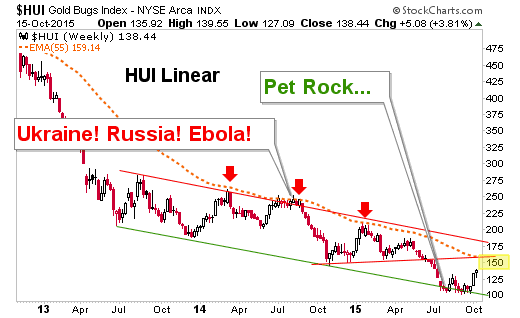
As you can see, it was touch and go at the channel bottom for weeks and I am not going to pretend to have been a resolute gold stock bull during that process. Indeed, hear this clearly… gold stocks are in a bear market, technically speaking. They are technically in a bear market even if they are in a bull market because not even the first technical milestone has been accomplished; nor would or could it be at his juncture.
But again, it is different this time because sector and macro fundamentals are either in line or slowly creeping in the right direction. You probably don’t need me to tell you that there is going to be some turbulence ahead, whether HUI gets to what we are still calling its “bounce” target in the 150’s first or not. But the nature of the sector is much improved from a fundamental standpoint; sector and macro.
The gold sector is on a technical bounce that we have anticipated since mid-summer and managed since September. With sentiment getting over bullish and Commitments of Traders data putting a bulls’ eye on silver lately, the ingredients are in place for a negative reaction. When it comes, whether from the bounce target in the 150’s or somewhere lower, it will pay for players to have their fundamental ducks in a row, unlike in summer 2014.
Many people know me as a chart guy but I am here to tell you that it is the fundamental backdrop that will be for all the marbles. The charts right now, bounce aside, remain in bearish trends for gold stocks (aside from a few little gems bucking the trend), gold and silver. We are following these trends consistently in NFTRH, but just as consistently we are keeping tabs on sector and macro fundamentals, which would lead the technicals just as most of the fundamentals noted above did in Q4 2008, only it was in quick time… like 100x faster than today’s situation.
NFTRH is a value per its peers not only in price (which will see a modest increase before year end), but also in its coverage of technical, fundamental (not company-specific), macro and sentiment/psych analysis across major global markets and chart based trade ideas. I think a subscription is well worth your investment, but then I am biased (because I personally benefit as an investor from doing this work). Check out NFTRH.com for more information and subscriber testimonials.
Bottom line on the article’s main topic, the gold sector is bouncing and this time it has a fundamental right to do so. The sector is in a bear market but the elements are aligning to end the bear. It is time to know what to tune out and what to take in when managing the process. The negative reactions will come and only a clear view considering sector and macro fundamentals andtechnical analysis will define whether and from what levels those are buying opportunities.
Subscribe to NFTRH Premium for your 25-35 page weekly report, interim updates and NFTRH+ chart and trade ideas, or the Free eLetter for an introduction to our work. Or simply keep up to date with plenty of public content at NFTRH.com and Biiwii.com. Oh, and follow @BiiwiiNFTRH.

-
I know Mike is a very solid investor and respect his opinions very much. So if he says pay attention to this or that - I will.
~ Dale G.
-
I've started managing my own investments so view Michael's site as a one-stop shop from which to get information and perspectives.
~ Dave E.
-
Michael offers easy reading, honest, common sense information that anyone can use in a practical manner.
~ der_al.
-
A sane voice in a scrambled investment world.
~ Ed R.
Inside Edge Pro Contributors

Greg Weldon

Josef Schachter

Tyler Bollhorn

Ryan Irvine

Paul Beattie

Martin Straith

Patrick Ceresna

Mark Leibovit

James Thorne

Victor Adair