
Gold & Precious Metals
Silver Market Update:
Silverbugs have been getting worked up this month about the possibility of a new bullmarket in their favorite white metal, due to its sharp rally in the early days of the month, but as we will see in this update, the long-term charts and latest COTs reveal that there is little real cause for celebration – on the contrary, we should beware of an imminent downturn in silver and more than that, position ourselves to capitalize on it.
If we start with the 6-month chart, we can quickly see what got silverbugs and their cheerleaders stoked, the sharp rally in the early days of the month, which took silver to a 3-month closing high. The problem now is that not only has silver not made any further significant progress since, as it has battled the resistance near to its 200-day moving average, but the Commercials have been aggressively piling on the shorts as we will soon see, and when you see people who are almost always on the right side of the trade, it’s not a bad idea to align yourself with them. Before leaving the 6-month chart we should note that the 50-day moving average is still quite a way below the 200-day, which is not a favorable configuration.

The Commercials certainly don’t look like they are guilty of reckless behavior when we consider silver’s 5-
year chart. As we can see it remains stubbornly locked within a major downtrend, and with recent new lows and its moving averages in bearish alignment, this chart provides little real reason for excitement. What would it take to change the still dismal outlook? – that’s easy to answer, a clear breakout from the long-term downtrend. This is not likely to occur of course unless the dollar index breaks down below the critical 92.50 – 93 support level on the index and drops away, so we will continue to keep a keen eye on that.

The fact that the Commercials are piling on the shorts here, as we can see on the latest COT chart below, of course implies that both gold and silver will drop, which further implies that the dollar will rally away from the danger zone (shown on the dollar index chart in the parallel Gold Market update). “How could the dollar rally recover?” you may well ask, given the Fed’s enormous money printing of recent years which must be inflationary, and which is still coming through the pipe, but don’t forget that this has to be set against a far greater $500 trillion mountain of atrophying trash overhanging the world financial system in the form of a plethora of bonds and derivatives, which is what is really strangling the world economy.

Finally, do not forget that even though the dollar looks like it will recover here to a certain extent, and gold and silver drop, that doesn’t mean it’s “out of the woods” – it could still turn and drop later and crash its key support.

On the short term the US Dollar is rising against the Euro, which is sliding from a recent peak. The reasons a short sale is recommended for technical reasons was explained last thursday in full HERE by Nadia Simmons. Since then the Euro has fallen from 1.149 to 1.131 as of 7am PST today.
The longer term fundamental reasons for the US Dollar rise against the Euro are laid out by Visual Capitalist HERE
Short summaries of both analyses are below – Editor Money Talks

“Looking at the daily chart, we see that EUR/USD extended gains above the barrier of 1.400 and the 50% Fibonacci retracement, which resulted in a rally to the 61.8% Fibonacci retracement and the brown resistance line. Taking into account these resistance levels and the current position of the indicators (a negative divergence between the CCI and the exchange rate, the Stochastic Oscillator above the level of 80) we think that reversal is more likely than not.
Very short-term outlook: bearish
Short-term outlook: bearish
MT outlook: mixed with bearish bias
LT outlook: mixed”
…..for larger chart and more long term analysis go HERE
The Fall of the Mighty Euro
by The Visual Capitalist
The euro itself has dropped precipitously, particularly in terms of USD but also in terms of GBP and CNY. In the beginning of 2008, a US dollar could buy only €0.65 euros. Today, on average through 2015, one US dollar can buy €0.91 euros.
….click on the image or HERE for a larger view and more analysis:


When no-name naysayers opine that the U.S. economy is headed into a tailspin, you can often take it with a grain of salt.
But when credible, well-established government agencies issue hard data denoting a big decline, it’s a different story: You’ve got to stand up and pay attention.
Consider, for example …
The U.S. Energy Information Administration (EIA), the primary government authority on energy stats and analysis. Unlike the Fed, it doesn’t make policy or even advocate policy. By law, no outside officer or employee of the government can interfere with what it concludes or says.
And right now, the EIA says that …
Just from August to September, U.S. crude oil production declined by 120,000 barrels per day …
Production will continue to fall sharply next year, leading to a mass reduction in spending on major oil projects. And, to add insult to injury …
U.S. crude oil supplies have just surged by 7.6 million barrels — over four times more than analysts expected.
Meanwhile, executives attending the Oil and Money conference in London warn that a “dramatic decline” in U.S. production is now under way.
Their reasons: world oil prices are now too low to support U.S. shale oil output, the biggest addition to world production over the last decade. And it’s not just because of declining oil prices; bank financing for shale projects has completely dried up.
OPEC agrees. The oil cartel sees U.S. production falling for the first time since 2008. The big problem is that, despite falling global demand, OPEC members are not cutting production like they might have in prior years. They’re too afraid to lose an even bigger share of the global oil market. So they continue to pump oil at a feverish pace.
Impact on global oil prices: No relief from record lows.
Impact on U.S. economy: Huge. The U.S. energy industry is the third-largest industry in the U.S. And that excludes thousands of companies and millions of jobs that feed off the industry indirectly.
 The U.S. Department of Agriculture (USDA), unlike the EIA, is responsible for policy. But ever since Abraham Lincoln started the agency during the U.S. Civil War, millions of players in the commodity markets have relied on its forecasts.
And right now, U.S. agriculture is getting killed.
Take wheat, for example, one of the America’s largest field crops: According to the USDA’s Economic Research Service, U.S. wheat exports have plunged to their lowest level in guess how many years!
Not 10. Not 20. But 44!
That’s right. The last time our wheat exports were this bad was back in 1971.
The big problem: The United States is virtually priced out of the global wheat trade, with still more hits to U.S. exports on the way.
But this disaster is not limited to just one crop or even one industry. Indeed, the primary driver of the slump is a powerful force that cuts across all U.S. exports — the sharp rise in the U.S. dollar.
According to Bob Young, chief economist at the American Farm Bureau Federation, it’s the dollar’s 20% surge since July 2014 that’s mostly responsible for gutting U.S. farmers. (And, as I’ll illustrate in a moment, it’s also the same force that’s now killing U.S. corporate earnings.)
Meanwhile, foreign farmers and agribusinesses can jump in and sell their commodities at dramatic discounts, thanks to an unprecedented plunge in their local currencies.
Brazilians, for example — leading producers of soybeans, coffee and sugar — can greatly undercut U.S. farmers thanks to a 42% crash in the Brazilian real since last July. Russian farmers? They’re leveraging a currency collapse of 48%.
All “contained” to energy and commodities? No way! Anyone who buys that argument is in for a rude awakening, as I’ll show you next.
 At the U.S. Department of Labor, the headline unemployment number is not quite as reliable as stats from the other government agencies I just told you about.
But when all their underlying data is terrible … when big companies are announcing layoffs … and when every other source paints the same dark picture, then you know the trouble is for real.
That’s the situation we have now: In the last couple of months, nervous U.S. employers — small, big and huge — have suddenly started to pull back sharply on their hiring.
A key reason: On top of the U.S. dollar being strong, foreign markets have plunged, foreign buyers have shunned U.S. goods, and U.S. manufacturers are getting stuck with big unsold inventories.
But if you think the latest job numbers were bad, brace yourself for what’s coming next. Giant U.S. companies like Caterpillar, Hershey, Wal-Mart, ConAgra Foods, Chesapeake Energy and others have already announced big layoffs, and these layoffs are not yet included in the Labor Department’s unemployment stats.
There was one bright spot in the September job numbers, though: Most retail companies continued hiring.
The problem: Now the retail sector is also starting to take a hit …
 We know because of the latest release last week from the U.S. Department of Commerce.
Now, if sheer size (not gross inefficiencies) were the criteria, this executive-branch agency would probably be the most impressive data source in the world.
But regardless of their problems, there’s little argument that U.S. retail sales are now getting hammered.
September sales were only half of what economists were expecting …
The gains previously reported for August were totally bogus — completely wiped out by revisions, and …
Only six out of 13 categories showed sales gains, a sign that the malaise is starting to spread throughout the economy.
The clincher to all this is corporate earnings: Despite a few notable exceptions here and there (like Citigroup last Thursday), one major company after another is releasing shockers that cast a shadow over the entire U.S. economy.
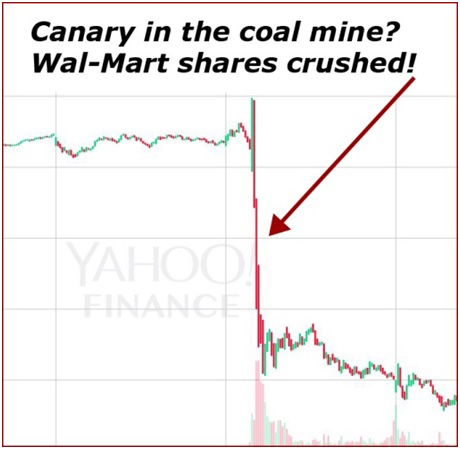 The prime example is retail supergiant Wal-Mart.
It’s the world’s largest retailer. It has nearly half of a trillion dollars in annual revenues. And it’s gotten crushed.
Last Wednesday, it announced its profits will miss forecasts by a country mile: Rather than rising 4% in the next fiscal year as analysts expected, they’re going to fall 12%.
Result: Wal-Mart shares suffered their biggest one-day crash in 17 years.
But they’re not alone. CNBC highlights how even industry sectors thought to be immune are now falling by the wayside — luxury goods (example — Burberry), health care (e.g. HCA), consumer discretionary (Garmin), and many more.
Look. Even assuming stock analysts have learned their lesson and are finally getting it right, S&P 500 profits are now forecast to drop at the fastest rate since the tail end of the Great Recession.
What does all this mean? I don’t think I have to connect the dots for you. It’s obviously not good for stock investors … unless you can do four things:
- Use stock market rallies — like the one we’ve seen in recent days — to help build a huge, oversized cash position.
- Wait patiently for most stock prices to take another big hit, whether now or later.
- Then, consider strictly extreme top-notch quality.
- And hedge your risk with investments that are designed to go up when stocks go down.
Good luck and God bless!
Martin

Over the last several weeks, I have focused almost exclusively on the potential rebound in the market as we enter into the seasonally strong time of the annual investment cycle. To wit:
“As you can see, the markets did retest the late August lows, and when combined with the very oversold conditions, led to a frantic “short covering” rally back to previous resistance. It is worth noting that the recent market action is very similar to that of the August decline and initial rebound as well.
Of course, the question that must be answered is whether we have seen the end of the current correction or is this just another “reflexive rally” that will fail?”
The chart below is updated through yesterday’s close.”

….click HERE for larger chart and more analysis including Sector Analysis and Year End Rally Coming? (scroll down)

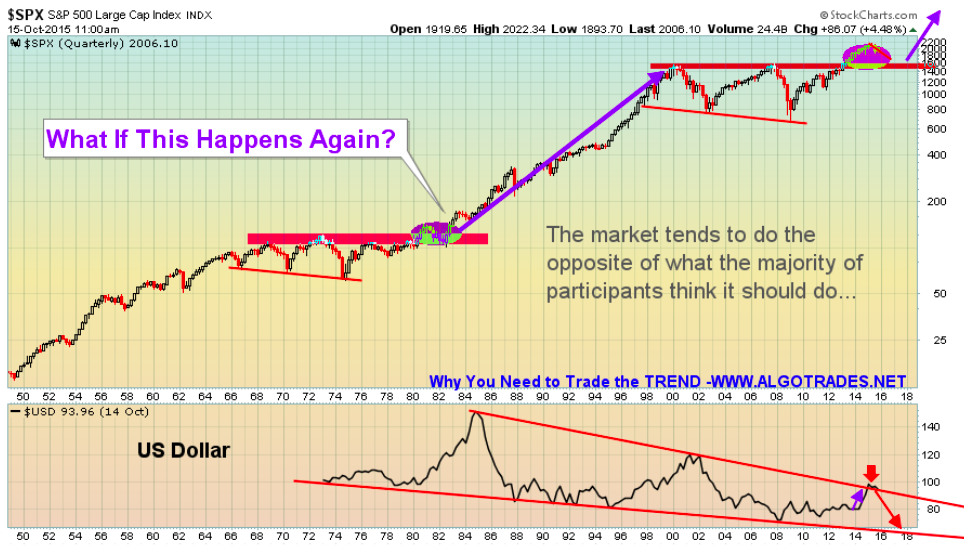
This chart I feel provides a great perspective on the overall market trend and price patterns. This is the 70 year historical chart. I hope something like this unfolds. Fingers crossed to a nominal 12 month correction/bear market. This will build a new base for the next super cycle.
US Dollar has now reached the upper resistance trend line… we could see weakness in the dollar going forward… Keep in mind this is a quarterly chart, lower prices may still be a few months away.


-
I know Mike is a very solid investor and respect his opinions very much. So if he says pay attention to this or that - I will.
~ Dale G.
-
I've started managing my own investments so view Michael's site as a one-stop shop from which to get information and perspectives.
~ Dave E.
-
Michael offers easy reading, honest, common sense information that anyone can use in a practical manner.
~ der_al.
-
A sane voice in a scrambled investment world.
~ Ed R.
Inside Edge Pro Contributors

Greg Weldon

Josef Schachter

Tyler Bollhorn

Ryan Irvine

Paul Beattie

Martin Straith

Patrick Ceresna

Mark Leibovit

James Thorne

Victor Adair