
Energy & Commodities
The oil price has had a nice rise in the past week so let’s see just what is going on using the weekly and daily charts.
Oil Weekly Chart
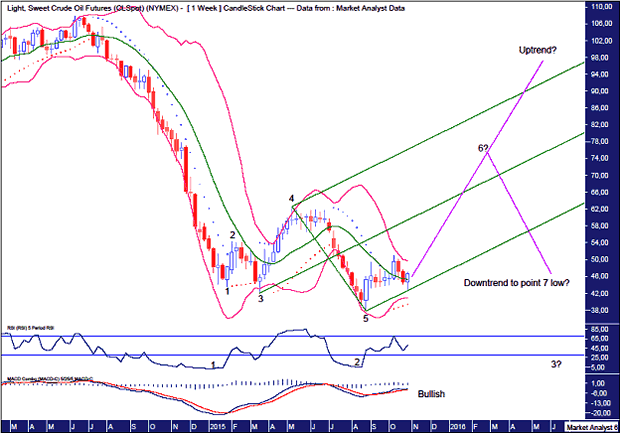
We can see the 5 point broadening low in place. While we have nailed the last two lows I feel the longer term view may be a touch off. That revolves around price not trading below the 2009 low of $32.70. I am starting to have second thoughts about this. Why?
I was expecting a bigger rise to have already been witnessed by now. It hasn’t. I’m pretty finicky with how things look and this has caused me to review my longer term outlook.
While a new bull trend may well be already force, I am starting to lean towards this 5 point broadening low eventually morphing into an even more bullish 7 point broadening low.
The RSI shows a bullish divergence at the point 5 low and a point 7 low would likely set up a nice triple bullish divergence. That would indeed be a much more preferable picture to me eye.
There is another reason why I favour one final low after this rally but will leave that for the moment as it revolves around a pattern on the daily chart.
The MACD indicator is bullish indicating the likelihood of higher prices in the weeks ahead.
The PSAR indicator has a bullish bias with the dots underneath price.
The Bollinger Bands show price looks to be finding support at the middle band and I suspect a solid move higher is on the cards here.
I have drawn an Andrew’s Pitchfork which shows last week’s low right at support from the lower channel line. I am now looking for price to head up into the upper channel. From there the bull trend will gain momentum or a point 6 high will be put in place.
Now let’s zoom back in with the daily chart.
Oil Daily Chart
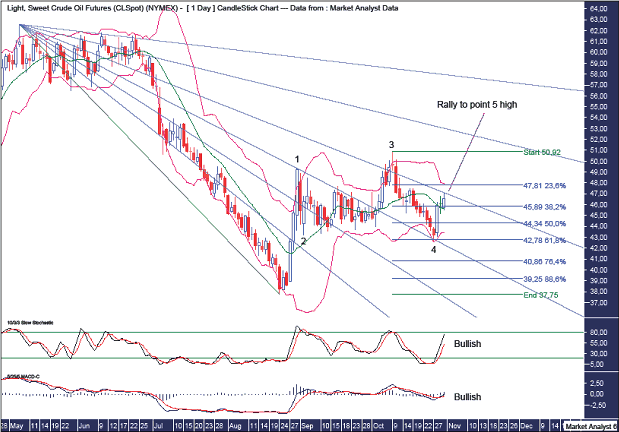
The Stochastic and MACD indicators are both bullish.
The Bollinger Bands show price has bounced bullishly off the lower band and already has the upper band in its sights.
The recent low was right at support from the 61.8% Fibonacci retracement level and also the 50% Fibonacci Fan angle. Beautiful.
This low looks to be a point 4 low in a 5 point broadening top formation. This is the reason alluded to as to why I now think new lows below the 2009 low will eventually be seen. The expected point 5 high will also be the point 6 high of the 7 point broadening low formation. Patterns within patterns! Human behaviour repeats across all markets.
Also, this point 4 low is effectively a bullish double bottom with the point 2 low so some fireworks could be expected.
We can look at likely topping levels, if indeed that is what will play out, after this move has built up some steam.
About the The Voodo Analyst
Austin Galt is The Voodoo Analyst. I have studied charts for over 20 years and am currently a private trader. Several years ago I worked as a licensed advisor with a well known Australian stock broker. While there was an abundance of fundamental analysts, there seemed to be a dearth of technical analysts. My aim here is to provide my view of technical analysis that is both intriguing and misunderstood by many. I like to refer to it as the black magic of stock market analysis.

Bigger than Apple, Amazon and Priceline Combined
 I was so impressed with Jon Markman’s research on the Internet of Things presented here last week, I decided to scan the field myself. And I promptly discovered three things:
Number one: He’s right on the money. All over the world, enormous amounts of human resources, brainpower, technology and capital are moving into this new Super-Internet that connects people to devices and devices to each other.
Number two: The estimates he quotes regarding how dramatically the Internet of Things can grow – bigger than the sectors associated with Google, Apple, Facebook, Priceline and Amazon combined — may actually be understated.
And number three: The Internet of Things is not a single industry or sector. Rather, it’s a force that’s already sweeping across nearly all technologies and industries. That includes:
Electric utilities already mass-deploying smart meters that provide detailed data on energy usage, virtually eliminating the need for on-site visits.
Auto insurers setting premiums for commercial and fleet customers through the Internet of Things. Rather than rely on broad indicators like the driver’s age and gender, they’re installing devices in the vehicles to track how many miles drivers have driven, where they go and how safely they drive.
Train manufacturers outfitting trains with systems that can predict and prevent accidents.
Construction and mining industries rushing to equip hard-hat workers with wearable devices that scan the environment to signal when they’re in danger.
Security companies connecting video cameras, alarms, door locks, motion sensors and tracking devices all into one integrated network.
At least 14 car manufacturers, accounting for 80 percent of the worldwide auto market, deploying strategies for transforming their cars into Internet-of-Things devices.
And much more.
Moreover, none of this is speculation. It’s all starting here and now. In fact, at just one company (Verizon), last year’s growth in this field was 83% for their customers in transportation and distribution, 88% in retail and hospitality, 89% in home monitoring, 120% in media, 128% in finance, and a whopping 204% in the manufacturing industry.
The key question: How to profit?
I feel the best person to provide the answer is Jon Markman himself.
For decades, Jon has forecast and reported on nearly every major technology trend, including the rise of the PC, the popularity of the iPod, the mobile expansion of the Internet, and the dominance of the cloud.
Jon was the founding managing editor of MSN Money. He helped develop the first online stock screening system. And he earned shares of two patents at Microsoft for his contributions to the development of portfolio management systems.
Here are his answers …
How investors can get richer
as everyday objects get smarter.
by Jon Markman
Usually I’m happy if I find one or two great investments in a new sector of the economy, especially one with such rapid growth potential.
But it’s rare that I see so many investing opportunities that I can construct an entire investing portfolio from just one disruptive technology! That’s the situation we have now with the Internet of Things.
Moreover, the wide array of choices makes it easier for me to cherry-pick the ones offering the highest returns with the lowest risk.
That’s because the applications for the Internet of Things are virtually limitless. It’s because industry experts, companies, and research firms are throwing trillion-dollar market estimates around like they’re chump change.
- Recently, GE estimated the Internet of Things could add an additional $10 trillion to $15 trillion to global GDP over the next two decades.
- Networking equipment giant Cisco estimates the Internet of Things could add $19 trillion to the worldwide economy by 2020.
- And that’s on top of the already $1.9 trillion global market for the Internet of Things in 2013.
The estimates may vary, but one thing is abundantly clear: We are entering a decade of immense technological change. And history has shown that any technology that can disrupt the world so thoroughly can also make investors so incredibly wealthy.
Consider smart phones. It was only eight years ago that Apple launched the iPhone.
I will never forget flying into the Dallas airport in 2008 about a year later. I looked around and couldn’t believe that almost everyone I saw was already using one.
But I also realized this transformation was not yet reflected in Apple’s stock price. Most investors had no idea how massive the transformation really was.
If you had understood the power of the smart phone technology, you could have watched your wealth skyrocket 579.5% following the iPhone launch. Every $10,000 invested in Apple at that time is now worth $67,950 today.
Just last year alone, over 1.2 billion smartphones were sold, for a total global market of $300 billion. And that’s just a drop in the bucket compared to the coming $19 trillion Internet of Things Shockwave.
If you thought Amazon was just a
bookstore, you missed out on 9,362% gains.
Today we assume that we can find, buy, and ship just about anything to anywhere over the Internet.
But we often forget that this is actually a very recent phenomenon: Back in 2001, most people still thought of Amazon.com as just a bookstore. What most investors didn’t grasp was that it wasn’t about books at all, or at least not only about books.
Amazon wanted to transform the way that Americans bought everything.
The problem was most investors were too terrified to buy into Jeff Bezos’ vision — especially smack in the middle of the 2001 tech bear market.
But if you had understood the massive upheaval Amazon was creating in the retail market and jumped on the stock, you could have racked up a fortune-making 9,362% return.
Think about it: A modest $10,000 investment in Amazon in 2003 would be worth $946,200 today — and that’s in spite of another big bear market in 2008.
This summer, Amazon officially became the biggest retailer in the world — with a market cap of over $246 billion, surpassing Wal-Mart’s $230 billion.
And even at $246 billion, Amazon’s success is just a fraction of the total $19 trillion potential for the Internet of Things.
If you didn’t realize that most travel agents were headed the way of the dodo bird, you missed out on 19,034% gains.
Consider Priceline.com. Yes, it was the poster-child for the dot.com bust. And yes, it crashed in value in the two years after its IPO.
But despite that crash, Priceline continued to ride a massive wave of change in the travel industry.
Seriously, who even uses a travel agent anymore? You just jump on line and bargain shop for the best deals on hotels, airlines, rental cars, and more.
It may seem obvious now, but very few people saw the transformation in the travel industry coming back in 2000. Priceline did. And they not only survived, they thrived after the bust.
If you had the chutzpah and the foresight to invest in Priceline at that time, you could have banked an incredible 19,034% gain over the past fifteen years. Every $10,000 invested turned into $1.9 million.
Here’s the key: The technology stocks tied to the Internet of Things are riding a major wave of innovation greater than Amazon’s, Apple’s and Priceline’s combined.
Priceline generated a whopping $8.44 billion in revenues in 2014.
But according to Cisco, the Internet of Things will generate over two thousand times that much.
It’s not about building a better mouse trap.
It’s about building a better world.
So I repeat: If you missed investing in Intel, Microsoft, Apple, Priceline, Google and others in the past years, that’s okay.
Because you have one more chance in your life to ride a technology shockwave from its infancy all the way to maturity.
In fact, it may be the final opportunity you have in your life to grow a family fortune, to secure a comfortable retirement and to leave a sizeable inheritance to your children and grandchildren.
The Internet of things is automation on steroids.
There are already over 12 billion smart devices interconnected with each other and the Internet right now.
I’m not just talking about iPhones and computers. I’m talking about things like traffic monitors, roadways, pacemakers, manufacturing equipment, street lights and much more.
Estimates are for 50 billion more”things” or devices to be connected by 2020. But I think that estimate is low.
Why so much, so fast?
Here’s why: Right now, there are three major tipping points catapulting the Internet of Things to a global scale not seen since the dawn of the industrial revolution.
Tipping Point #1
Rapidly Declining Costs
For any new technological revolution to succeed, production costs must drop, allowing mass commercialization to emerge. This is true for the Internet of Things as well.
Fortunately, sensor prices have already dropped more than half from $1.30 to 60 cents. And I expect to see continued drops — by half and half again — in the coming years. In fact, I wouldn’t be surprised to see sensors ultimately fall to less than a penny each, propelling a massive surge in usage.
Meanwhile, we’ve already seen processing costs decline nearly 60 times over the past decade. And we’ve seen far cheaper bandwidth and networking costs – down by a factor of nearly 40 times in just 10 years.
Tipping Point #2
Virtually Unlimited Wi-Fi
Stop by your local coffee shop. Chances are it offers wireless Internet access.
You think nothing of it. It’s the way things are, right?
Now? Yes. Just a few years ago? No way! It used to cost you a pretty penny to hook up to the Internet.
Then came Starbucks. In 2010, they began offering free unlimited Wi-Fi to customers. Other merchants quickly followed suit. Airports soon joined the bandwagon. Now, even entire cities offer free Wi-Fi.
Tipping Point #3
Advanced Network Connections
Today, network connections are faster, smarter and more automatic.
They connect nearly everyone and everything to the cloud.
And most important, the cloud is everywhere.
So now, mankind can expand the Internet of Things into nearly every nook and cranny of our lives.
Now, thanks to these three powerful triggers, you’re going to see an explosion of new applications for smart cars, smart homes, smart businesses and smart cities.
And that means an explosion of new profit opportunities for investors in the know.
Jon Markman
To get Jon Markman’s to 5 Investments in this area Click HERE

Originally published October 31st, 2015.
It was ironic that when Dr Watson complained to his companion Sherlock Homes that he had a stomach ache, Holmes clarified the situation at once by saying “Alimentary, my dear Watson”. More generally, the legendary sleuth of Victorian London would make light of his accomplishments after solving cases that baffled the police, by remarking “Elementary, my dear Watson”. Doubtless this expression was deeply irritating to his arch-enemy Moriarty.
Today we are going make light of what to other analysts may be abstruse and possibly baffling, by “joining the dots” to demonstrate the linear connection between an extremely bearish silver COT and an imminent crashing euro, so that by the conclusion of this article, you, dear reader, will have a clear understanding of what is set to unfold, and will be able to explain to other confused souls that it really is elementary.
We will start by looking immediately at our most important piece of evidence, the latest silver COT, which is very bearish indeed, because the Commercials now have their biggest short position since 2008. This makes a big drop in silver very likely soon, and it is expected to make new lows, probably heading to the $10 area. Doubt that this is true? – then look at what happened to silver over the past year on its 1-year chart placed directly below the COT chart, when the Commercials had a high short position – I rest my case.


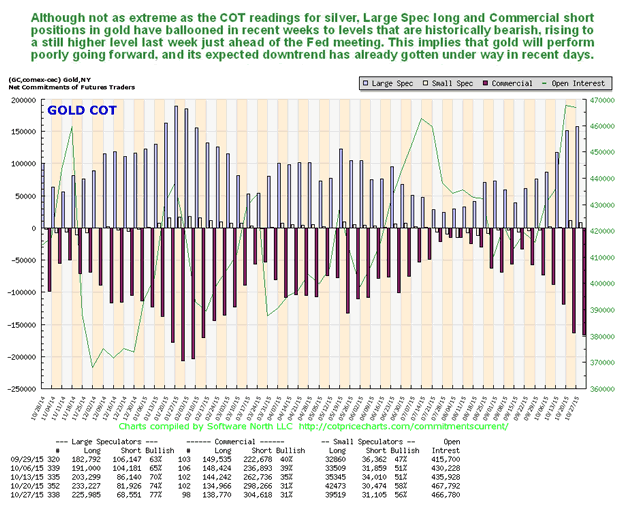
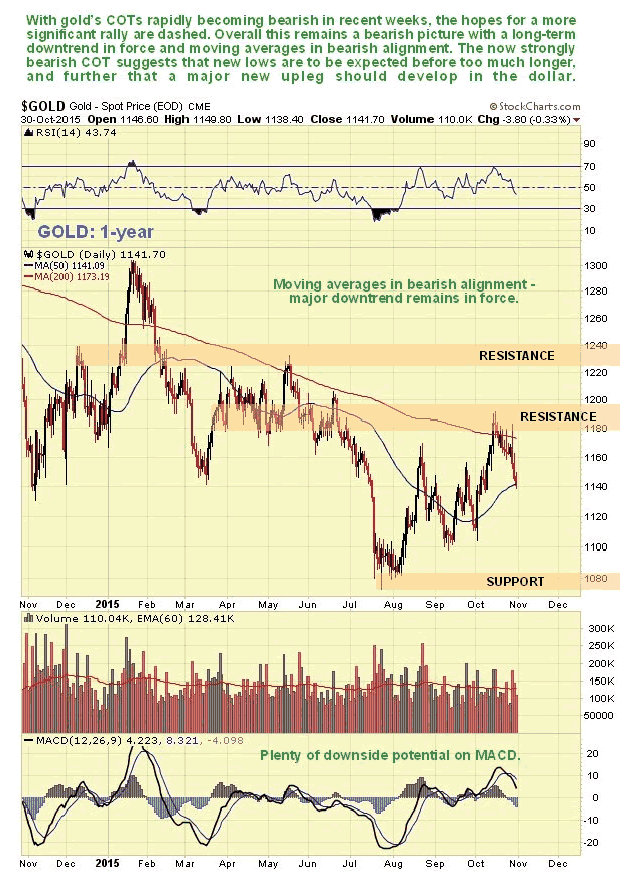
Next we look at gold’s latest COT, with its 1-year chart placed directly below for comparison. It’s similar, although not so extreme as silver, but the conclusion is the same.
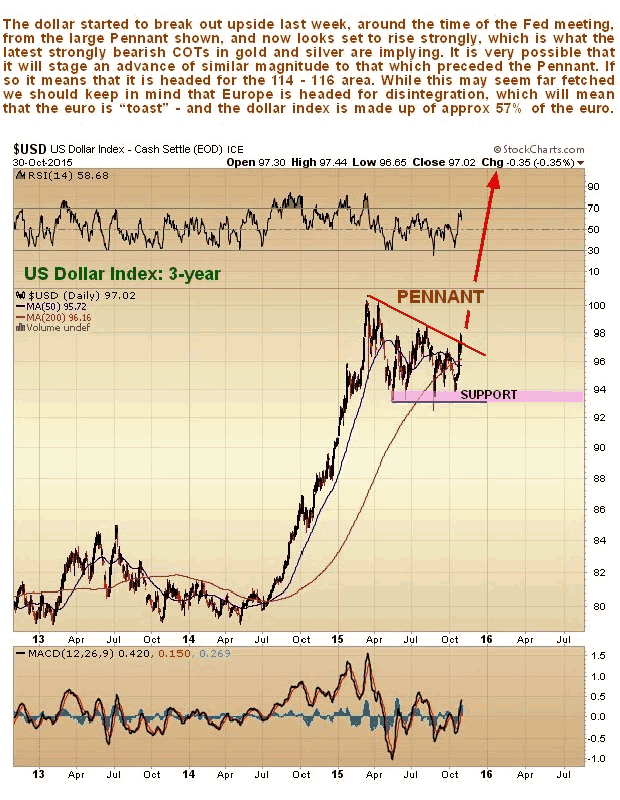
So, gold and silver are going to drop a lot – what does that mean for the dollar? – it means the dollar is going to rally, and rally a lot, and on its 3-year chart we can see that it is in position to do just that. Following its dramatic rally from July of last year to March of this year, the dollar index has been stuck in a large triangular trading range, which could be either a consolidation pattern or a top. It has already started to break out upside from this pattern on the Fed meeting this past week, and it wouldn’t take much to swing its moving averages into bullish alignment. If it succeeds in breaking out upside from this pattern and following through, it is likely to mount an advance of similar magnitude to the one preceding the consolidation pattern, which means it will target the 114 – 116 area, a big move indeed.
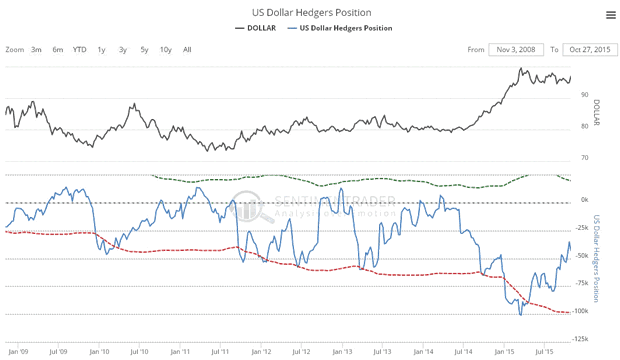
COTs for the US dollar are in middling ground, but have certainly eased enough to permit a big advance, as shown by the latest Hedgers chart, which is a form of COT chart…
If the Fed starts an interest rate rise cycle, it would of course bolster the dollar, but as we know there is precious little scope for them to do so without triggering an economic cataclysm, because of the frightening levels of debt that now exist. So what else could cause the dollar index to rise? the euro, that’s what. Don’t forget that the dollar index is some 57% composed of the euro, and with Europe threatening to fall to bits, crippled as it is by ruinous debts and with political differences between member states being aggravated by differences over how to handle the massive influx of migrants, the euro is really on the ropes and looks like it is starting another major downleg on its road to eventual oblivion. With regards to the migrant crisis, Europe is reaping what it has sown, by joining forces as an obsequious sidekick with the US in its destabilizing rampage around the Mid-East. It’s alright for the US, the migrant’s rubber boats can’t make it across the Atlantic, but they sure can make the 20 km crossing from Bodrum to Kos.
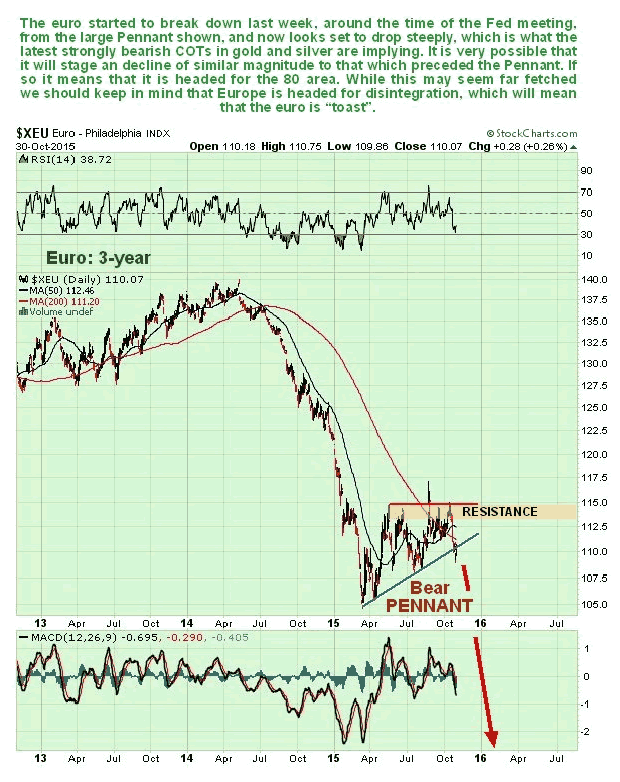
Let’s look at the latest euro chart now. As we just saw, the dollar index is starting to break out upside to start another major upleg, so we can expect to see the opposite occurring in the euro, a major downleg just starting, and that is exactly what we do see. With Europe blighted by huge debts, Germany weakening rapidly as its export markets shrink, its reputation tarnished by the VW scandal, and beset by hordes of immigrants with their hands out so that it looks set to fall to the ground, a constitutional crisis looms for the EU, especially if Britain votes to leave, and the euro is threatened with extinction, so it is not hard to see why the next downleg in the euro could easily be as bad as the one from the Summer of 2014 through the Spring of this year, and if it is, we are looking at the euro dropping to 80 or lower.
If the euro fell this far it means that we will see another huge ramp in the dollar index, which would be expected to trigger a big drop in both gold and silver to new lows. Now you should be able to grasp why the Commercials are piling on the gold and silver shorts – it’s elementary, my dear reader.
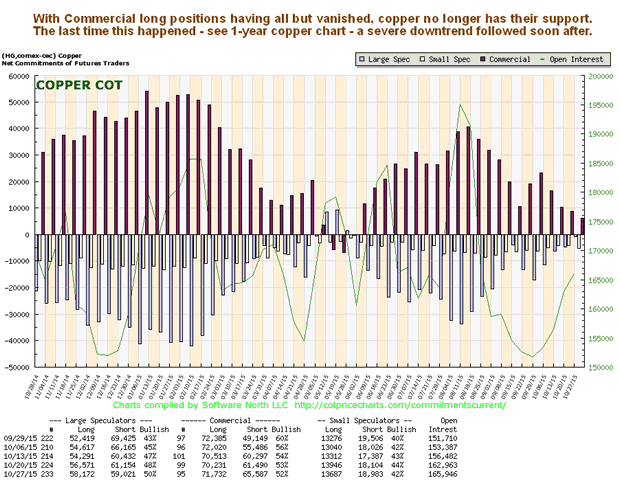
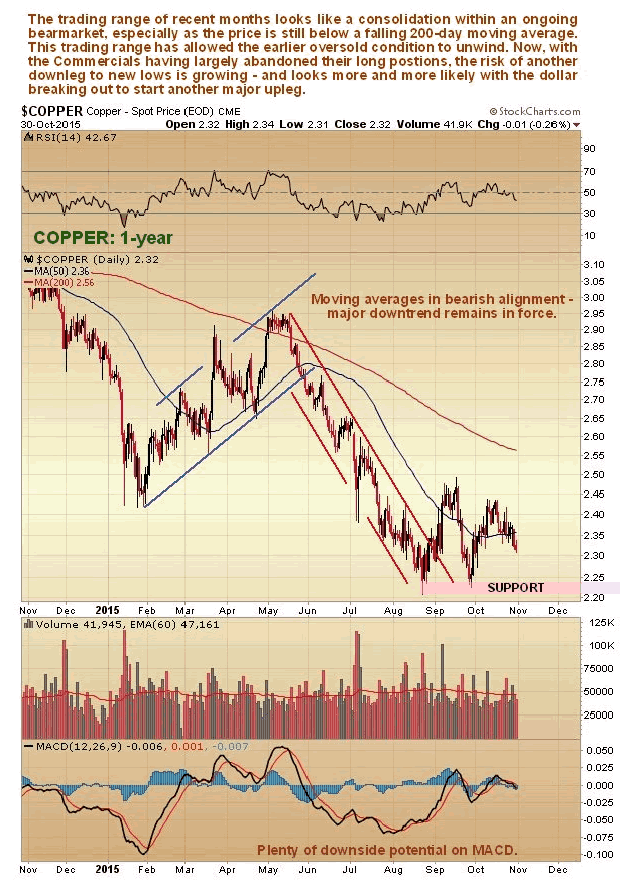
If a big ramp in the dollar ensues it is logical to suppose that many other commodities, apart from gold and silver, will get whacked down again. So let’s take a look at copper and its COT as we would expect this to get hit too. As we can see on the latest COT chart, the Commercials have been “jumping ship” in recent weeks, scaling down their long positions to a very low level. The last time this happened, back in May, a severe downtrend followed as we can see on copper’s 1-year chart, shown directly below the COT chart.
On clivemaund.com we are not going to stand around staring blankly as gold and silver drop away to new lows. This is an opportunity to make big gains on the short side in the PM sector, and we will be looking at a range of vehicles which we can use to do just that, some of which we have already bought over the last week or two.
Saturday 31 October 2015
Quotable
“One never finds a cathedral, a wave in a storm, a dancer’s leap in the air quite as high as one has been expecting.”
Marcel Proust, Within a Budding Grove
Commentary & Analysis
Like Oil Here? Then you like CAD here.
There are good reasons why oil prices go lower from here. I won’t attempt to re-hash them; others have done and adequate job at that already. But, based on my Chart View (aka pattern analysis) oil goes higher from here before going lower again. Guessing on a first target at the nice round $55 number. Take a look:
Oil Futures (WTI) 3-hour View: Targeting up to 55.73 on a standard extension of Wave (A) = (C)…key resistance is at 47.50 near term. Key support that changes the view is back at 42.52; I’m not a fan of black gold below there.

Using an oil guess to make a currency guess seems a bit odd—agreed. But if we are to play that guessing game the path oil leads to among the major pairs is the Canadian dollar. You can see clearly in the chart below oil and CAD-USD have been moving together:
Oil (red) vs. CAD-USD (black) Daily View: I guess that’s why they call CAD a commodity currency. You can see the tight correlation it has with oil prices.

Now to the dramatic conclusion: If you think oil is poised to rally, it makes sense to be long the Canadian dollar against the US dollar.
Regards,
Jack Crooks
President, Black Swan Capital
Twitter: @bswancap
If you are interesting in becoming a subscriber to our Black Swan Forex service (which also includes our Current Options Strategist in the price) we are offering a special price for the next 10-days.

This past week, the Federal Reserve, as expected, failed to raise interest rates once again due to ongoing economic weakness and weak labor market results. However, while that meant “accommodative policies” are here to stay for a while longer, it was their forecast that got the “bulls” excited. As Mohamed El-Erian penned for Bloomberg:
“Of critical importance to markets is that a decision to raise interest rates for the first time in almost 10 years is now more of a ‘live’ possibility at the Fed’s next policy meeting, in December. In reasserting this policy flexibility and making it explicit, the central bank refrained from providing specifics about the elements that would drive the decision.
The Fed’s message conveyed greater unity among its policy-making officials. Only one member of the Federal Open Market Committee — Jeffrey Lacker, the president of the Richmond Fed, dissented. The near unanimity was an important accomplishment by Chair Janet Yellen, especially given the range of views expressed in the weeks leading up to the meeting, including by the usually united governors.
Many of those in the markets who had grown comfortable with the idea that the Fed would delay a hike until next year are now rushing to adjust. The result will be higher interest rates, especially for shorter maturity Treasury bills, and a stronger dollar.”
The last sentence is the most important. While the “bulls” came piling back into the market (creating a short-covering squeeze late Wednesday afternoon) the consequences of higher rates as noted really isn’t that bullish for stocks.
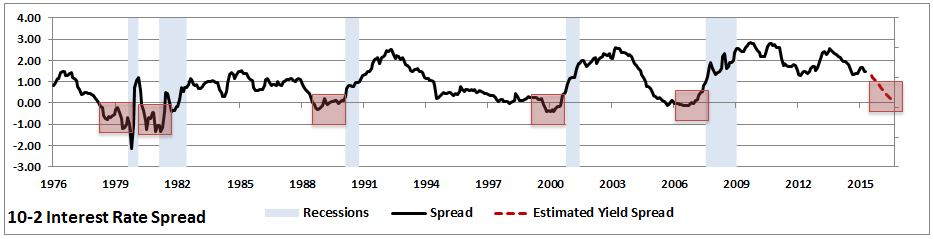
First, let’s take a look at the beloved yield-spread which is currently signaling “no recession” in the economy. As the chart below shows, the spread currently between the 10-year and the 2-year Treasury bonds is positive. However, as shown by the dashed red-line, when the Fed starts hiking the short-end of the curve, without economic growth picking up the long end, recessionary inversions can happen very quickly.
….read more HERE including Sector Analysis


-
I know Mike is a very solid investor and respect his opinions very much. So if he says pay attention to this or that - I will.
~ Dale G.
-
I've started managing my own investments so view Michael's site as a one-stop shop from which to get information and perspectives.
~ Dave E.
-
Michael offers easy reading, honest, common sense information that anyone can use in a practical manner.
~ der_al.
-
A sane voice in a scrambled investment world.
~ Ed R.
Inside Edge Pro Contributors

Greg Weldon

Josef Schachter

Tyler Bollhorn

Ryan Irvine

Paul Beattie

Martin Straith

Patrick Ceresna

Mark Leibovit

James Thorne

Victor Adair