
Gold & Precious Metals

Gold & Silver Bullion Video Analysis
Gold & Silver Stock ETFs Video Analysis
Trader Time Swing Trades Video Analysis
Key Individual Precious Metal Stocks Video Analysis
Above are today’s videos and charts (double click to enlarge):
Thanks,
Morris
The SuperForce Proprietary SURGE index SIGNALS:
25 Surge Index Buy or 25 Surge Index Sell: Solid Power.
50 Surge Index Buy or 50 Surge Index Sell: Stronger Power.
75 Surge Index Buy or 75 Surge Index Sell: Maximum Power.
100 Surge Index Buy or 100 Surge Index Sell: “Over The Top” Power.
Stay alert for our surge signals, sent by email to subscribers, for both the daily charts on Super Force Signals at www.superforcesignals.com and for the 60 minute charts at www.superforce60.com
About Super Force Signals:
Our Surge Index Signals are created thru our proprietary blend of the highest quality technical analysis and many years of successful business building. We are two business owners with excellent synergy. We understand risk and reward. Our subscribers are generally successfully business owners, people like yourself with speculative funds, looking for serious management of your risk and reward in the market.
Frank Johnson: Executive Editor, Macro Risk Manager.
Morris Hubbartt: Chief Market Analyst, Trading Risk Specialist.
website: www.superforcesignals.com
email: trading@superforcesignals.com
email: trading@superforce60.com
SFS Web Services
1170 Bay Street, Suite #143
Toronto, Ontario, M5S 2B4
Canada

The following is part of Pivotal Events that was published for our subscribers October 28, 2015.
Stock Markets
The top headline included a “great rolling ball of money”, as speculators dashed from one sector to another. The problem is that the hit to the SSEC amounted to a $3 trillion loss in market cap. The latest dash has been to the Chinese corporate bond market, which now appears vulnerable.
The ball of speculative money is not only fickle it is diminishing.
The irony is that policymakers still believe that central bank easing drives the economy up. The public isn’t impressed with such theories and bids up what it wants, when it wants. And then it bids them down. Usually, unintentionally.
On the latest bidding up, the ChartWorks had the DJIA reaching the Keltner Band targets at 17505 to 17870. The high has been 17712 earlier today.. This is now generating a Sequential (9) Sell set up. The last one was on May 20th.
The path to the next decline has to face two days of FMOC posturing.
Over in the financial sector, XBD (Broker-Dealers) took the hit and has accomplished a couple of dead-cat bounces. Nothing very constructive. Action in the yield curve has been non-supportive, but the correction in credit spreads has been positive.
Considering the impressive rebound in the S&P, this sector is concerning.
Resources sectors such as base metals and the oil patch have accomplished somewhat better rebounds. Slipping below the 50-Day moving averages would be unhealthy.
As noted a couple of weeks ago, massive interventions could be seasonal. So far the Bank of Japan has not made a sensational headline. Nothing bad can be allowed to happen in October.
Credit Markets
Credits spreads widened out to 242 bps on October 2nd, the day the dreadful employment number was released. This was followed by a massive REPO operation and equally massive short squeeze.
The spread has come in to 224 bps, which is a greater correction than the one that began on August 24th.
The point to be made is that serious widening preceded two sharp hits to global financial markets.
The Treasury curve was very friendly to banks and financials from the first of the year until early July. Then unfriendly to August 20th, and then has been in a narrow range since.
As noted last week, this is trying to breakdown. At 141 now, slipping below 139 would be a negative for the financial markets.
Out of the hit that ended on October 2nd, JNK has had the best rally since things started to go wrong in June. The low was 35.10 and the high was 36.65 on Friday. This is struggling against the declining 50-Day ma and another failure seems likely.
We have been out of lower-grade stuff since the peak in June 2014.
The long bond (TLT) spiked up to 126.21 on October 2nd and declined to 121.66 a couple of weeks ago. It has recovered to 124.90 and the rally has had a target at the Keltner band, near 126.
This pattern could generate a MCD Sell.
We’ve been standing aside since the high of 128.37 on Black Monday.
China Corporate Bond Bubble

• The February high in the Chinese market was very close to that salient peak in US Treasuries.
• Subsequent highs were not coordinated with swings in the US market.
• The Euro bond market followed the US peak by setting its high in April and failing.
• Treasuries are getting close to the mext significant price decline.
• Chinese bonds have rallied against the decline in the Shanghai Stock Market.
• Has the bond buying been equivalent to the frenzy in the SSEC that peaked in June?
Link to October 30 Bob Hoye interview on TalkDigitalNetwork.com:http://talkdigitalnetwork.com/2015/10/will-us-interest-rates-rise-in-december/
Listen to the Bob Hoye Podcast every Friday afternoon at TalkDigitalNetwork.com

 Some markets are still strong, but the bulk is no longer moving up.
“The Fed has basically created with their colleagues in Japan and at the European Central Bank (ECB) and the Bank of England (BOE), they’ve created a colossal asset bubble. And the returns going forward will be disappointing,” said Faber. “The composition of an index is that it’s usually capitalization weighted. So one stock that goes up vertically could theoretically drive up an index and 99 percent of the shares don’t make new highs.”“Some markets are still strong, but the bulk is no longer moving up so the advance of asset price inflation has been narrowing significantly,” Faber said.
also:
Dr Doom Calls Bubble, adding to Gloomy Calls
The Federal Reserve has inflated an asset bubble and that`s going to damp market returns, perma-bear Marc Faber, publisher of The Gloom, Boom and Doom Report, told CNBC Tuesday. “Say you`re a young person and you`re just starting to work. So take me in the 1970s. In the US, with 20 hours of work, I could buy the SandP 500. Now you need more than 90 hours of work to buy the SandP 500 if you`re young, with a medium income,” Faber told CNBC in an interview. “The Fed has basically created with their colleagues in Japan and at the European Central Bank (ECB) and the Bank of England (BOE), they`ve created a colossal asset bubble. And the returns going forward will be disappointing.”
related:
Faber: Markets Are Manipulated by Clowns in Central Banks

Crude oil has turned up in September when price broke out of a triangle placed in wave (b) so wave (c) was final with wave 4 pullback that reached 50.50 resistance from where sell-off occurred in October. As such, we suspect that WTI made a new swing now that will send price down into wave 5 back to 37.70. Broken corrective channel also suggests more weakness ahead,but after wave (ii) is complete.
Crude OIL, Daily

Crude Oil bounced sharply in the last few days, but so far only with three waves that made a reversal down yesterday from around trend line resistance and 61.8% Fibonacci level. That was ideal zone for a weakness, so ideally crude accomplished rally from 42.64 and that new weakness is now udnerway. If we are correct, then price will break beneath October lows.
Crude OIL, 4H

If you like our trading analysis, you can visit our website at –> www.ew-forecast.com
In the September 10 column entitled, “The bear makes a welcome return”, we discussed the return of the infamous bear image on the front cover of several news magazines and newspapers. The most conspicuous example of the bear could be seen on the front cover of Businessweek magazine, shown below.

From a contrarian’s perspective, this was a most welcome return for it strongly suggested that the bottom would soon be in for the stock market after the August decline. As I observed, “From a contrarian standpoint it doesn’t get any more emphatic than this.” Since then the major indices have rallied off their lows with some even making token new highs (e.g. the NASDAQ 100). I’ve never heard of a manifestation of the bear cover indicator failing to mark a decisive market bottom, and this time proved no exception.
Now that the Dow Industrials and the S&P 500 index have rallied back to the February-July resistance zones, should we expect a resumption of the selling pressure that plagued the market this summer? Or should we rather expect a period of consolidation (i.e. backing and filling) and eventually a breakout to new highs? As always, the answer to that question will be answered by the market itself but the current weight of evidence does provide us a meaningful clue as to the most likely outcome.
Before we look at the evidence, it’s worth making an observation about the previous sell-off. What happened to the stock market over the three days between August 20-24 qualified as a classic selling panic, as opposed to a fundamentally-driven crash or credit episode. This distinction is important, for if true it will make the difference between entering a bear market in 2016 and continuing with the bull market that began over six years ago.
A market panic is catalyzed by an adverse and extreme reaction to a news event. In the August sell-off it was the currency devaluation in China that panicked investors into selling. One thing that history consistently has shown is that true selling panics are usually retraced in short order once the fear subsides, i.e. usually within a couple of months. The less time it takes for the major indices to recover their losses, the less likely the selling was fundamentally driven. Hence, a true selling panic isn’t typically the precursor of an imminent bear market.
It’s also worth noting that the market’s present internal condition is virtually in complete contrast to what it was earlier this summer heading into the August panic. Prior to the summer swoon, the market’s extremely weak breadth could be seen on a daily basis for weeks on end. From June onward the number of NYSE stocks making new 52-week lows each day was extremely elevated and showed that the market wasn’t internally healthy. Moreover, this showed up in the NYSE internal momentum indicators (which are based on the new 52-week highs and lows). Most of those indicators were in decline as I mentioned earlier this summer.
Since the August bottom, the situation has reversed. The number of new 52-week lows has been drying up since September and have numbered less than 40 for most days since Oct. 5. The NYSE internal momentum indicators are now mostly in a rising pattern as opposed to the declining pattern before the August crash. Below is a chart showing the six major component of the Hi-Lo Momentum (HILMO) index. Only the longer-term component (orange line) is still in decline; the others are either rising or bottoming, in the case of the dominant interim indicator (blue line at bottom).

These indicators are very important because they show the stock market’s near-term path of least resistance. There is at least one fly still in the ointment, namely the longer-term internal momentum indicator which is still declining, as already mentioned. But all the other indicators – short-term and intermediate-term – are rising. This implies that the bulls currently have the advantage and that the heavy internal selling pressure which characterized the stock market this spring and summer is not an issue right now. This doesn’t preclude another (potentially sharp) pullback between now and year’s end, but the market’s main uptrend should remain intact.
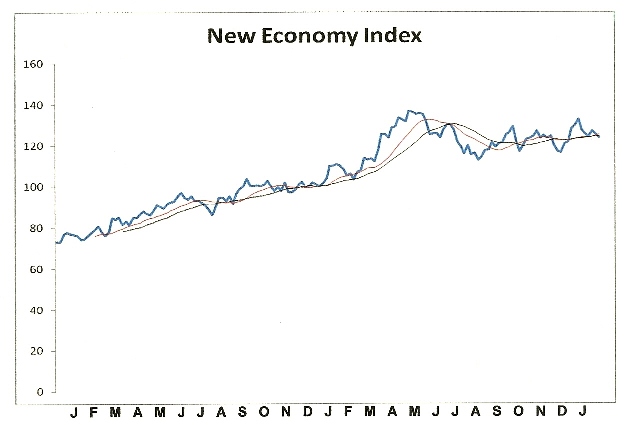
Also worth mentioning is that the New Economy Index (NEI), our in-house measure of how strong or weak U.S. retail spending is, hit a new all-time high last Friday, Oct. 30. Although business owners remain worried over growth prospects, mainly because of overseas woes, consumers don’t seem the least bit concerned. They just keep spending as the NEI chart suggests (below). What’s more, we’re about to enter the critical holiday season when retail sales typically hit their highest levels.
After a major decline in the stock market it always pays to monitor the sectors and industry groups for signs of relative strength. When, for example, the Dow Jones Industrial Average makes a series of lower lows during the final stage of a decline and certain individual stocks make higher lows, that’s a tip-off that informed buying is likely taking place. When the market turns up again and these individual stocks continue leading the market, that confirms it. At the bottom of the August panic, the industry groups which showed the greatest resilience to the decline were water, defense, and broadline retail stocks along with toy companies.
Among Dow Jones industries currently showing exceptional relative strength are: Broadline Retailers (DJUSRB), Business Training and Employment (DJUSBE), Consumer Finance (DJUSSF), Defense (DJUSDN), Leisure Goods (DJUSLE), Restaurants and Bars (DJUSRU), Software (DJUSSW), Toys (DJUSTY), and Water (DJUSWU). This group of industry leaders is very much in keeping with the bullish consumer spending patterns we’ve seen reflected in the New Economy Index lately.

There are, however, some industries that are conspicuous laggards which are close to their yearly lows. If these industry groups don’t improve soon it could pose a problem at some point in 2016. Not surprisingly, most of them are commodity and industry related and were heavily impacted by this year’s global economic slowdown. They aren’t likely to a pose a problem for the balance of 2015, however, especially if they remain within their 2-month holding patterns. They include: Aluminum (DJUSAL), Coal (DJUSCL), Healthcare Providers (DJUSHP), Mortgage Finance (DJUSMF), Pipelines (DJUSPL), Steel (DJUSST), Railroads (DJUSRR), and Recreational Products (DJUSRP).
If commodities can establish a bottom in the next couple of months, particularly crude oil, then the global economic woes of 2015 are far less likely to be of concern to the U.S. in 2016. Moreover, if the stimulus measures of the ECB and China continue the global economic slide will likely be halted next year.
Mastering Moving Averages
The moving average is one of the most versatile of all trading tools and should be a part of every investor’s arsenal. Far more than a simple trend line, it’s also a dynamic momentum indicator as well as a means of identifying support and resistance across variable time frames. It can also be used in place of an overbought/oversold oscillator when used in relationship to the price of the stock or ETF you’re trading in.
In my latest book, Mastering Moving Averages, I remove the mystique behind stock and ETF trading and reveal a simple and reliable system that allows retail traders to profit from both up and down moves in the market. The trading techniques discussed in the book have been carefully calibrated to match today’s fast-moving and sometimes volatile market envipolment. If you’re interested in moving average trading techniques, you’ll want to read this book.
Order today and receive an autographed copy along with a copy of the book, The Best Strategies for Momentum Traders. Your order also includes a FREE 1-month trial subscription to the Momentum Strategies Report newsletter:
http://www.clifdroke.com/books/masteringma.html
Clif Droke is a recognized authority on moving averages and internal momentum. He is the editor of the Momentum Strategies Report newsletter, published since 1997. He has also authored numerous books covering the fields of economics and financial market analysis. His latest book is Mastering Moving Averages. For more information visit www.clifdroke.com


-
I know Mike is a very solid investor and respect his opinions very much. So if he says pay attention to this or that - I will.
~ Dale G.
-
I've started managing my own investments so view Michael's site as a one-stop shop from which to get information and perspectives.
~ Dave E.
-
Michael offers easy reading, honest, common sense information that anyone can use in a practical manner.
~ der_al.
-
A sane voice in a scrambled investment world.
~ Ed R.
Inside Edge Pro Contributors

Greg Weldon

Josef Schachter

Tyler Bollhorn

Ryan Irvine

Paul Beattie

Martin Straith

Patrick Ceresna

Mark Leibovit

James Thorne

Victor Adair