
Timing & trends
Although the stock market has had several “shock and awe” straight up rallies this year, since the beginning of January the graph of the S&P 500 looks like the infamous “bridge to nowhere:” (click to enlarge)

Up until January, the S&P 500 had risen at a near-continuous 45-degree angle, punctuated with an occasional and very brief 1% sell-off. Every time the stock market attempted to correct, the Fed either rolled out another new QE program in some form or used its regional emissaries to soothe the computer algos and retail investor cattle with sweet nothings designed to jawbone the stock market higher. As you can see from the graph above, the one sell-off prior to this past summer was halted a by a Fed puppet’s call for more QE.
The big plunge that occurred in August was triggered by economic fears and the plunging price of oil, capped by concern about the Fed raising interest rates by one-quarter of one percent. And of course the Fed rolled out its emissaries to soothe the market and a decision to defer the one-quarter of one percent rate hike. What does it tell us that minuscule rate hike threat that looms like a nuclear bomb over the markets?…
The truth is, the markets are so disconnected from the underlying fundamentals that if the Fed were to pause for just a brief moment from its continuous market intervention, the stock market – along with the entire financial system – would collapse.
As you can see from the graph above, while the Fed – for now – has the ability to prevent the S&P 500 from a big sell-off, it’s been unable to push the S&P beyond the upper end of the sideways channel framed in red in the graph above. And now we find out that the club of inside-connected, highly regarded large hedge fund managers have been unloading their stock holdings into every rally – LINK.
Currently the S&P 500 is being propped up with five stocks – AMZN, GOOG, FB, MSFT and GE. Collectively these five stocks account for than 100% of the YTD return on S&P 500. I can’t speak knowledgeably to four of them, but you can find why AMZN is the largest public stock Ponzi scheme in the history of the U.S. stock market in this report: AMAZON dot CON. I have an interesting paired traded strategy that I’m working that reduces the risk/volatility of shorting AMZN outright and it will be made available to anyone who purchases the AMZN dot Con report.
Beneath the veneer of those five stocks, there’s a bona fide bear market going on in many sectors and individual stocks. We saw this most recently with several retail stocks which went into cliff-dive mode after releasing quarterly earnings. Some sectors of the market are down 20-50% this year.
Currently just about every possible economic indicator is telling us the economy in the U.S. is starting to collapse. This is one variable over which the manipulators have no control. The price of oil is about to drop into the $30’s and the price of copper is likely going to go below $2 soon. By all indicators, retail sales for the holiday season are setting up to be a disaster. The big retailers know this which is why “Black Friday” sales promotions have already started.
The housing and auto markets are next. The Fed and Government have once again over-stimulated demand for housing and new cars with subprime lending programs. Demand has been “pulled forward” and sales in both markets are rolling over.
I don’t know how much longer the Fed can hold up the stock market. At some point the gravitational force of the collapsing fundamentals will outweigh the Fed’s ability to keep a safety net under the stock market and a lid on the price of gold. I predict it will get a point in which you won’t be able to get out of the stock market (extended market holiday) and you will have trouble finding physical gold/silver to purchase except in the private market at exceptionally high premiums to the quoted spot price.

All this talk and turmoil and noise and movement and desire is outside of the veil; within the veil is silence and calm and rest. ~ Bayazid Al-Bistami
On the 19th of this month, two articles were published at the same time, one stating that oil could go to $26 and the other stating that oil is ready to trade to $80. Which one is it going to be, $26 or $80 and how is the average Joe going to be able to discern which one is a depiction of what lies ahead. This is the problem with today’s mass media, in their quest to attract eyeballs, bombastic and often conflicting articles are published simultaneously. One almost feels that most of the major sites have only one agenda, quantity over quality. The idea is to use emotions, Greed or Fear to trigger a reaction. Whether the data supporting the hypothesis is valid or not, appears to be irrelevant. Perhaps this is why more American drink coffee daily than invest in the markets.; over 50% of the public is still sitting on the sidelines.
Psychology is probably the simplest, most misunderstood and most underutilized tool when it comes to trading. The first rule of mass psychology dictates that one put aside one’s emotions. You have to cut the power of these useless forces. It is not easy, and it never becomes automatic. You have to fight it, but you know you are close to doing something right when you not overly confident about the decision you are going to make. The second factor is to get rid of the noise factor; use mass media as a source of entertainment or provide you information on what you should not be doing.
Having said, that, let’s us attempt to shed some light on what is going on. Let’s start off with the fundamentals; for the record we do not place too much emphasis on fundamentals. Fundamental data is presented in a standard format, so anyone with access to it can draw the same conclusion. Thus it negating the edge it is supposed to give an investor. However, if you combine that with Mass psychology and or technical analysis, the outcome improves considerably.
On the fundamental side, the IEA states that it expects oil to trade to $80 by 2020. The IEA also made the following statement.
“The IEA expects all the production in the United States to go down half a million barrels in next year – 500,000 barrels a day. I expect to go down a million barrels a day in 2016 and another million barrels in 2017,” he said. “On top of that, I see demand increasing by another 2 million barrels over the next 2 years. So that’s already a 4 million barrel swing over the next 22 months. That’s going to make a difference with oil prices.”
The IEA is notorious for painting a picture that in many instances bears no resemblance to reality. Fundamentals tend to give you a rear view look at what is going on. By the time, the fundamentals improve the market has moved and is trading well of its lows.
If we combine both those articles together, then we draw closer to the truth. We have been stating for some time that we expect crude oil to trade within a wide range, barring some unforeseen events such a full-fledged war in the Middle East. In fact, this is what we said to our subscribers recently.
Oil is expected to continuing trading in a wide range (33-60), but will face bouts of resistance at 50.00. Once oil manages a weekly close above 50, it will widen the range to 60-65 ranges. ~ Market Update, Nov 1st, 2015.

What’s next for Crude oil?
Crude came within striking distance of $50.00, trading as high as $48.36, before it pulled back. It looks set to test its lows again, with a possible overshoot, to the 32.00 ranges. The ideal set up would be for oil to put in a higher low or generate a positive divergence signal it drops to new lows.
From a technical perspective, oil needs a weekly close above 50.00 to indicate higher prices. A monthly close above 60 on a monthly basis will indicate that a test of $75.00 is in the works. We expect oil to trade in this range for the next several months unless the situation heats up in the Middle East.
The beleaguered gold-mining sector continues to be plagued by monumental universal bearishness. Nearly everyone assumes the gold miners are doomed, that they can’t survive for long in a sub-$1200-gold environment. But this belief is totally wrong, a consequence of extreme fear’s fog of war. The gold miners’ underlying earnings fundamentals remain very strong, as evidenced by their recent Q3 results.
In all the stock markets, corporate profits ultimately drive stock prices. Because a stock simply represents a fractional stake in its underlying company’s future earnings stream, all stock prices eventually revert to some reasonable multiple of those profits. These earnings are truly the only fundamental driver of stock prices. All deviations from righteous valuations based on profits are just the temporary products of herd sentiment.
The gold stocks are suffering such an extreme psychological anomaly today, drowning in mind-boggling depths of popular fear and despair. The leading HUI gold-stock index just slumped to a brutal new 13.3-year secular low this week! The apathy and hate for this sector is nothing short of astounding. Anyone masochistic enough to make a bullish contrarian case on gold stocks will be peppered with scathing ridicule.
But in the midst of any universal sentiment extreme, prudent investors and speculators must disconnect from the herd emotions to take a rational look at the underlying profits fundamentals. And there is zero doubt today that prevailing gold-stock prices are truly fundamentally absurd. The last time gold stocks were priced at these levels per the HUI ages ago in July 2002, the gold price was merely trading around $305.
Think about the wild incongruity of that. Profits drive stock prices, and profits in gold mining derive almost exclusively from the price of gold. This is because the mining costs for a particular deposit are essentially fixed in its mine-planning stages. So higher gold prices lead directly to higher profits, and this relationship is not linear. Gold miners naturally leverage gold’s moves, which can drive huge gains for investors.
This is easy to illustrate. In this year’s second quarter, the elite gold miners of the flagship GDX Gold Miners ETF reported average cash and all-in sustaining costs of $635 and $895 per ounce. The latter number can be rounded up to $900 for an industry average. Such costs mean if gold is trading around $1100, this industry earns $200 per ounce in profits. What happens when gold merely rallies 10% to $1210?
Since costs at individual gold mines are largely fixed regardless of the gold price, gold’s gains translate directly into higher earnings. A $1210 selling price less $900 costs yields new profits of $310 per ounce, a whopping 55% gain on a 10% gold rally! This strong inherent leverage to gold’s upside is the main reason investors buy gold stocks. And the riches brave contrarians have won in this sector have been vast.
Today’s gold-stocks-to-zero herd groupthink has deluded everyone into forgetting the gold stocks were the best-performing sector in all the stock markets between November 2010 and September 2011. The HUI skyrocketed 1664% higher during those 10.8 years, radically trouncing the benchmark S&P 500’s 14% loss over that same span. Buying gold stocks low when few others will can create life-changing wealth.
And gold stocks couldn’t be any lower than today, priced as if gold was near $305 instead of reflecting the real prevailing price of $1070. Imagine the rush to buy stocks in any other sector if its stock prices were battered to such extreme lows that they implied its products were selling for around just 3/11ths of their actual selling price. The epic fundamental disconnect that exists in gold stocks today is utterly ridiculous.
The best way to fight irrational emotion to buy low so you can later sell high and multiply your capital is through research. The more hard information you have, the more you can root your psyche in reality and steel yourself from the howling winds of herd sentiment. The only way to understand today’s actual real fundamentals of the gold-mining industry is to carefully study how these companies are performing.
With the gold miners’ third-quarter results almost all reported, this week I decided to dig deep into these latest fundamental reads to sharpen my understanding of this sector’s profitability as a whole. It’s not easy wading through dozens of quarterly reports, but the strategic understanding gleaned makes such an effort well worth it. I found the gold miners continue to have costs so low their operations are very profitable.
That flagship GDX gold-stock ETF is the definitive gold-stock trading vehicle, and contains the best of the world’s gold miners. As of this week, this ETF held 35 of this planet’s elite “gold stocks”. The quotes are because a handful of GDX’s components are actually silver miners. But there’s no better roster of the world’s leading and dominant gold miners than those winning the honor of being included in this GDX ETF.
This week I ran through the latest quarterly results from all of them, and built a spreadsheet with a bunch of fundamental data from each. These tables summarize some of the most important information. They include each GDX component company’s key cost data for Q3, their cash in the bank at the end of Q3, and their operating cash flows generated in Q3. If you are bearish on gold stocks, prepare to be amazed.
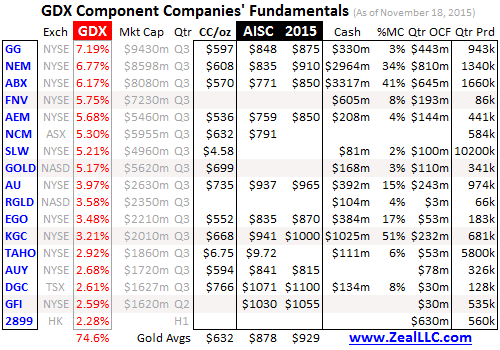
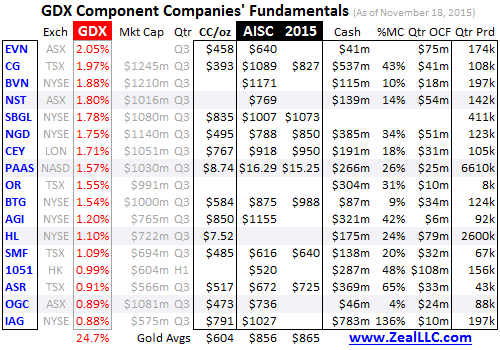
These tables fit in the top 34 of GDX’s 35 components, 99.2% of its total weighting. And once again they just shatter the popular myth today that the gold miners are doomed at these low prevailing gold prices. This entire industry is operating at both cash and all-in sustaining costs far below current gold levels! It is vastly more profitable today than it was over 13 years ago the last time gold stocks traded at these prices.
Among the world’s elite gold miners that reported cash costs in Q3, their average was way down at an incredibly-low $618 per ounce! That’s an amazing revelation that obliterates the common notion today that gold miners are in trouble under $1200 gold. Even if gold somehow plunged all the way down to $650, an absurd apocalyptic extreme even the most vociferous bears never dream of, gold miners can survive.
Cash costs are how much it actually costs to produce each ounce of gold on an ongoing basis, the costs that have to be covered to pay the bills. They don’t include things like exploration, building mines, and reclamation costs. Cash-cost levels are the ultimate acid test of gold-miner survivability. As long as gold remains above cash costs, miners can keep producing and maintain operations to await higher prices.
But the problem with cash costs is they don’t reflect the true costs of mining gold. Cash costs were all the gold miners reported in the 1990s and 2000s, and they were misleading to investors without a deep knowledge of this industry’s many idiosyncrasies. So back in early 2013 the World Gold Council, the gold miners’ self-funded industry group, worked on a new framework for more representative cost reporting.
This resulted in the far-superior all-in-sustaining-cost metric introduced in June 2013. These include all the direct cash costs of mining gold, as well as many other costs. That includes the general corporate-level administrative expenses not included in cash costs like mine-level ones are, as well as all costs required to maintain and replenish existing production levels. This is essential since mines are always depleting.
So all-in sustaining costs also include the exploration, mine-development, and construction expenses necessary to maintain gold output. They also include the required remediation and reclamation costs incurred after mines are economically depleted. So there’s no doubt that all-in sustaining costs are a much superior cost measure. So it’s best to consider gold-mining profitability from them, not just cash costs.
In their just-reported Q3, the world’s elite gold miners had average all-in sustaining costs of just $866 per ounce! That’s incredible, way below the false perception of gold-mining cost levels fostered by today’s suffocating herd bearishness. That means even at this week’s brutal new 5.8-year secular gold low of $1069, this industry is still earning profits of $203 per ounce! That 19% profit margin is pretty darned impressive.
Contrary to popular assumptions, the gold miners are not only very profitable at today’s low gold prices but would still earn plenty even at $950. These companies have worked very hard to reduce costs to cope with the current depressed gold prices, and have widely succeeded. The actual fundamentals of the gold-mining industry today conclusively prove that this sector has nothing to worry about above $900.
But while some gold miners are trading at cheap price-to-earnings ratios today, the majority aren’t. If this industry is really earning $200+ per ounce at today’s gold prices, why isn’t that reflected in the gold miners’ P/E ratios? The answer is simple. These low gold prices have forced most miners to write down the carrying value of their deposit and mine assets, resulting in large non-cash charges to accounting earnings.
When companies initially buy deposits and build mines, the costs incurred are put on their books as assets. But as gold prices drop, all deposits become less economical to mine. So the SEC’s accounting rules require companies to write down these assets to reflect prevailing values. These asset-impairment charges are costs that flow through the income statement. They have temporarily overwhelmed real earnings.
But gold-driven writedowns are not that important or relevant over the long term. They are non-cash, so they don’t represent current costs. They are something of an accounting fiction in the quarters in which they hit. And assets’ carrying values are seldom righteous anyway, since these values aren’t increased when gold prices rise. They can only be adjusted lower, not higher. And writedowns soon flush off of income statements.
Traditional trailing price-to-earnings ratios include the last four quarters’ accounting earnings per share. So once the big writedowns pass beyond the latest year, accounting earnings again reflect underlying operating profitability. So as recent impairment charges roll out of the EPS calculations, the gold miners’ headline P/E ratios will rapidly shift from nonexistent to reflecting anomalous fundamental undervaluation.
An alternate measure of gold-mining profitability that isn’t skewed by impairment charges is operating cash flows. Q3’s are listed above for these elite GDX companies. Not only were they all positive last quarter, but some were large relative to the companies’ market capitalizations. As long as businesses can generate positive cash flows from operations, and make any debt payments, they can keep operating indefinitely.
These very strong operating cash flows have led to huge cash hoards for many of the elite gold miners, which are also noted above. In many cases the cash on hand at these gold miners is really large compared to their market caps. Strong cash positions mean the gold miners can weather a low-gold-price storm for quite some time even if gold would somehow miraculously plunge below their core cash costs.
The third-quarter results of the world’s elite gold miners included in the flagship GDX gold-stock ETF are incredibly bullish. Contrary to groupthink bearish expectations that gold miners are teetering right on the edge of bankruptcy, they are thriving even at low prevailing gold prices! Their key all-in sustaining costs are far below current gold levels, so they are generating big operating cash flows to boost their large coffers.
And these miners’ strong fundamental positions are improving. My last iteration of this research using Q2’15 results showed average cash and all-in-sustaining costs for the elite GDX gold miners of $635 and $895. In just the single quarter of Q3, barely any time to change the course of such capital-intensive operations as gold mining, these fell another 2.6% and 3.3% to $618 and $866. The gold miners are strengthening!
With gold stocks languishing near such fundamentally-absurd prices relative to the metal that drives their profits, their upside from here is utterly vast. As I discussed in an essay last week digging into the core fundamental relationship between gold stocks and gold prices, the gold stocks are highly likely to at least quadruple from current levels. Contrarian investors are chomping at the bit to return, waiting on a key signal.
And that is gold, which has been savaged by extreme selling by American futures speculators following late October’s hawkish Fed surprise on December rate hikes. They’ve been dumping hyper-leveraged gold-futures contracts at extraordinary rates in recent weeks, both by liquidating existing long-side bets and adding new short-side ones. But the full sizes of these gold bets are finite, with speculators nearing limits.
Sooner or later, all the speculators brazen enough to sell gold into major secular lows will have done so. And that will lead to big gold-futures short covering, since those leveraged downside bets on gold have to be offset by buying long contracts to close them out. With speculators’ gold-futures shorts very high again following that hawkish Fed surprise, another major short-covering rally in gold is imminent.
And naturally as gold rallies, gold miners’ profits leverage to their metal will kick in with a vengeance. This industry’s profits growth as gold climbs will dwarf the gains in gold. That’s going to lead to sharply falling valuations as P/E ratios drop, attracting in legions of value investors. And considering the gold stocks are now ludicrously trading as if gold was near $300 rather than $1100, their upside from here is vast.
While contrarian investors and speculators are waiting for a decisive green light from gold to pour back into the radically-undervalued gold stocks, they fear the same thing futures speculators do. Everyone is worried Fed rate hikes will prove gold’s nemesis, forcing it to keep spiraling lower indefinitely. The idea is higher yields on other assets will make zero-yielding gold less attractive, retarding investment demand.
Fortunately, history proves the exact opposite! Gold investment demand actually flourishes during Fed-rate-hike cycles because they are so damaging to overvalued stock and bond markets. Since 1971, the Fed has executed 11 rate-hike cycles. Gold actually rallied in the majority, 6 of those. And during those 6 Fed-rate-hike cycles where gold rallied, its average gain during the exact cycle spans was an amazing +61.0%!
The Fed’s last rate-hike cycle ran from June 2004 to June 2006, where it hiked its federal-fund rate by a whopping 425 basis points through 17 consecutive hikes. Yet even though that more than quintupled the FFR, gold still soared 49.6% higher over that exact span! Fed rate hikes are no threat to gold with one important exception, when gold enters those rate-hike cycles trading near major secular highs.
In the other 5 Fed-rate-hike cycles since 1971 where gold fell, this metal was already high when the Fed started increasing rates. That certainly isn’t the case today, with gold languishing near major secular lows. And gold’s average loss during these rate-hike cycles where it entered high was just 13.9%, asymmetrically small compared to its rate-hike-cycle gains. Gold stocks have nothing to fear from rate hikes.
And today’s already-excellent gold-stock earnings fundamentals based on their low costs and robust operating cash flows will see incredible growth as gold mean reverts far higher as investment demand inevitably returns. Gold’s woes began in early 2013 with the radical distortions from the Fed’s wildly-unprecedented open-ended third quantitative-easing campaign. Normalization will restore those conditions.
Between 2010 and 2012 before the Fed’s stock-market levitation, the gold price averaged $1490 in those last normal years. In 2012 alone, it averaged $1669. Let’s round these to $1500 and $1650 to get an idea of the gold-mining industry’s profits growth as gold mean reverts to normal levels. At rounded all-in sustaining costs of $875, $1500 and $1650 gold would yield enormous profits of $625 and $775 per ounce.
These merely-average gold levels would generate staggering profits growth for this industry up around 215% and 290% for a gold bull on the order of just 40% to 55%! Such extreme earnings growth would fuel an enormous upleg in gold stocks even if they were reasonably valued today, but coming out of the prevalent fundamentally-absurd lows that upleg will have to be epic. This should greatly excite investors!
With the general stock markets very overvalued thanks to the Fed’s levitation in recent years, there isn’t much fundamental upside to be found. Yet gold stocks, because sentiment is so overwhelmingly and irrationally bearish against them, have vast potential. They can be played by going long the GDX gold-stock ETF of course, but that sector benchmark’s gains will be dwarfed by those in the best of the elite miners.
After having studied and traded this contrarian sector for 16 years, we can help you find these smaller fundamentally-superior gold miners. Buying them low now when few others are willing is the only way to be able to sell them high later when few others can, really multiplying your wealth. We’ve been aggressively buying the best of the elite gold and silver stocks in recent months, as detailed in our acclaimed newsletters.
We’ve long published a weekly for speculators and monthly for investors, drawing on our decades of exceptional experience, knowledge, wisdom, and ongoing research to explain what’s going on in the markets, why, and how to trade them with specific stocks. They offer a rare and exceedingly-valuable studied contrarian perspective on these central-bank-distorted markets. Subscribe today, and enjoy our 20%-off sale!
The bottom line is gold miners’ underlying earnings fundamentals remain strong today even with the low prevailing gold prices. The all-in sustaining costs of this sector’s elite miners are quite low, leading to profitable operations generating large cash flows filling corporate treasuries. This reality evident in the latest quarterly results is a stark contrast to perceptions that the gold miners’ stocks are circling the drain.
Sooner or later all stock prices ultimately reflect their underlying corporate profits, and gold stocks are no exception. The extreme and wildly-irrational fear that has pummeled this sector to fundamentally-absurd price levels can’t and won’t last. And once that breaks as gold mean reverts higher, smart contrarians are going to flood back into this dirt-cheap sector and drive gold stocks radically higher over the coming years.

A behind the scenes look at the multi- billion dollar investment industry. The stories fund managers world-wide would rather you didn’t see!
“If you are serious about investing and building wealth the video documentary series ‘How To Win The Losers Game” is a must see. It’s excellent.
After watching the video if you want to learn more about better low-cost, long-term, low-maintenance, diversified investment strategies, download our free guide “12 Essential Ideas For Building Wealth” by clicking on the banner at the top of this page.
Paul Philip, Financial Wealth Builders Securities
 Sub-Saharan Africa’s economies are experiencing the lowest growth rate in six years, the IMF announced in its twice-yearly Regional Economic Outlook report. The fund said sub-Saharan Africa’s economies would collectively grow by 3.75% this year. That represents a dramatic downward revision of two percentage points from the IMF’s prediction a year ago, Matina Stevis writes, and 0.75 percentage points off its most recent prediction in April.
“The strong growth momentum evident in the region in recent years has dissipated in quite a few cases,” the IMF said.
According to the IMF’s World Economic Outlook database, just four of the world’s 10 fastest-growing economies are in Africa now…. CLICK HERE for the complete article

-
I know Mike is a very solid investor and respect his opinions very much. So if he says pay attention to this or that - I will.
~ Dale G.
-
I've started managing my own investments so view Michael's site as a one-stop shop from which to get information and perspectives.
~ Dave E.
-
Michael offers easy reading, honest, common sense information that anyone can use in a practical manner.
~ der_al.
-
A sane voice in a scrambled investment world.
~ Ed R.
Inside Edge Pro Contributors

Greg Weldon

Josef Schachter

Tyler Bollhorn

Ryan Irvine

Paul Beattie

Martin Straith

Patrick Ceresna

Mark Leibovit

James Thorne

Victor Adair