
Real Estate
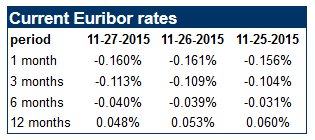
Get paid to have a mortgage!! I Spain anyone with a mortgage rate tied to 6-month or less European Euribor rate now gets paid to have a mortgage.


Consider this clipping from the August 1932 San Francisco Chronicle newspaper:
“Reduction of salaries of municipal employees and limitation of city positions to only one member of a household will be sought by (Supervisor) Adolph Uhl in two amendments to the San Francisco charter. The salary reductions would run from 2.5% for the lowest bracket to 25% on salaries of $500 a month or more.”
Thanks to the handy BLS Inflation Calculator we know that $500 a month in 1932 is the equivalent of $8,680 per month (about $104,000) a year.
Imagine the tempest of fury and outrage that would arise should this be proposed the next time local governments run short of funding. Nowadays, the calls would not be for sacrifices from the highly paid public servants but for tax increases of 25% to maintain public-servant wages and benefits while the private sector economy implodes.
This unwillingness to sacrifice for the greater good is now endemic. This is the result of two powerful social forces:
- The loss of any shared sense of purpose or social good worthy of sacrifice.
- The ascendancy of maximizing private gain by whatever means are availableas the primary purpose and goal of the Status Quo.
The dominance of maximizing private gain by whatever means are availableleaves the Status Quo brittle and fragile. Since everyone reckons any sacrifice should fall on someone else, the only possible result is disunity and bitter conflict over modest sacrifices that are too inconsequential to save the system from collapse.
Wishful thinking, mindless optimism and blind adherence to failed ideas also make the Status Quo brittle and fragile. As Michael Grant noted in his book The Fall of the Roman Empire:
There was no room at all, in these ways of thinking, for the novel, apocalyptic situation which had now arisen, a situation which needed solutions as radical as itself. (The Status Quo) attitude is a complacent acceptance of things as they are, without a single new idea.
This acceptance was accompanied by greatly excessive optimism about the present and future. Even when the end was only sixty years away, and the Empire was already crumbling fast, Rutilius continued to address the spirit of Rome with the same supreme assurance.
This blind adherence to the ideas of the past ranks high among the principal causes of the downfall of Rome. If you were sufficiently lulled by these traditional fictions, there was no call to take any practical first-aid measures at all.
A dependence on debt, low interest rates and financial legerdemain also render the Status Quo extremely fragile when the debt become unpayable and low interest rates no longer boost additional borrowing.
The wishful thinking is that we can borrow limitless sums ad leave the debt burden on our children and grandchildren with no consequences. But once the system is dependent on massive borrowing, it becomes acutely sensitive to default, as consumption collapses once consumers can no longer borrow to consume, and asset bubbles engorged by debt-assets (bonds, student loans, mortgages, subprime auto loans, etc.) burst.
Lest you think this implosion from a modest decline in debt and new borrowing is preposterous, please examine this chart of total credit: that tiny wobble in 2008 very nearly collapsed the entire global financial system.
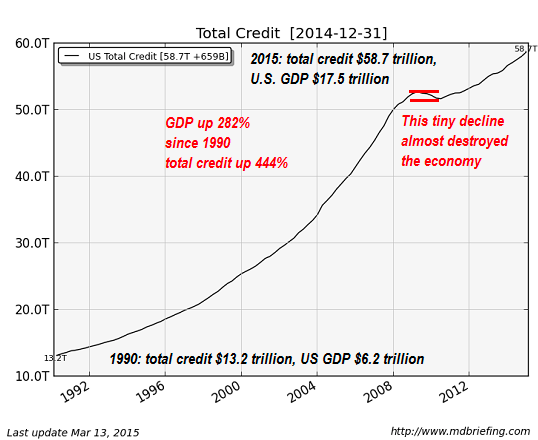
Any modest reduction in debt, tax revenues, consumption or new borrowing will bring the entire Status Quo crashing down. This is the bitter fruit of rampant financialization and the ascendancy of maximizing private gain by whatever means are available.
Regards,
Great sentiment charts. So much value in this information. Summary: Overall, fund managers’ asset allocations in September and October indicated the most bearishness since 2012. It was a strong contrarian bullish set up for equities, especially in the US (post).


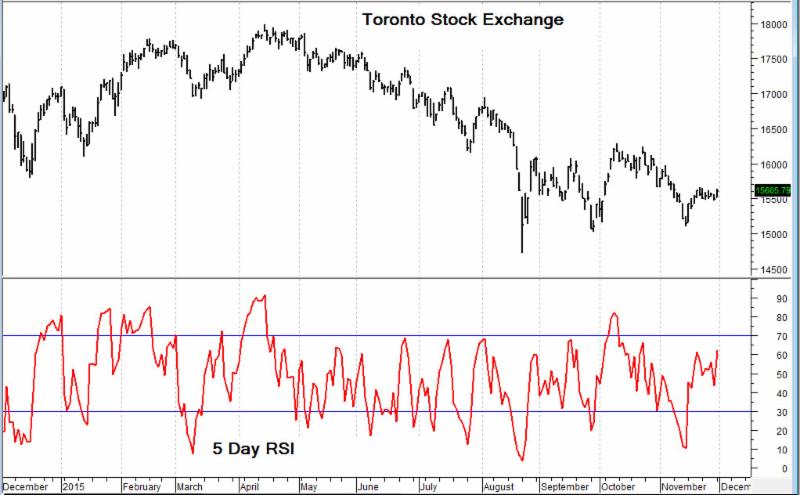
 The adage, “cash is king” could be a whole lot more appropriate in today’s market than in recent years. For equity investors, after a strong three and five year bull runs in Canada and the U.S. respectively, recent market volatility have caused a higher degree of uncertainty about keeping your entire nest-egg in the market.
The sentiment is understandable against the backdrop of recent events including the August 24th market “mini-crash” that Fortune Magazine referred to as “one of the biggest one-day declines in recent memory.” In one trading day, the market fell more than 1,000 points intraday.
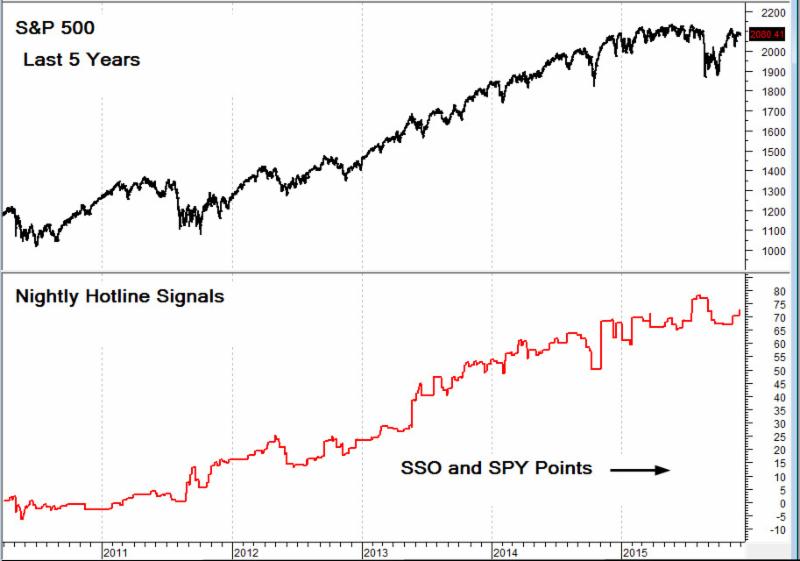
While the resource laden TSX Composite Index remains down significantly on the year, it is important to point out that in the U.S., the S&P 500 and Dow have already gained back all their losses from that short-term crash. The volatility is a concern, but there should be no panic in the streets.
Holding a portion of your overall portfolio in cash, with broader valuations relatively high and global growth a challenge, is prudent. But given the measly rates of return currently offered by “cash and cash equivalent” investments there are alternatives.
Before we get to one savvy alternative, we will scare you a bit by pointing out a few issues that could weigh on the markets in the near term.
QE3 has Gone the way of the Dodo bird
Last year, the Federal Reserve voted to end QE3, its bond-buying stimulus program. Throughout the stimulus program, the Fed pumped money into the economy, a huge portion of which flowed through the banks and into the stock market. This in turn drove up stock prices.
Many analysts believe this is the primary reason Wall Street has done so well since 2009 despite the fact that Main Street has suffered from very slow growth.
Without the stimulus program boosting the market, it could remain sluggish for a while. Having said this, while the U.S. is reigning in the taps, much of Europe and China are stepping up the stimulus.
Commodity Prices are low
This has been nowhere more apparent than in Canada. While the average Joe or Jane might enjoy a cut in the cost of commodities, this typically doesn’t bode well for investors (Canadian resource investors in particular) or the economy at large. Consider the price of oil, a “pillar of the global economy” according to many analysts, has fallen drastically in the past year. When the cost of oil rises, so do the costs of other commodities, due to its inflationary effect. The inverse is also true when oil prices fall. Subsequently so do the prices of countless other commodities. Stocks are a claim on real assets, so the market responds accordingly when commodity prices are down.
It’s not just about oil either. Gold, silver and platinum are now at five- to eight-year lows, as are basic materials, signaling the construction and industrial sectors are weak.
Of course, the fact that these commodities are all denominated in the surging U.S. dollar also has to be factored in.
Interest Rates Will Rise
Last year, the Feds promised to keep rates near 0% for a “considerable time,” but now it is becoming more and more likely that rates will rise sooner rather than later. This will cause a considerable strain on the market, since low rates encouraged stock market investments in the past.
What can you do?
First off, it is prudent to hold some of your investment portfolio in cash and cash equivalents at present.
However, you can also choose to own stocks which trade at reasonable valuations and are “Cash Rich.” Profitable stocks with huge net cash balances relative to their market capitalizations or the value investors assign to their business. They are the type of companies that can actually benefit, in the long term, from a market downturn as they are perfectly positioned to grow by cheap accretive acquisitions.
Look for our Annual Cash Rich Canadian Small-Cap Special Report
Starting with over 3,500 Canadian stocks, our research uncovers over 60 Small to-Micro Cap stocks – all profitable, cash rich (no debt) companies, many with between 10-100% of their market caps in cash. We drill down on each providing fundamental statistics and research notes from our management interviews and provide a select number of NEW BUY Reports and Flash Updates with current BUYS|SELL|HOLD ratings on all Cash Rich Stocks currently in coverage.
To compile this report, we included micro, small, and mid-cap stocks with an eye towards the lower end. Within this report, we strove to include companies with cash balances that exceeded (in most cases) 10-20% of their total market cap as a minimum. We also looked for current profitability or profitability within the last 12-months. Our bias was also towards debt free companies or those with cash balances that significantly exceeded long-term debt. Finally, we include brief research notes on each company from MD&A and management interviews.
The report has become an annual must read for growth and value investors and with 19 stocks receiving premium takeover bids, it serves as an excellent source of potential takeover targets. Unique research you can find nowhere else.
|
KeyStone’s Latest Reports Section 11/26/2015 |

-
I know Mike is a very solid investor and respect his opinions very much. So if he says pay attention to this or that - I will.
~ Dale G.
-
I've started managing my own investments so view Michael's site as a one-stop shop from which to get information and perspectives.
~ Dave E.
-
Michael offers easy reading, honest, common sense information that anyone can use in a practical manner.
~ der_al.
-
A sane voice in a scrambled investment world.
~ Ed R.
Inside Edge Pro Contributors

Greg Weldon

Josef Schachter

Tyler Bollhorn

Ryan Irvine

Paul Beattie

Martin Straith

Patrick Ceresna

Mark Leibovit

James Thorne

Victor Adair