
Stocks & Equities
|
A wise man is he who does not grieve for the thing which he has not, but rejoices for those which he has. |
Much the same way many experts felt that the NYSE was issuing a series of death signals, there are just as many who share the same sentiment towards the signals the Global BBC 30 Index is supposedly issuing. This index is thought to provide a more accurate reflection of what is going on in the markets as it is based on the economic data of 30 of the world’s largest companies. In today’s world where manipulation is the order of the day, over-reliance on such an index might not be the most prudent of actions. It has, however, confirmed that volatility levels have surged to the moon, but of course, we already knew this would occur as this was predicted well in advance by the Market volatility indicator (V-indicator).
Let us examine the situation from a mass psychology perspective before we go into the technical outlook. Overall the world expects things to get worse. Commodities prices are in the toilet, salaries when inflation is factored in have been flat or dropping for decades. In fact, one estimate states that over 75% of Americans are living pay check to pay check; according to this article, the actual figure is 76%. Overall the world is in a pessimistic mood, and it’s during such times that opportunity comes knocking.
The global BBC 30 index is not indicating an imminent market breakdown; instead, it is showing us that the world has changed. This index is not going to trend in unison with all the markets, for it is not representative of one single nation.
There are three ways to look at any given situation. The two the masses are trained to follow and adopt are:
- The glass is half empty which signifies that you are negative
- The glass is half full which illustrates that you are an optimist.
Our opinion on this retarded form of psychology is that it’s utter rubbish, for neither one is correct. The only question that should ever pop into the mind of a rational being is “Am I thirsty or not” if you are thirsty then you reach out and take a sip. If you are not thirsty, you move on and continue with your daily routine.
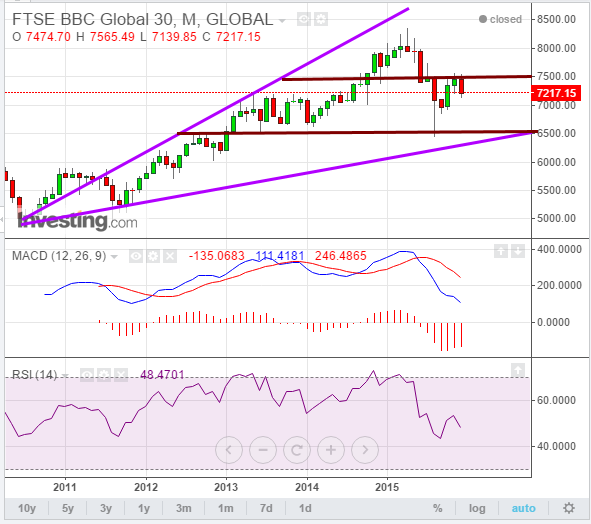
In that sense taking a look at the above chart, what is the only question that should come to mind?
Is the trend up? And the answer would be yes, and as the index has been trending upwards for the past five years, every pullback should be seen as a buying opportunity.
The MACD’s are still not trading into the extremely oversold ranges, so further consolidation is warranted, and as the economy of some nations is weaker than the others, this index cannot be asked to keep pace with indices such as the Dow and NASDAQ. There is a small chance that it could test 6500 ranges again though the mostprobable course of action is for it to put in a higher lower. The ideal scenario would call for a drop to the 6800 ranges and then a move to the 8000 ranges. Once it closes above 8375 on a monthly basis, it will provide the setup for a test of the 9000-9100 levels. Much like they were wrong with their proclamations of doom for the NYSE, the doctors of doom are doomed to share the same experience with the Global BBC 30 index.
A great fortune in the hands of a fool is a great misfortune.
Anonymous

I would like to tell you about a proprietary indicator that I use in the precious metals market. Take a look at the chart below which shows the indicator against the price of silver (in green) since 1967.

The graph shows the leverage that silver achieved over gold over a rolling four-year basis. I have addressed the subject of the gold-silver leverage ratio in previous articles, but this indicator uses a different approach to calculating the relationship between gold and silver prices. Note that this chart peaks on various major occasions in the last 48 years…..continue reading HERE

Something very interesting is unfolding. Included in the new year-end spending bill was a waiver of the Foreign Investment in Real Property Tax Act (FIRPTA), which had been implemented during the late 1980s when the Japanese were buying everything. They claimed to have focused on buying U.S. farmland, but it also applied to buying trophy U.S. property like Rockefeller Center in New York City.
This position has been reversed in the new year-end spending package. While some attribute this to a grand conspiracy, giving far more credit to those in Congress and in the White House than they deserve, our sources simply tell the plain story of lobbying to allow foreign buyers, who are supporting the real estate market in key areas, to purchase properties. Especially after London basically kicked every foreigner out of town by telling them their money was not welcomed, and with lightning speed they instantly turned to New York City..…continue reading HERE
 Warren Buffett is arguably the greatest investor any of has ever seen in our lifetime, which leads to the question, why don’t we just do what he does? It might not be possible to do exactly as he does because of our limited financial resources, but at the very least we can follow his teachings and apply them to our own portfolios.
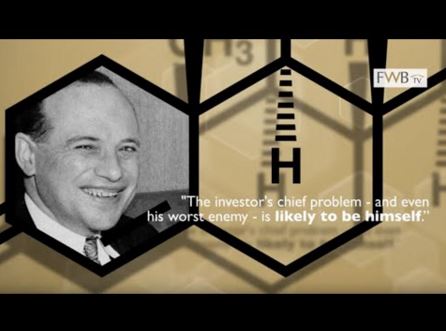
Warren has been quoted as saying, “Where others are greedy I am fearful and where others are fearful I am greedy.” He recognizes that during times of heightened emotions, when markets are dropping or increasing at accelerated paces, that the investors’ emotions are higher than normal and this tends to lead to irrational decision making. Warren’s own investment mentor, Benjamin Graham, was himself quoted a saying “The investor’s chief problem – and his worst enemy – is likely be himself”… CLICK HERE to watch the complete video
The Evidence-Based Investor Video series is a service provided by Paul Philip and the team at Financial Wealth Builders Securities


-
I know Mike is a very solid investor and respect his opinions very much. So if he says pay attention to this or that - I will.
~ Dale G.
-
I've started managing my own investments so view Michael's site as a one-stop shop from which to get information and perspectives.
~ Dave E.
-
Michael offers easy reading, honest, common sense information that anyone can use in a practical manner.
~ der_al.
-
A sane voice in a scrambled investment world.
~ Ed R.
Inside Edge Pro Contributors

Greg Weldon

Josef Schachter

Tyler Bollhorn

Ryan Irvine

Paul Beattie

Martin Straith

Patrick Ceresna

Mark Leibovit

James Thorne

Victor Adair