We believe the Credit Cycle has turned and with it will come some massive unexpected shocks. One of these will be the fall out in the Bond Market, centered around the dramatic growth explosion in Bond ETFs coupled with the post financial crisis regulatory changes that effectively removed banks from making markets in corporate bonds. It is a ‘Witch’s Brew’ with a flattening yield curve bringing it to a boil.
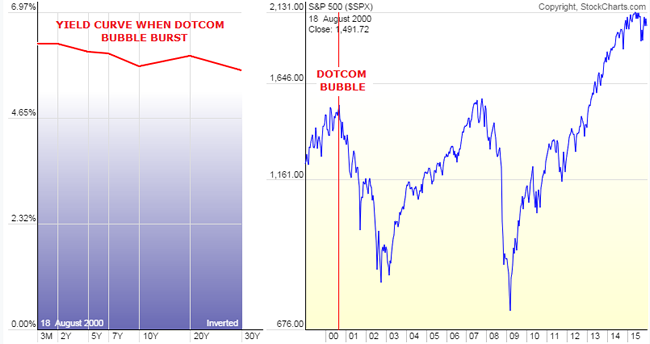
2000 – Flat to Inverted Yield Curve
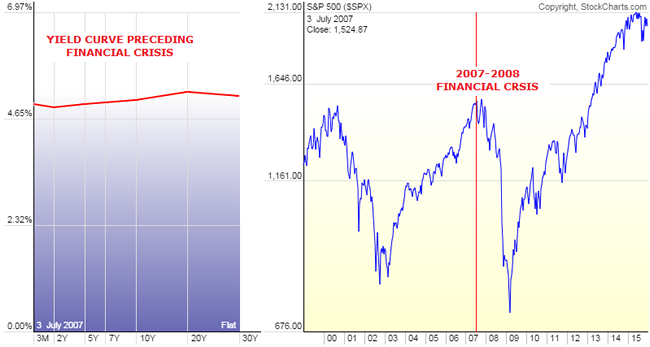
2007 – Flat Yield Curve
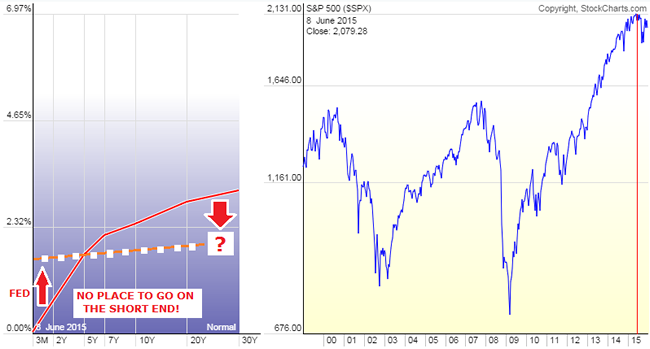
TODAY – Signalling a Flattening at Seriously Lower Bound!
PRESSURES FLATTENING THE YIELD CURVE
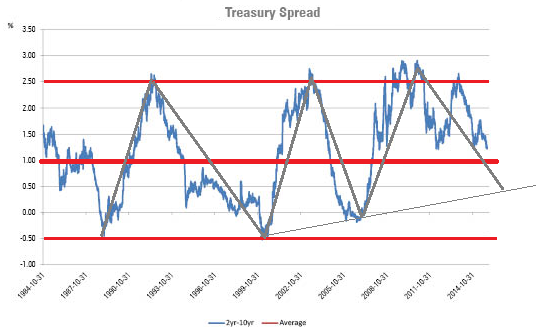
In the last six weeks, the spread between the Ten Year and the Two year treasuries has flattened exactly 25 basis points, which is EXACTLY the same amount that the Fed just moved the Fed Funds target rate this past Wednesday. With investors starved for yield many are being forced further out on the yield curve taking rates down further and pushing prices up.
Dan Norcini at http://traderdan.com lays it out pretty clearly:
This horrific predicament, compliments of our masters at the Central Banks, is forcing money to chase yield meaning that it is going further out along the curve to the long end. The more money that enters any bond market, the LOWER yields go since bond prices move inversely to the yield. When demand for anything increases, its price rises. Bonds, bills, notes, are no exception. As the money flows increase into the long end of the curve, at a faster rate than the money flows might be increasing into the shorter end of the curve, the price of the longer dated bonds rises faster than the price of the shorter dated bonds ( bills, notes,. etc). That means a flattening curve.
Secondly, and something that is extremely relevant to what is going on here – FOREIGN INVESTORS are sending monies overseas to chase yield as well. Think of where interest rates are in both Japan and in the Eurozone compared to comparable dated government debt here in the US. Those foreign flows do two things. They boost the price of the longer dated Treasuries as well as boosting demand for US Dollars.
This phenomenon tends to support both the Dollar’s value on the foreign exchange markets as well as keeping prices for those longer dated Treasuries well supported. Again, bond prices move inversely to yields thus the more money flows into the longer dated treasuries, the more those yields tend to move lower.
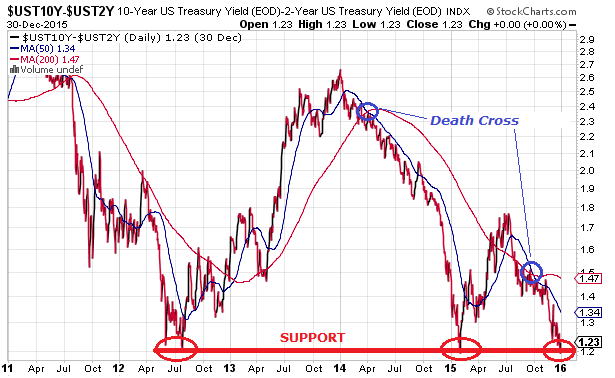
Look at what the result of both of these above factors have done to the yield on the Ten Year Treasury. Its yield was 2.170% on the last day of 2014. Today, its yield is 2.19%. We are only a short two weeks away from ending this year and we are basically back to where we started this year. We have essentially gone nowhere on yields.
What is perhaps even more alarming is that the curve is flattening further. The low point on this spread occurred in early February of this year when it reached 1.19%. Today, it closed at 1.22%. We are talking about a mere 3 basis points from the curve having flattened to a 2015 low!
Clearly, this is NOT A VOTE FOR STRONG ECONOMIC GROWTH laying ahead.
Perhaps this is the reason that the equity markets are beginning to show signs of wobbling.
What some analysts have been saying is that once the Fed started to raise rates, the stock market would come under pressure because the move would be a signal that the Fed has begun the process to slowly drain the liquidity that has fueled its monster seven year rally. I personally take issue with that in the sense that the Fed has not made any move towards actually reducing liquidity that I am aware of. After all, while they did increase the short term target rate by 1/4%, one can hardly say that the interest rate environment is not accommodative. Furthermore, the size of its balance sheet remains the same as it has been in some time nor have I seen any talk coming from the Fed that it intends to reduce that balance sheet.
Here is a chart of the Fed Balance Sheet beginning in October of 2013 ( I chose this month at random). Notice how constant the line has remained over the last year. As you can see, there has been no shrinking of the Balance sheet.
What I think appears to be causing concerns in the stock market is the fact that the yield curve is signaling that economic growth is not going to be increasing. That has gotten some stock investors nervous that perhaps stocks are overvalued. After all, it is hard to make the case that the equity markets should be hitting new lifetime highs when the yield curve is collapsing.
THE “WITCH’S BREW”
Many Including Morningstar Have Hyped “The Great New Yield Opportunity”
Thanks yet again to innovation in the realm of exchange-traded funds, the walls have come down and individual investors now have efficient access to tools that enable them to implement a strategy that only the big boys on the block could implement. Without the benefit of such scale and low relative trading costs, the cost hurdle was far too high for most individual investors and advisors trying to implement this strategy using individual bonds.
Then came along a new breed of fixed-income fund that combines the diversification and accessibility of an ETF with the precision of an individual bond. While an index, for example, typically maintains a fairly stable maturity range, these ETFs have specified maturity dates upon which cash is distributed back to investors. That means, just like an individual bond, the duration of these ETFs will steadily decrease as it approaches maturity.
…..
These ETFs are typically pitched as a way to build bond ladders in order to match cash flows with future liabilities. But thanks to their precise exposure and individual bondlike characteristics, defined-maturity ETFs–which are relatively cheap to trade–are also great tools for executing customized “roll down” strategies to enhance fixed-income total returns.
Even for relatively large investors, the wide bid-ask spreads and dealer mark-ups or commissions incurred when buying and selling individual bonds present a high hurdle. Moreover, the minimum investment that would be required could be another barrier to entry. Often, investors will be dealing in “odd lots,” which typically trade at wider spreads, as they are considered less liquid.
One of the attractive traits of an individual bond is the visibility of its cash flows and knowing exactly how much principal is due to you at maturity. Contrast that against a bond index, which does not mature and will see slight variations in its cash flows as it rebalances or reconstitutes over time. In the case of an actively managed portfolio, the payout will fluctuate as the portfolio manager buys and sells bonds. While there are several ETFs that target a relatively narrow portion of the yield curve, they still lack the precision and flexibility of defined-maturity bond ETFs.
This is another example of ETFs democratizing the investment landscape. Armed with these innovative solutions, investors have yet another arrow in their quivers to manage their fixed-income allocation amid a low-interest-rate environment. Be sure to monitor the steepness of the yield curve when executing the strategy, and keep in mind that the “roll down” strategy will lose a lot of steam if the yield curve flattens more than expected. As great as it sounds on paper, this strategy is still not a free lunch. The buy-and-hold investor sees price volatility steadily decease as his bond nears maturity. However, the price volatility in the “roll down” strategy stays relatively high, given that it reinvests in longer maturities, which tend to experience larger price fluctuations. The premium earned via the strategy can be considered compensation for assuming slightly longer duration and higher levels of volatility.
What has been sold to many investors, speculators and even desperate Fund Managers is using Bond ETFs to play the old “Roll Down the Yield Curve” Strategy. Here is how it works in case you are not familiar with the strategy.
ROLLING DOWN THE YIELD CURVE
The strategy of “rolling down the yield curve” targets investing in bonds at the steepest part of the curve. After a year or two, the bond is sold and the proceeds are reinvested back up the curve into higher-yielding, longer-maturity bonds. By selling the position well ahead of the actual maturity date, the strategy aims to capture the price increase that results when a bond’s yield drops as it “rolls down” the curve (that is, it moves closer to maturity). From there, the process repeats.
To illustrate, we can look at an example based on the yield curve in Exhibit 1. Consider an investor who buys a five-year Treasury paying a 1.5% coupon rate at par value. Fast forward two years, and that original five-year Treasury still yields 1.5%, but at that point it would have three years left to maturity. As can be seen in the yield-curve chart, the Treasury yield at a three-year maturity is 1.05%. Therefore, the price of the originally purchased five-year Treasury (which now also has a maturity of three years) would increase in order to ensure that its yield to maturity aligns with the current yield curve. (Note that, for the sake of simplicity, this example assumes that the yield curve remains stable over the observation period.)
If the Treasury paid a 1.5% coupon at a face value of $100, then after two years the price would have actually risen to $101.35 so that its yield to maturity matches the prevailing market. Recall that the three-year Treasury has a coupon yield of 1.05%. The original five-year Treasury in this example maintains its annual coupon yield of 1.5%, but then faces annual price declines of about $0.45 over the remaining three years until it matures. The yield to maturity balances out to 1.05% after factoring in those future price declines, which of course is equivalent to the yield to maturity that an investor could earn at that time from buying a newly issued three-year Treasury at par.
A buy-and-hold investor who bought at $100 would collect 1.5% per year in coupon payments and receive $100 at maturity. That comes out to a total of $7.50 in interest payments. The “roll down” strategy described in our example, on the other hand, could generate $10.90 in total returns during the same period thanks to locking in price gains and reinvesting into higher-yielding bonds.
YRA HARRIS WARNS “ALL HELL MAY BREAK LOOSE!”
Legendary trader Yra Harris who we recently interviewed at the Financial Repression Authority has been pounding the table for some time but just issued this warning:
The flattening of the yield curves in 2016 may lead to all hell breaking loose. WHAT DID I MEAN BY THIS? Grab a glass of scotch or Chuckie B., or some medicinal California and think about what I am going to say. (And, to paraphrase Danny Devito in the War of the Roses, when a person who charges $5,000 an hour offers free advice you might want to listen [humor intended].) In July 2012–the 24th to be exact–the U.S. 2/10 curve was flattening when it appeared that Europe was in a deep crisis. The two-year yields on EU sovereign debt were rapidly rising as the market feared about the viability of the EU and the EURO currency.
The European 2/10 curves were also flattening and when ECB President Mario Draghi issued his famous, NO TABOOS AND WE WILL DO WHATEVER IT TAKES to preserve the EU and the euro, the two-year yields began dropping and the 2/10 curves reversed course and began to steepen. The July 24 low was 117.25 positive slope. This was also the low made in January 2015 when the ECB and the SNB were busy revealing their plans about the EUR/CHF peg and the ECB‘s new QE policy (again, 117.25). As the year comes to an end, the flattening of the U.S. 2/10 curve continues and today we made an intraday low of 119.80. Now I will warn again that because of the lack of liquidity the last few weeks of the year prices can be easily manipulated and/or distorted.
BUT IF THE MARKETS RESUME FLATTENING IN RESPONSE TO GLOBAL ECONOMIC WEAKNESS AMID CHINESE SLOWING OR SOME GEO-POLITICAL EVENT ALL HELL WILL BREAK LOOSE. WHY? Last time the yield curves dramatically flattened in 2007 or 2012 in Europe the central banks, like John Mayall, HAD ROOM TO MOVE. When the U.S. curve inverted in early 2007, the rate was at 5.25% so the FED could swiftly cut rates in response to an incipient crisis. In Europe,the yields on the two-year notes of the so-called PIIGS were more than 7.0% and thus a dramatic drop in rates could be a positive signal to the markets.
WITH INTEREST RATES AT ZERO IN ALL THE DEVELOPED ECONOMIES WHAT WILL THE KEY POLICY MAKERS DO? A FLATTENING CURVE AT THIS JUNCTURE WOULD PUSH THE FED INTO NEW TERRITORY AND PUT FEAR INTO THE MARKETS.Thus, “ALL HELL WILL BREAK LOOSE” is an inference that the flattening of the curve at the zero bound will signal that the central banks have lost “control.” Will it be on the first close below 117.25? Most probably not but it is certainly an area for investors and traders to be very aware of. That was my point and it needed explanation beyond the allotted time of the Santelli spot. I await any questions or responses.
CONCLUSION
What Yra doesn’t say is we now have $2.2 Trillion of troubled High Yield bonds peddled to yield starved investors since the financial crisis, which matches 2/3’s of the $3.5 Trillion increase in the Federal Reserves balance sheet during the same period. Additionally, there are well north of $60 Trillion of Bond ETFs out there with anyone guess on how many fast money speculators are playing the “Rolling Down the Yield Curve” Strategy now up against the warning Morningstar so clearly disclaimed: “the roll down strategy will lose a lot of steam if the yield curve flattens more than expected.”
With serious liquidity issues clearly evident it should be interesting as a potential positioning scramble ensues. It somewhat reminds me of someone potentially shouting “FIRE” in a theater, except this times the theater doors will be barred and the only way out will be to have someone outside take your seat inside! ETF holders may find it easier to sell that old bridge over the East River in Brooklyn than get their money out of their ETFs.
Maybe what we will actually soon hear is someone shouting “CUSTODIAL RISK!”
http://financialrepressionauthority.com/

 Summary
 “What are they going to do with the money printing? Where do we go from here?”
 On January 1st, Londoners woke up to a rather perplexing reality: all of the cashless Oyster card readers on the city’s buses, rail and tube stations had stopped working. With cash as good as banished from the London transport system, attendants had little choice but to wave passengers through open ticket barriers and onto buses without paying, until the problem was fixed.


