
Timing & trends
 2015 was a year where nearly every asset class failed to provide any returns at all. If fact, the S&P 500 hasn’t gone anywhere in about the past 400 days. An analysis of that Index’s performance at the end of the 3rd quarter by S&P Capital IQ showed that over 250 stocks were down more than 20% from their 2015 highs and 25% of the S&P 500 Index had plummeted more than 30%.
The 30-year Treasury bond has fallen over 2.0%, cash in money market accounts have returned just +0.11% (so after taxes and inflation your return was solidly negative), and the CRB index is down nearly 25%.
So what should investors do with their money when nothing is working? Before I get to that I want to very briefly explain why nothing has worked for so long. The global economy has become debt disabled and market prices have been massively distorted by governments and central banks. The Free market has been eviscerated and supplanted by money printing and deficit spending on an unprecedented scale. The bottom line is that there is now a historic and humongous gap between stock prices and economic fundamentals. And a gigantic gap between fixed income yields in relation to the underlying credit quality.
Evidence of the crumbling economic foundation can be found everywhere you look.
The US manufacturing sector is now clearly in a recession. The latest confirmation of this came from the Dallas Fed survey, which was announced this past Monday, showing a drop of -20.1. Commodity prices, junk bond spreads and money supply growth all indicate the global economy is not only weakening but approaching the Great Recession levels realized in early 2009. After all, investors would have to believe that commodity prices, taken in aggregate, which are trading at prices reached during the nadir of the Great Recession, say nothing about global demand in order to maintain the economy isn’t in serious trouble.
So here are a few of my predictions and trading strategies for next year:
-
The S&P 500 falls more than 20% as it finally succumbs to the incipient global recession
-
Janet Yellen states in the 1st half of 2016 that the Fed will not increase the Fed Funds Rate any further and hints at another round of QE before year’s end.
-
The inability to normalize interest rates is taken as a tacit admission by the Fed that it has utterly failed to save the economy from the Great Recession, and as a result the US Dollar crashes below 90 on the DXY.
-
Gold and the miners will be the major winners next year as they will be the primary beneficiary from continued low nominal interest rates, negative real interest rates and a watershed turn in the value of the USD–the yellow metal reaches a high of $1,250 next year.
-
The Ten-year Note yield falls below 2% by June on pervading recession concerns.
-
Continue to short high-yield debt and own put options on high-flying NASDAQ momentum stocks that are trading at monstrous PE ratios and whose prices should collapse given a deceleration in the US economy.
-
Finally, after the dust settles from this anticipated huge selloff, there will be a tremendous opportunity from owning high-divided paying foreign stocks, which have already been mercilessly beaten down during the commodity bear market of the last few years.
Why will 2016 bring about the long overdue equity bear market? It is not just because the Fed has finally started to raise interest rates and will continue to slowly do so until the US economic recession fully manifests. But also the catalyst for this imminent recession is that debt levels and asset prices have increased to a level that can no longer be supported by incomes and underlying economic growth. Any additional increase in the cost of money will only expedite and exacerbate this condition. Q4 2015 GDP growth is predicted to post a reading that is barely above 1%, according to the Atlanta Fed model. Therefore, we don’t have much room left below before the economy enters contraction mode; and the trend is solidly in that direction.
I cannot stress how important this watershed change in US monetary policy will be for markets in early 2016. The major markets (meaning currencies, bonds and equities) have been anticipating a graceful exit from QE and the trillions of dollars’ worth of deficit spending that have been deployed since 2008. In other words, global capital markets have been banking on the success of central banks. In the vanguard of this belief has been the universal carry trade of going long the US dollar and equities, while shorting precious metals.
I believe in realities not fantasies. I’m betting that you cannot solve the debt crisis evident during the Great Recession by taking on a record amount of debt. And that you cannot fix the asset bubbles evident during the Great Recession by artificially pushing them to record high prices through QE and ZIRP. It is this reality that will take its vengeance in 2016. And it is the unraveling of this delusion that is the basis of Pento Portfolio Strategies’ investment model and is the opportunity we are prepared to profit from.

 In 1981, I was out on New Year’s Eve with a very good friend of mine, when the topic of setting goals came up in the conversation. Being New Year’s Eve, it was inevitable that we would reflect upon the previous year and start thinking ahead to what we planned to achieve in the next year. We quickly came up with our goals for 1982, and literally scribbled them down on the back of a napkin at the bar. It was the first time I had set annual goals, and have not stopped since.

Forex Trading Alert originally sent to subscribers on January 5, 2016, 7:47 AM.
Earlier today, official data showed that the annual rate of inflation in the euro zone increased by 0.2% in Dec, missing forecasts for an increase of 0.3%. Additionally, core inflation (without food and energy costs) rose 0.9% in the previous month, also below forecasts for 1.0%. Thanks to these disappointing numbers, EUR/USD extended losses and broke below important support zone. How low could the exchange rate go in the coming days?
In our opinion the following forex trading positions are justified – summary:
- EUR/USD: short (stop-loss order at 1.1363; initial downside target at 1.0462)
- GBP/USD: none
- USD/JPY: none
- USD/CAD: none
- USD/CHF: none
- AUD/USD: none
EUR/USD
Quoting our yesterday’s alert:
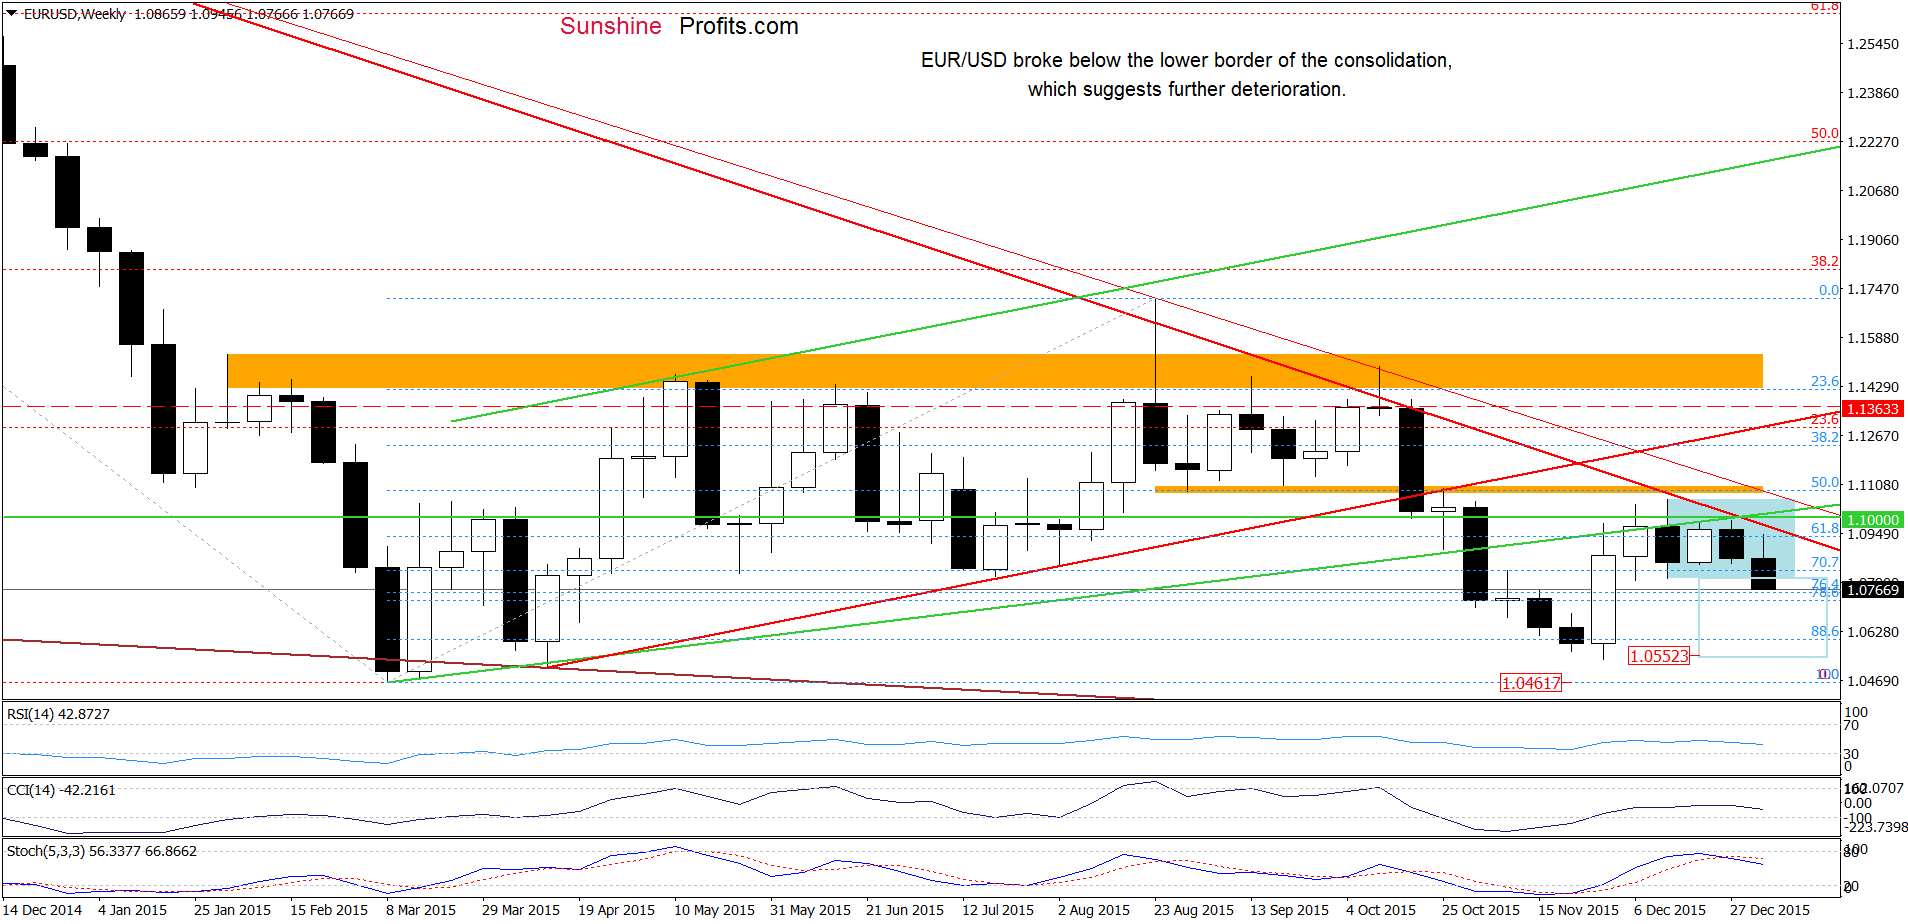
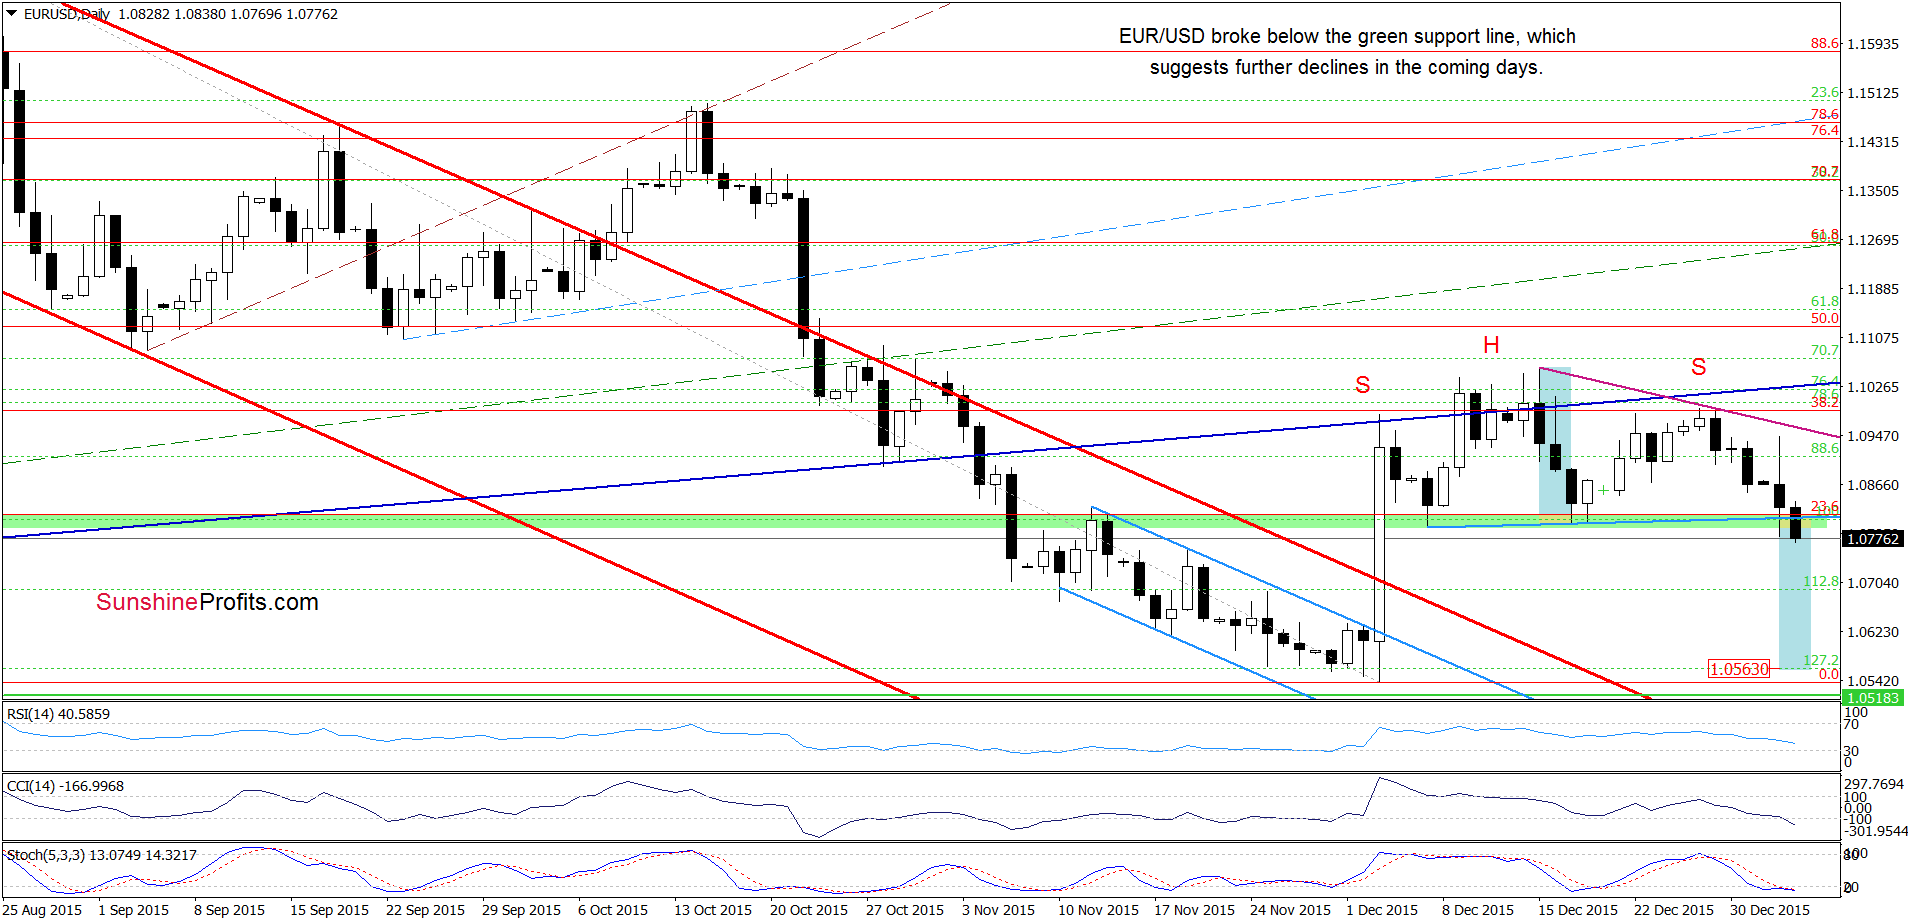
(…) the exchange rate is consolidating under the solid resistance zone (created by the previously-broken green resistance line, the barrier of 1.1000, the orange resistance zone and the long-term red declining resistance line). In previous weeks, this area was strong enough to stop currency bulls and trigger pullbacks, which suggests that we’ll likely see similar price action in near future. If this is the case, and the pair breaks under the lower line of the formation, the initial downside target would be around 1.0552, where the size of the downward move will correspond to the height of the consolidation (please note that slightly below this price target is the Nov low, which serves as the nearest medium-term support).
Looking at the weekly chart, we see that the situation developed in tune with the above scenario and EUR/USD broke below the lower border of the consolidation. With this move, the pair also declined under the green support zone (marked on the daily char), which means that the head and shoulders pattern is underway and a drop to around 1.0563 is more likely than not (in this area the size of the move will correspond to the height of the bearish pattern).
Very short-term outlook: bearish
Short-term outlook: bearish
MT outlook: bearish
LT outlook: mixed
Trading position (short-term; our opinion): Short positions (with a stop-loss order at 1.1363 and the initial downside target at 1.0462) are justified from the risk/reward perspective. We will keep you informed should anything change, or should we see a confirmation/invalidation of the above.
USD/CHF
In our previous commentary on this currency pair, we wrote:
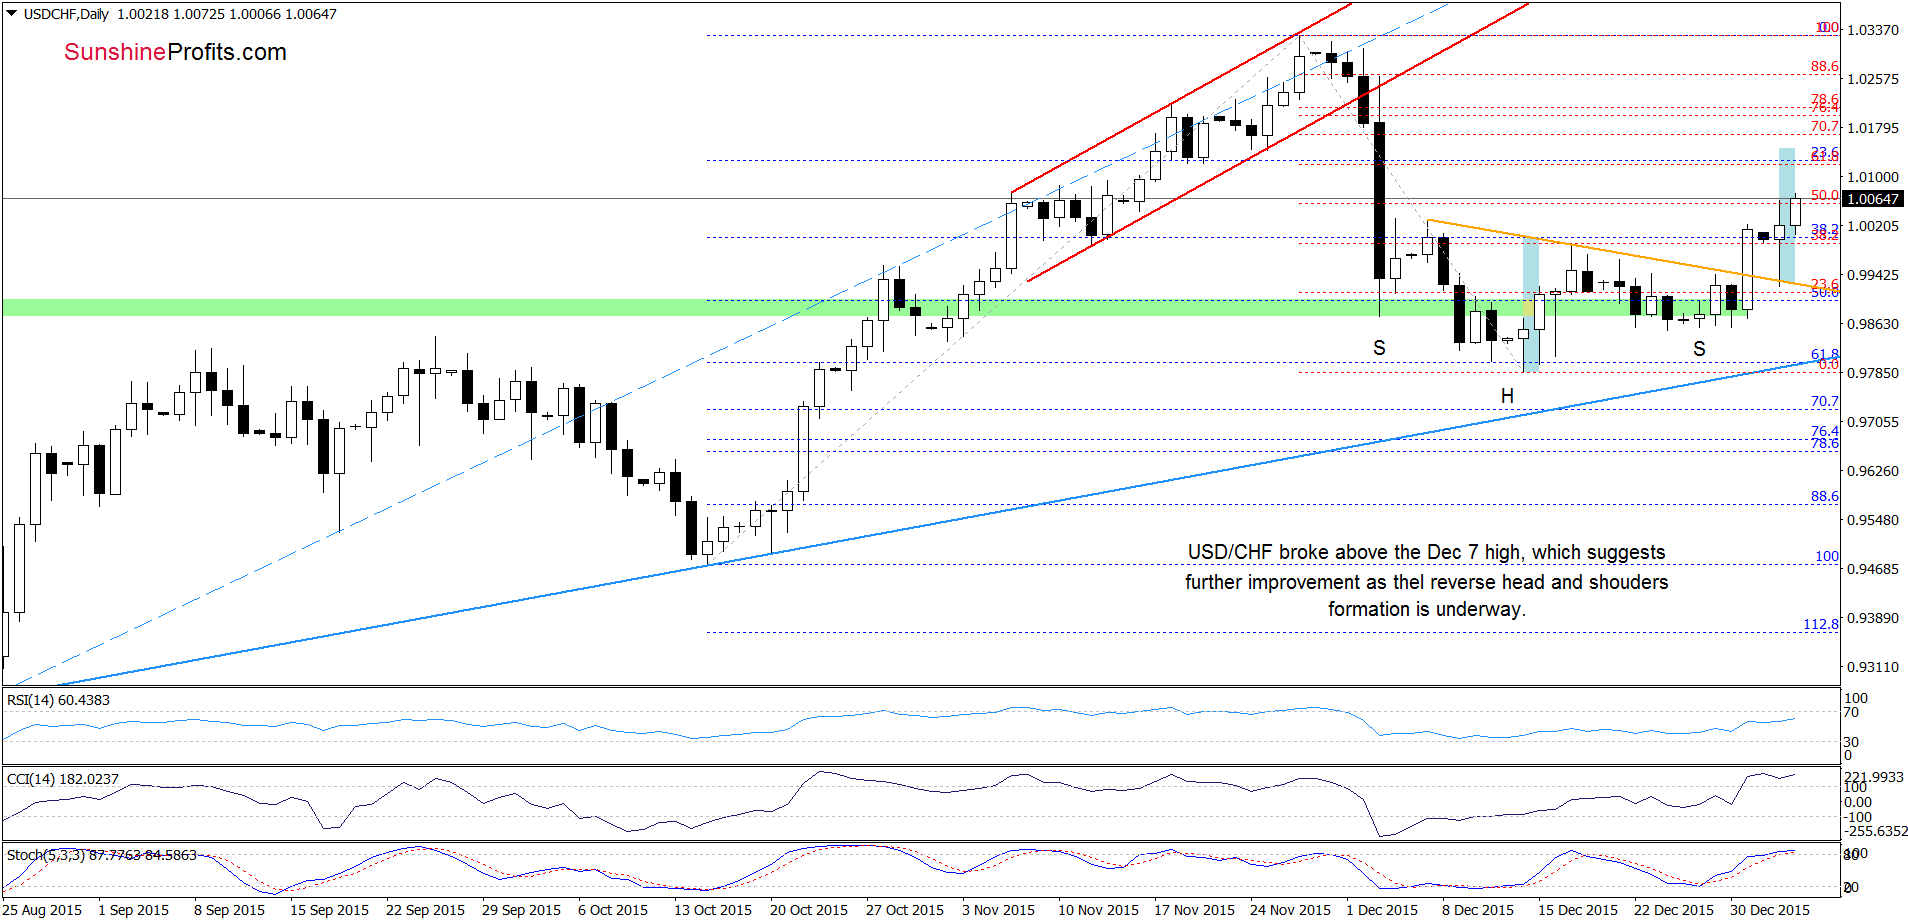
(…) a potential reverse head and shoulders formation is underway (…) the formation will be more reliable if USD/CHF breaks above the orange resistance line (the neck line of the formation) based on the previous highs. (…) the Stochastic Oscillator generated a buy signal, which increases the probability that currency bulls will start to act in the coming days.
From today’s point of view, we see that USD/CHF broke not only above the orange resistance line, but also the Dec 7 high, which suggests further improvement. How high could the pair go? In our opinion, the initial upside target will be around 1.0144, where the size of the move will correspond to the height of the reverse head and shoulders formation.
But will USD/CHF climb higher in the coming weeks? Let’s examine the weekly char and find out what can we infer from it.
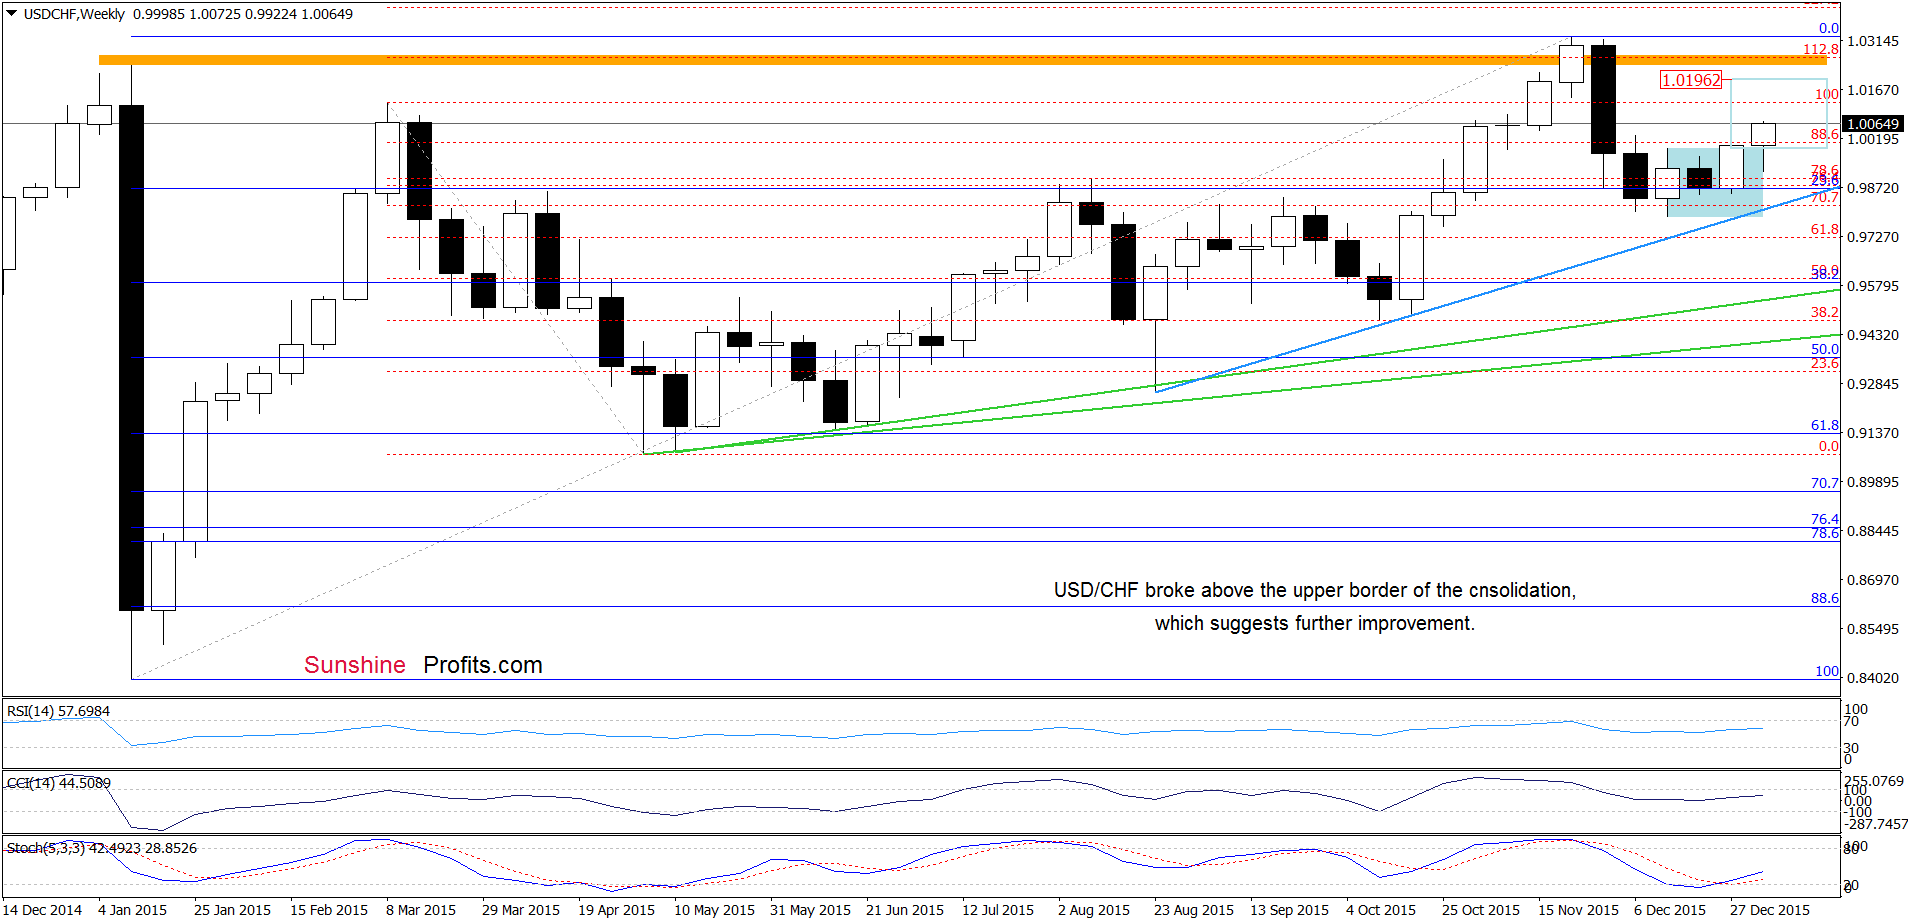
From this perspective, we see that USD/CHF broke above the upper border of the consolidation, which suggests an increase to around 1.0196.
Very short-term outlook: bullish
Short-term outlook: mixed with bullish bias
MT outlook: mixed
LT outlook: mixed
Trading position (short-term; our opinion): No positions are justified from the risk/reward perspective. We will keep you informed should anything change, or should we see a confirmation/invalidation of the above.
AUD/USD
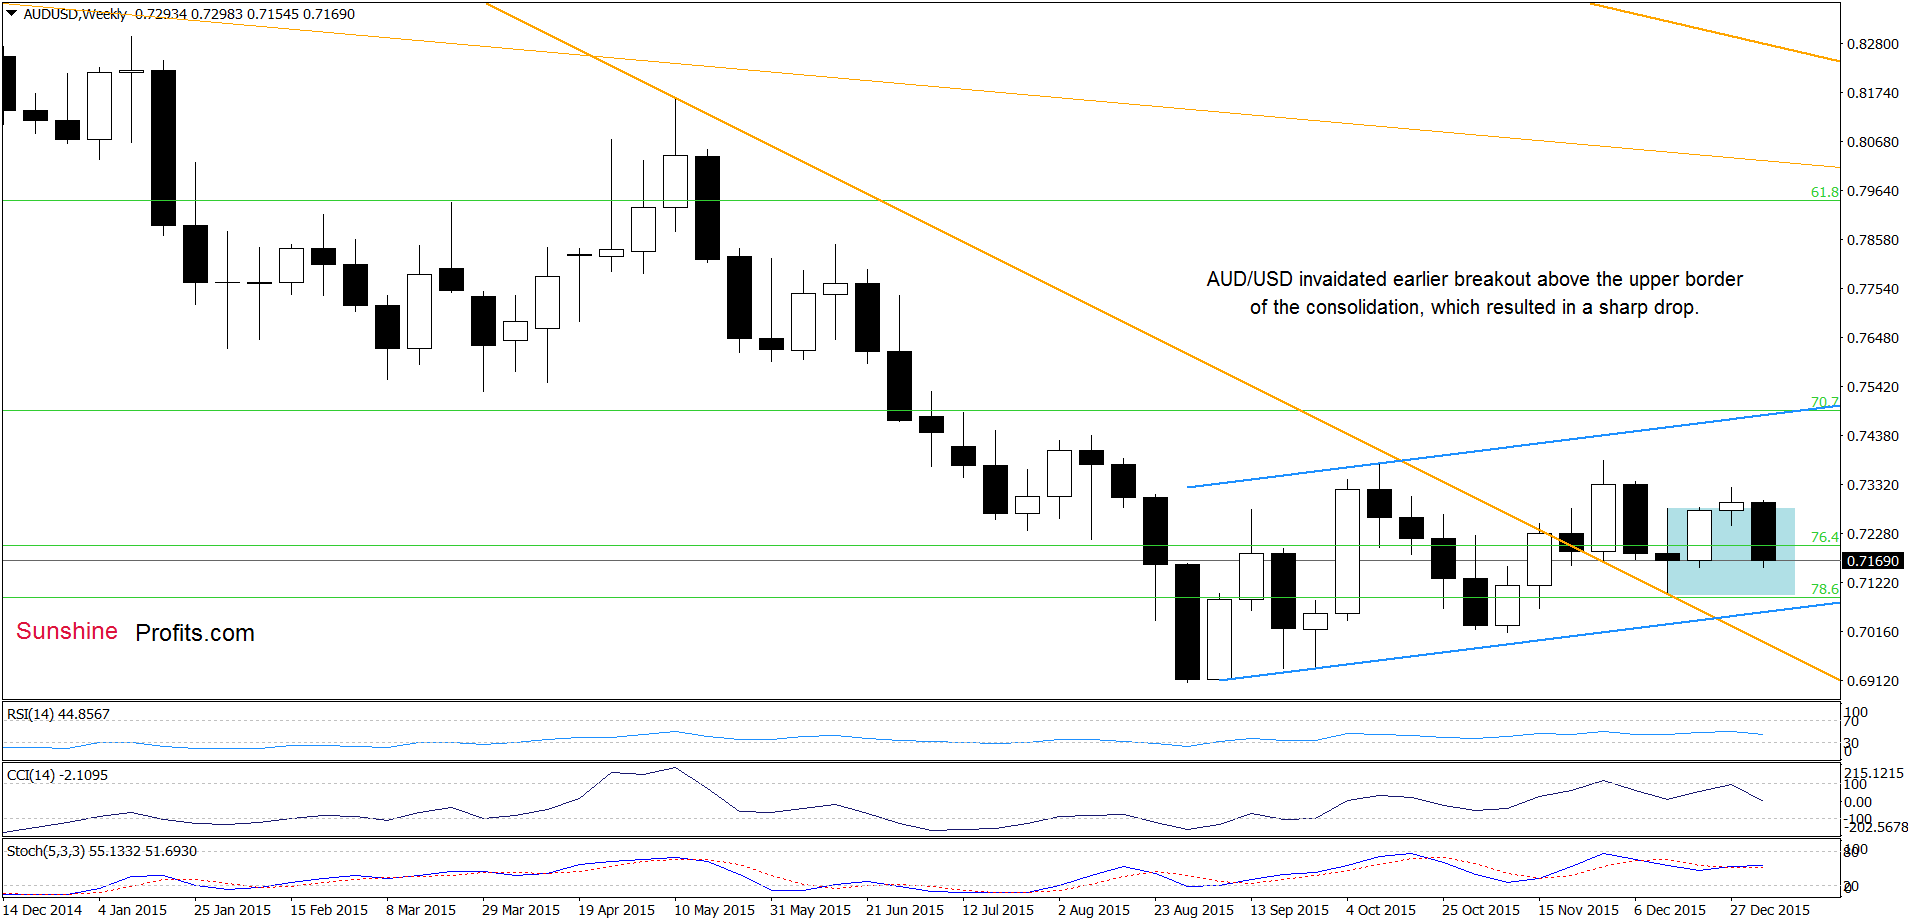
The first thing that catches the eye on the weekly chart is an invalidation of the breakout above the upper border of the consolidation. This bearish signal encouraged currency bears to act and pushed the exchange rate sharply lower.
What impact did this move have on the very short-term picture? Let’s check.
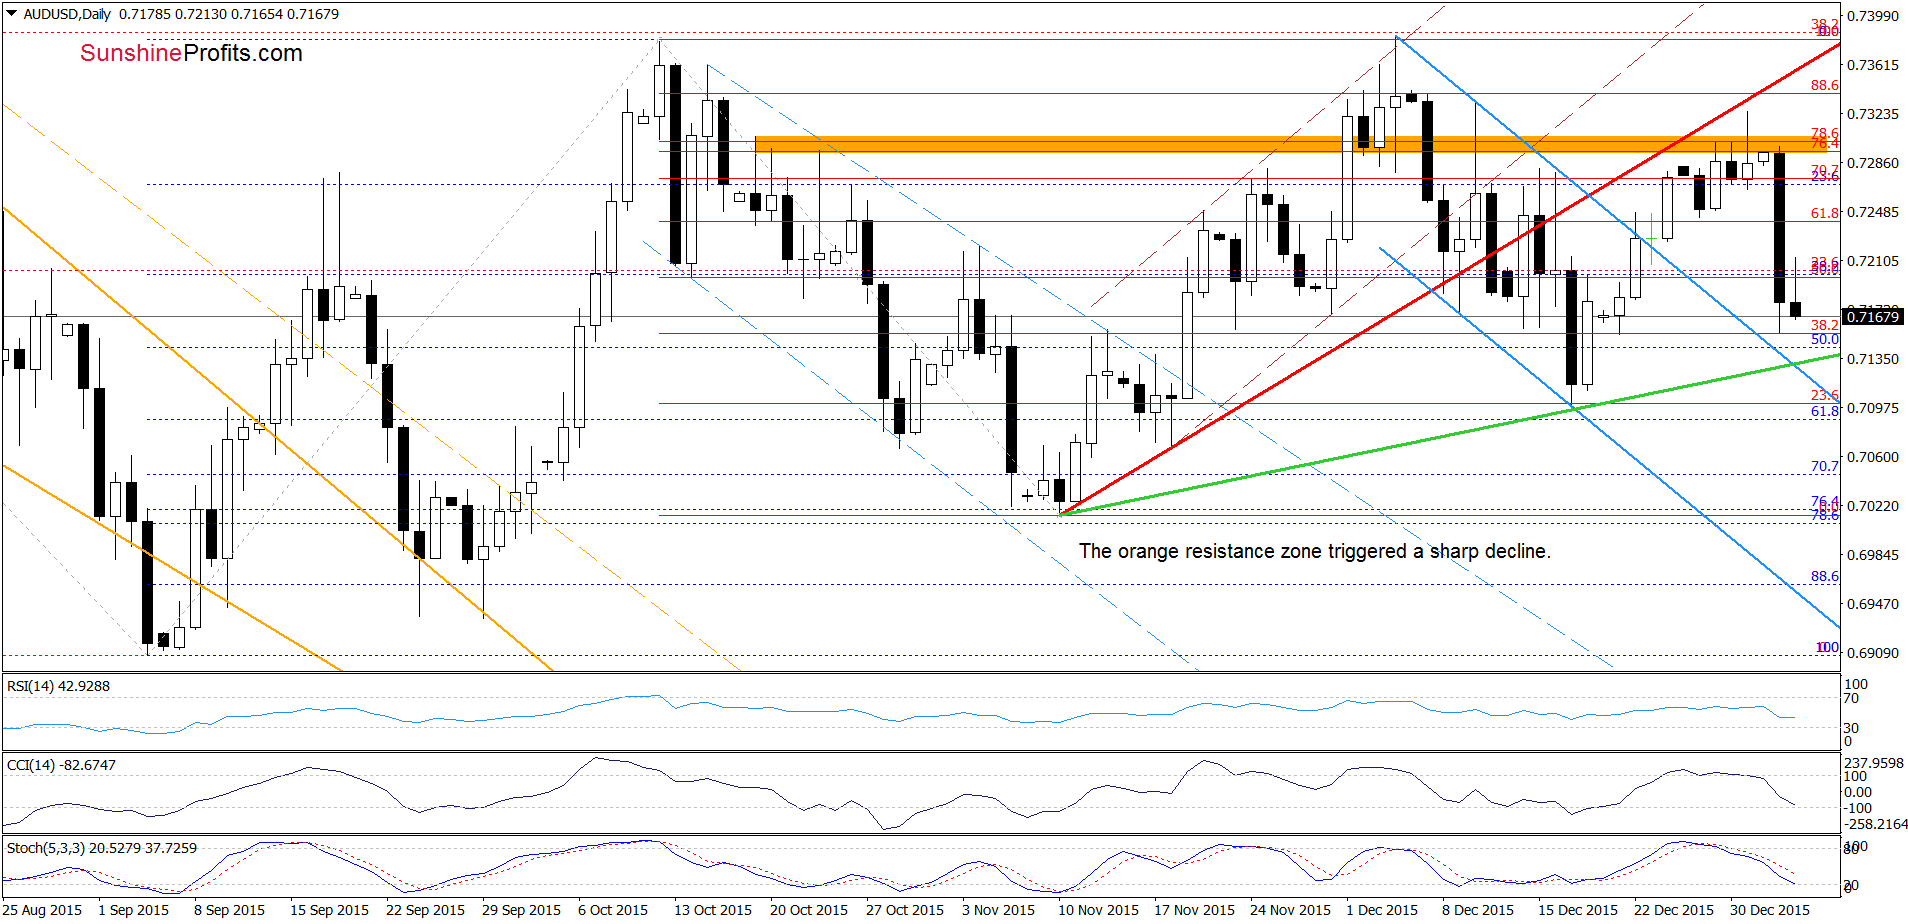
Quoting our Forex Trading Alert posted on Dec 30:
(…) the pair reached the orange resistance zone (created by the 76.4% and 78.6% Fibonacci retracements). As you see on the daily chart, the proximity to this resistance area was enough to encourage currency bears to act in the previous week and also in mid-Dec. Taking this fact into account, and combining it with the current position of the indictors (they are very close to generating sell signals), we think that further deterioration is just around the corner.
Looking at the daily chart, we see that currency bears showed their claws and pushed the pair sharply lower yesterday. Taking this fact into account, we believe that our downside target from the above-mentioned alert would be in play in the coming day(s):
If (…) AUD/USD declines from here, we’ll see a test of the previously-broken upper line of the blue declining trend channel in the coming days.
Very short-term outlook: bearish
Short-term outlook: mixed with bearish bias
MT outlook: mixed
LT outlook: mixed
Trading position (short-term; our opinion): No positions are justified from the risk/reward perspective. We will keep you informed should anything change, or should we see a confirmation/invalidation of the above.
Thank you.
Nadia Simmons
Forex & Oil Trading Strategist
Przemyslaw Radomski, CFA
Founder, Editor-in-chief
Gold & Silver Trading Alerts
Forex Trading Alerts
Oil Investment Updates
Oil Trading Alerts

Yesterday was the worst year-opening for trading in the U.S. markets in 84 years. It was prompted by a 7% drop in the Chinese CSI 300 benchmark index, which led to a halt in Chinese trading.
And all it took to send Chinese stocks spiraling downward was a proposal to lift the ban on major stakeholders selling their shares of Chinese stocks – almost identical to a proposal implemented just six months ago to halt that sell-off. This isn’t working, and it could well be the start of a more precipitous drop.
It’s important to remember that China is much more than the sum of its markets, but investors will have to contend with the chaos that’s spreading out from Chinese stocks. The research and recommendations in this report will help you do just that. You can even find ways to profit from the crash, too.

Have you ever worked in a mind-numbing cubicle? I did when I was younger, and I hated it.
Being stuck in a cramped cubicle lit by overhead fluorescent lights, wedged between dozens of coworkers whose phone conversations and keyboard strokes—as well as bodily odors and noises—sucked a little bit of life out of me every single day.
My cubicle experience made me feel like a white-collar prisoner, and I knew this was not how I wanted to spend my professional life. I needed to either move up the company ladder or start my own business.
Maybe I’m just a crybaby, because tens of millions of people toil in cubicles every day.
The cubicle, created by office furniture maker Herman Miller, has been around since 1968 and must have contributed to thousands of white-collar suicides, but it is solidly entrenched in American business life today and generates more than $3 billion in annual sales.

More importantly, I consider the office furniture business to be an extremely useful economic indicator. After all,
businesses only buy large amounts of office furniture—including the dreaded cubicle—when they are expanding their workforce and growing.
That is why my bear market antenna started to twitch when I read what two of the largest office furniture and cubicle manufacturers in the world had to say.
Cubicle Hell Warning #1: If you’ve ever worked in a cubicle, the odds are good that it was made by Steelcase, a manufacturer of a wide selection of office furniture, including what they call “seating products,” aka cubicles.
Steelcase reported its quarterly results at the end of December. The company surprised Wall Street with a very pessimistic outlook, warning that the next two quarters would be worse than previously forecast because of declining sales.
- Quarterly revenue came in at $787.6 million; a 1.6% year-over-year decline. However, Steelcase warned that its sales could fall to $720–$745 million, roughly a 2% decline.
- Steelcase management said it expects to make per-share earnings of 20 to 24 cents in the current quarter, below the 25 cents Wall Street predicted.
- Cash on hand fell by 6.9%, and inventories increased by 2.4% in the last 90 days.
- Steelcase’s biggest customers cut back the most. Big orders—defined as at least $3 million—fell 20% in the last quarter.
Steelcase stock suffered a 20% haircut on the news.
“The thing that was most pronounced was … a decline in orders from large customers and a decline in large projects,” Steelcase CEO Jim Keane said. “At the same time, order growth in the US furniture industry has slowed, as has overall US business capital spending. Our orders and pipeline at the end of the quarter showed fewer large projects than last year.”
The industries that cut back the most were insurance, energy, information technology, and financial services.
Cubicle Hell Warning #2: Herman Miller may be best known for its ultra-comfortable work chairs, but its specialty is selling bulk orders of cubicles to the biggest corporations in America.
.
However, its bread-and-butter customers are cutting back.
“I’d say if there is anything that you will hear out there, certainly the size of projects continues to be on mid-to-smaller size. There [are] not as many very, very large things out there, at least that we can see,” said CEO Brian Walker.
The drop in big orders resulted in a sales decline from Herman Miller’s largest sector, North America, for just the second time in the last 17 quarters.
Moreover, 2015 per-share earnings of $1.82 are still lower than 2007 ($1.98) and 2008 ($2.56).
Cubicle Hell Warning #3: HNI Corporation is another publicly traded office furniture maker, and its business has fallen off a cliff.
Sales growth at its office division was chugging along at a healthy pace; +13.7% in Q1 and up +6.4$ in Q2. However, sales growth turned negative in Q3, and forward guidance projected an acceleration in the decline to a range of negative 3% to negative 7%.
No wonder that HNI’s stock recently hit a new 52-week low. Remember, stocks that hit new 52-week lows almost always do so for very good reasons.
Cubicle Hell Warning #4: The Business and Institutional Furniture Manufacturers Association, or BIFMA, hears chatter from hundreds of its members.
Wherever the sector is heading, it isn’t positive. BIFMA reported a sharp decline in office furniture order growth—from 10% early in the year to 3% in the last couple months.
A Good Crisis Indicator
The ups and downs of the office furniture business is not a standalone indicator that you can use to time the market. It is, however, a very good advance indicator of overall economic health.
And if the above cubicle hell warning signs are any indication, our economy is headed for a severe slowdown. So unless you want to put your portfolio through cubicle hell… you better have a strategy to protect it when bad times come calling.
That doesn’t mean you should rush out and sell all of your stocks tomorrow morning, but it does mean that you should crank down the volatility of your portfolio.
You see, everybody loves volatility when stocks are rising, but everybody hatesvolatility when the stock market heads south.

Tony Sagami
30-year market expert Tony Sagami leads the Yield Shark and Rational Bear advisories at Mauldin Economics. To learn more about Yield Shark and how it helps you maximize dividend income, click here. To learn more about Rational Bear and how you can use it to benefit from falling stocks and sectors, click here

-
I know Mike is a very solid investor and respect his opinions very much. So if he says pay attention to this or that - I will.
~ Dale G.
-
I've started managing my own investments so view Michael's site as a one-stop shop from which to get information and perspectives.
~ Dave E.
-
Michael offers easy reading, honest, common sense information that anyone can use in a practical manner.
~ der_al.
-
A sane voice in a scrambled investment world.
~ Ed R.
Inside Edge Pro Contributors

Greg Weldon

Josef Schachter

Tyler Bollhorn

Ryan Irvine

Paul Beattie

Martin Straith

Patrick Ceresna

Mark Leibovit

James Thorne

Victor Adair