Who says gold lost its appeal as a safe haven asset?
After five straight positive trading sessions last week, the yellow metal climbed above $1,100, its highest level in nine weeks, on a weaker U.S. dollar.. The rally proves that gold still retains its status as a safe haven among investors, who were motivated by a rocky Chinese stock market, North Korea’s announcement that it detonated a hydrogen bomb last Wednesday and rising tensions between Saudi Arabia and Iran.
Here in the U.S., gold finished 2015 down 10.42 percent, its third straight negative year. Until the new year, sentiment appeared poor, and many gold bulls were finding it hard to stay optimistic.
But after the price jump last week, large exchange-traded gold funds saw massive inflows, confirming a shift in investors’ attitude toward the precious metal.
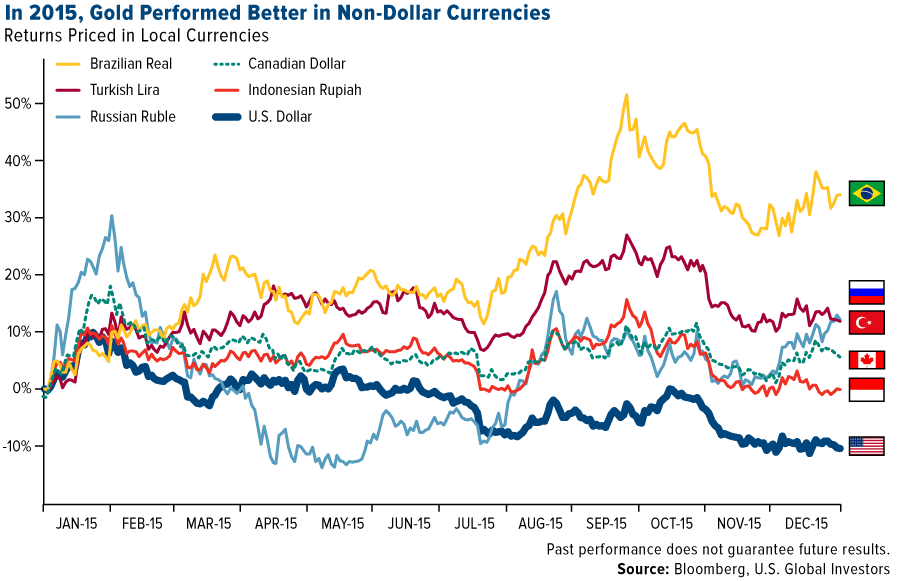
It’s worth remembering that about 90 percent of physical demand comes from outside the U.S., mostly in emerging markets such as China and India. In many non-dollar economies, buyers are actually seeing either a steady or even rising gold price. The metal is up in Russia, Peru, South Africa, Canada, Mexico, Brazil and many more.
Note the differences in returns between gold priced in U.S. dollars and gold priced in the Brazilian real, Turkish lira, Canadian dollar, Russian ruble and Indonesian rupiah.

click to enlarge
Gold demand in China was very robust last year. A record 2,596.4 tonnes of the yellow metal, or a whopping
80 percent of total global output for 2015, were withdrawn from the Shanghai Gold Exchange. As for the Chinese central bank, it reported adding 19 more tonnes in December, bringing the total to over 1,762 tonnes. Precious metals commentator Lawrie Williams points out, though, that China’s total reserve figure is widely believed to be “hugely understated,” meaning the central bank might very well have much more than we’re being told.
Forget Interest Rates—Real Rates Are the Key Drivers of Gold
Despite all the talk of rising interest rates in connection to gold, they’re not a dominant driver of prices. Sure, rising nominal rates have tended to make the metal less attractive, since it doesn’t pay an income, but the larger driver by far are real interest rates. When real rates drop into negative territory, gold has historically done well.
As a reminder, real rates, important for the Fear Trade, are what you get when you subtract the consumer price index (CPI), or inflation, from the 10-year Treasury yield. As of January 6, the 10-year yield was 2.18 percent, while the 12-month CPI for November—December data will be released later this month—came in at a barely-there 0.50 percent. Real rates, therefore, are running at a positive 1.68 percent, which is a headwind for gold.
That’s why we need inflation to pick up, because then gold would be more likely to rally.
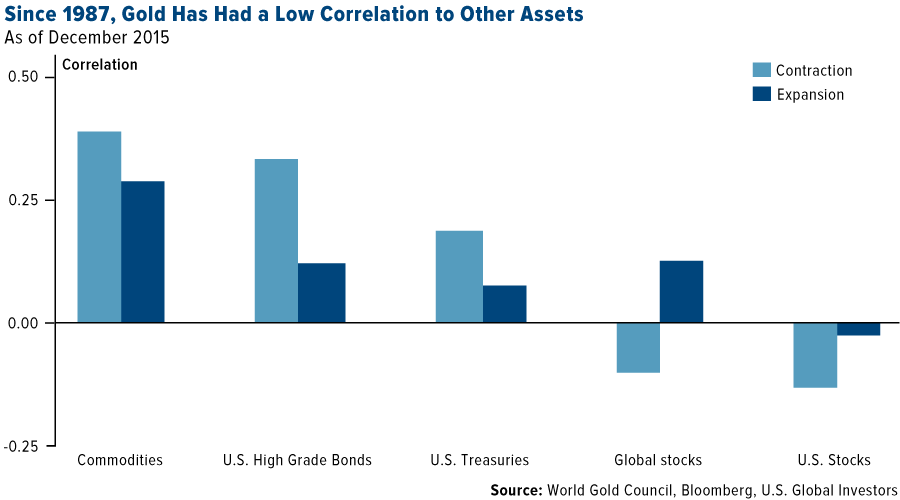
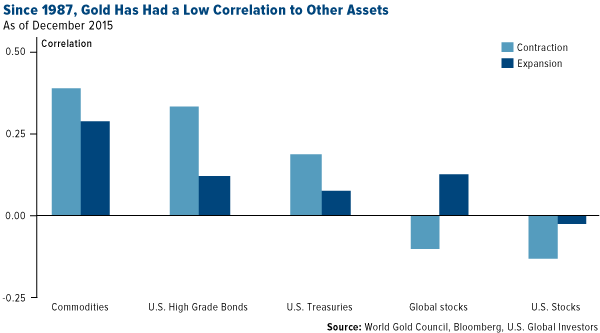
Regardless, the World Gold Council (WGC) writes in its 2016 outlook that gold’s role as a diversifier remains “particularly relevant”:
Research shows that, over the long run, holding 2 percent to 10 percent of an investor’s portfolio in gold can improve portfolio performance.
The reason for this is that gold has tended to have a low correlation to many other asset classes, making it a valuable diversifier. During economic contractions, for example, gold’s correlation to stocks actually decreased, according to data between 1987 and 2015.
click to enlarge
For the last three years, gold has disappointed many because other investments, specifically equities, have seen such huge gains. But with global markets hitting turbulence, the yellow metal is looking more attractive as insurance against the currency wars.
I always recommend 10 percent in gold: 5 percent in gold stocks or an actively-managed gold fund, 5 percent in bullion and/or jewelry. It’s also important to rebalance every year.
This should be the case in both good times and bad, whether gold is rising or falling. As highly influential investment expert Ray Dalio said last year: “If you don’t own gold, you know neither history nor economics.”
USGI Among the First to Discuss the Significance of PMI as a Forward-Looking Indicator
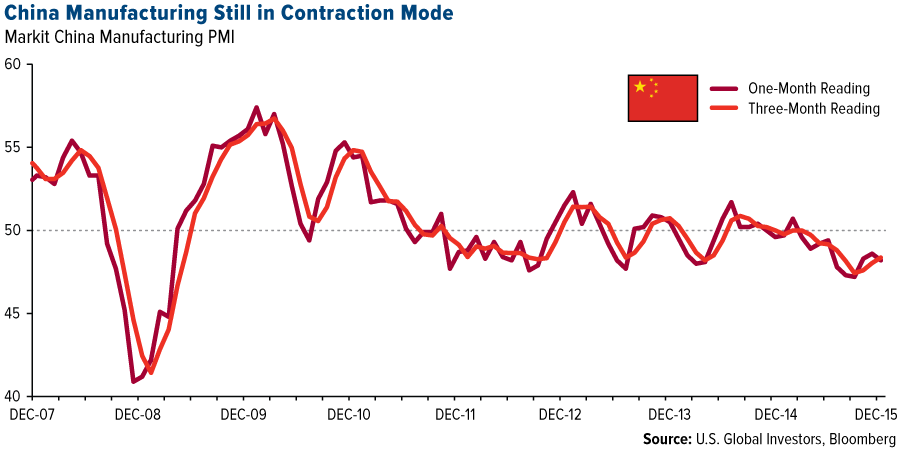
Aside from real interest rates, gold prices are being challenged by weak manufacturing data around the world. China’s purchasing managers’ index (PMI) fell to 48.2 last month, down 0.4 points from the November reading. The Asian giant’s manufacturing sector spent a majority of 2015 in contraction mode, managing to rise above the key 50.0 level only once last year, in February.

click to enlarge
Although fears of a Chinese slowdown are real, they’re largely overdone. Consulting firm McKinsey & Company’s Gordon Orr calls these fears a distraction, writing that “the country’s economy is still massive—as are its potentional opportunities.”
Something to keep in mind is that China recently approved a new five-year plan, its 13th since 1953. Although we won’t know exactly what’s in it until March, we do know that these plans have been good for economic growth in the past. It’s likely that interest rates will be trimmed even more to stimulate business, with more funding diverted to infrastructure and “green” initiatives.
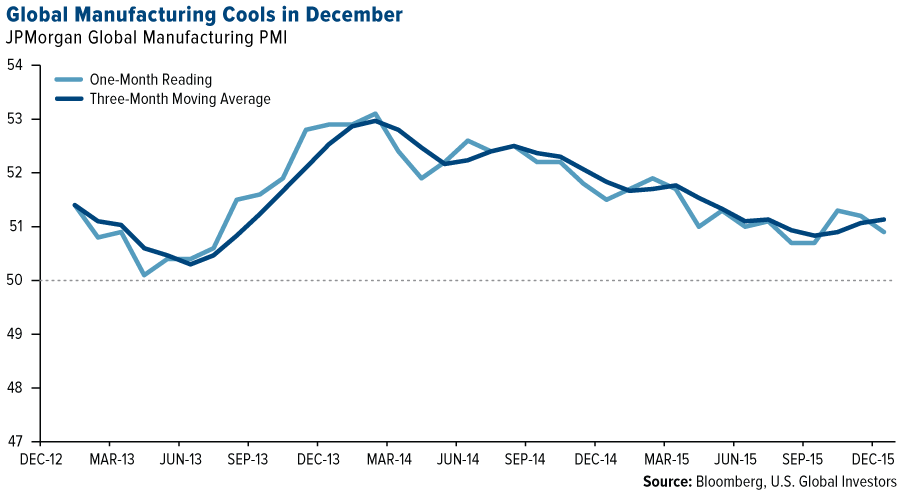
Manufacturing around the world showed signs of deterioration in December as well. The JP Morgan Global Manufacturing PMI declined to 50.9 from 51.2 in November. The sector is still in expansion mode, but just barely.
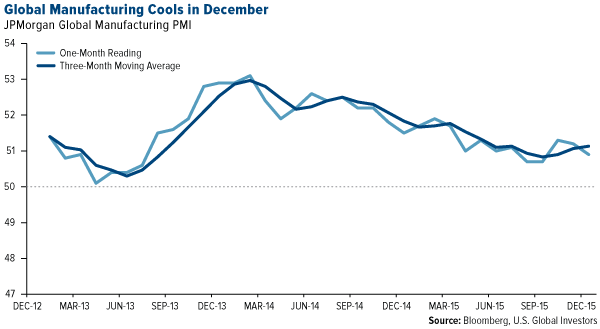
click to enlarge
The reading also fell below its three-month moving average in December, which, as I’ve shown many times before, can have a huge effect on materials and energy three to six months out.
We were one of the earliest investment firms to monitor this important economic indicator closely and bring it into public, everyday discourse. (From what I can find, the first time we wrote about it was in January 2009, as it applied—wouldn’t you know?—to China.) Today, I hear and read about the PMI on the radio and in newspapers as often as I do more common economic indicators such as GDP and unemployment rates.
That’s a testament to the sort of cutting-edge analysis we do and pride ourselves on here at U.S. Global Investors.
Looking Ahead in the New Year
Until we see global synchronized growth with rising PMIs, we remain cautious going forward. A constant source of hope is the Trans-Pacific Partnership (TPP), which, when ratified sometime this year, will eliminate 18,000 tariffs for 25 percent of global trade.
We also anticipate more stimulus programs this year around the world. Lately we’ve experienced strong fiscal drag as more and more regulations and taxes impede progress that not even cheap money has been able to offset. A 2014 report by the National Association of Manufacturers (NAM) revealed that federal regulations in the U.S. alone cost businesses more than $2 trillion a year. To ignite growth, G20 nations should commit themselves to cutting red tape.

A good model for such a task is Canada’s “One-for-One Rule,” introduced in April 2012 during former Prime Minister Stephen Harper’s administration. The rule mandates that when a new or amended regulation is introduced, another must be removed.
However it’s accomplished, regulatory burdens placed on businesses must be reduced.
For more in-depth analysis, consider subscribing to our award-winning newsletter, the Investor Alert.
All opinions expressed and data provided are subject to change without notice. Some of these opinions may not be appropriate to every investor. By clicking the link(s) above, you will be directed to a third-party website(s). U.S. Global Investors does not endorse all information supplied by this/these website(s) and is not responsible for its/their content.
The Caixin China Report on General Manufacturing is based on data compiled from monthly replies to questionnaires sent to purchasing executives in over 420 manufacturing companies. The J.P. Morgan Global Purchasing Manager’s Index is an indicator of the economic health of the global manufacturing sector. The PMI index is based on five major indicators: new orders, inventory levels, production, supplier deliveries and the employment environment.
The article references the investment theory of an investment as insurance against a separate market event that could negatively affect performance of an investment. The reference does not guarantee performance or a safeguard from loss of principal by investing in that asset.

 Demographics may not rule absolutely, but they likely will dominate investment markets and returns for the next few decades until the Boomer phenomena fades away.