
Bonds & Interest Rates
 If the Wednesday morning bank of Canada announcement revealed anything, it’s that Canada and Stephen Poloz may be shifting course to join the group of central bankers that are no longer attempting to save the world. Furthermore, they have accepted that the year ahead will be one of slow and tepid in terms of economic growth. As the first month of this year is already shaping up to look fairly ugly for the markets, we are constantly reminded of the troubled outlook for the global economy by consistent downward revisions for economic growth, as the most recent one came from the International Monetary Fund at the beginning of last week.
Harvard professor and former IMF Chief Economist Kenneth Rogoff said exactly that in an interview with Bloomberg from Davos, Switzerland at the World Economic Forum. Where people may be looking to central bankers to save the world and contain some of this market volatility, expectations should perhaps be paired back as we begin a year of expected moderate economic growth and wild market volatility. Central bankers will only concern themselves with market volatility if they begin to see evidence of a transmission to the real economy.
But back to Canada, a year on, it’s safe to suggest the challenges facing the Canadian economy have become that much broader and a little more complex. For example, the bank of Canada refers to slack and deflationary pressures from lower energy prices, and the toll it takes on Canadians and businesses linked to that sector. Challenging from the other side will be inflationary pressures from rising import costs hitting consumers on everything from groceries to electronics.
Finally, there is also a concern of a currency that mirrors some of the instability of the world’s emerging economies. This in particular has Canadians with strong business ties to the US either cheering as they get paid, or on the edge of their seat as they see margins slip away.
There is, however, a case for the Bank of Canada cutting interest rates a little further into 2016. A few important aspects they may be looking for are the degree of fiscal stimulus from the Federal Liberal’s first budget and where oil prices may settle going into the spring. However, as long as oil prices and the dollar keep slipping, I am of the view the weaker currency will do the bank of Canada’s heavy lifting for them, and they will not need to lower rates. But to quote the governor in a speech earlier this month, “the economy’s adjustment process can be difficult, and painful,” and unfortunately certain regions and aspects of the Canadian economy are in for just that.

Gold and Silver have held up well during the recent selloff in equities. From December 28 through Wednesday the broad NYSE lost 10.4% while the S&P 500 lost 9.6%. Precious Metals gained strength during that period. Gold advanced 3.0% while Silver gained 1.7%. Gold relative to the NYSE broke its downtrend and touched an 11-month high. Gold relative to global equities (excluding the US market) reached a 2-year high. Precious metals have clearly benefitted from the equity selloff but therefore figure to lose strength as the equity market begins a relief rally.
Equities have become very oversold and are forming a bullish reversal. The weekly candle chart of the S&P 500 is shown below. The market is forming a bullish hammer (reversal candle) right at important support. The week is not over but we expect volume to be sizeable. The last two hammers on big volume came at the October 2014 and August 2014 lows. The market became extremely oversold this week as only 15% of stocks within the NYSE were trading above their 200-day moving average. That is the lowest figure in more than four years. Furthermore, various sentiment indicators are showing extreme pessimism. The AAII survey for example is showing the lowest amount of bulls since 1987.

S&P 500 Weekly Chart
The S&P 500 could rally as high as 1990 where there is major resistance. Wednesday’s low should hold for at least a few months.
The recent poor performance of the gold miners is another signal that the metals (Gold and Silver) are at risk of making lower lows. During the aforementioned period when the metals were positive the miners (GDX and GDXJ) lost 9.6% and 12.0%. That relative and nominal weakness is a strong signal that the recent strength in the metals is unlikely to last.
GDX and GDXJ are charted below. The miners are recovering in part due to the recovery in the stock market. They are also retesting Tuesday’s breakdown to new lows. The rally has been weak as there is strong resistance overhead in the form of recent support ($18 for GDXJ and $13 for GDX) and the 50-day moving averages.
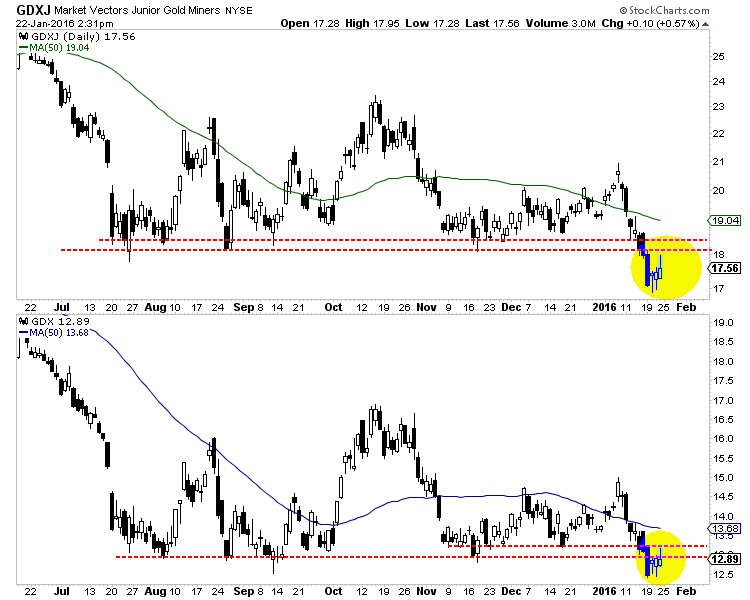
GDXJ & GDX Daily Candles
Recent relative weakness in the gold miners along with the bullish reversal in the equity market is a bearish development for precious metals. Gold and surprisingly Silver have held up well amid the decline in equities. They enjoyed a safe-haven bid yet are likely to lose that bid as the equity market begins a relief rally. The gold stocks, while initially following the stock market could resume their decline once metals have resumed their downtrends. Precious metals bulls should wait for an extreme oversold condition amid extreme bearish sentiment before turning bullish. As we navigate the end of this bear market, consider learning more about our premium service including our favorite junior miners which we expect to outperform in 2016.
Jordan Roy-Byrne, CMT

 If you have invested for any length of time, you will have heard the expression “Past results are not an indication of future performance.” The best in our industry not only agree with that but some feel that in the coming years we should prepare ourselves for lower returns than we are used to. If the markets are indeed prepared to not be as generous, then keeping fees as low as possible has never been more important. We need to keep as much of the overall return as possible… CLICK HERE to watch the video
The Evidence-Based Investor Video series is a service provided by Paul Philip and the team at Financial Wealth Builders Securities

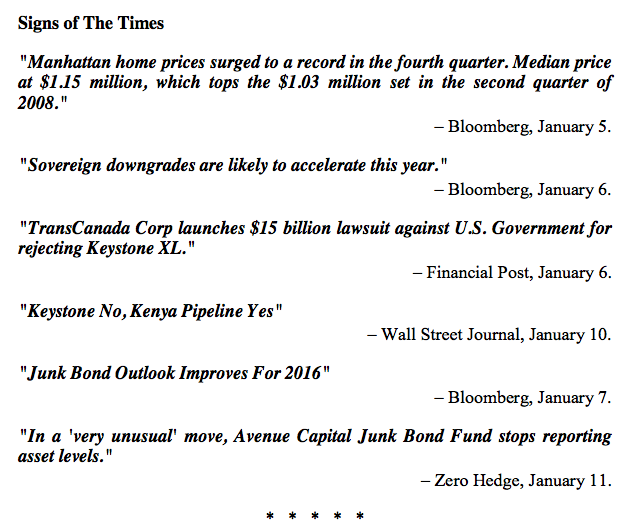
Perspective
The year 2015 was remarkable. For the first time, a year with the ending in five number did not accomplish a gain. On the nearer-term, the Turn of the Year trade was the weakest in decades. It’s been widely reported that many hedge-fund strategies were not successful.
Beginning at Christmas last year, our research generally worked out. That includes the “Rotation” in commodities out to around May and then resumption of the bear market. Credit spreads were likely to be positive into June and then reverse to adversity.
The big event in equities was the Shanghai Bubble and collapse. While we did not forecast the Bubble, the work on its demise was reliable. In April the thrust was becoming compulsive and we noted that history suggested that it would climax in June.
Headlines that this year’s slump was forced by blunders by the guys running the Shanghai Exchange were inappropriate. Our comments have been that offers overwhelmed bids.
On the rebound out of the Shanghai Crash, the high-side of the ChartWorks target on the DJIA was a 100 points low. On the momentum target, the RSI number was almost met. Both were close enough.
Stock Markets
The headline on the latest slump was forced by blunders at the Shanghai Exchange. Our thoughts were that offers overwhelmed bids.
The hit was simple, but the stuff about limit-moves was complication. However, as with the hit in August, it was preceded by spread-widening. This time, spreads broke out on December 21st. The S&P fell through the 50 and 200-Day moving averages on December 29th. The SSEC fell through its 50-Day on December 31st.
The rally attempt by crude failed and in declining it forced spread-widening and another hit to most commodities.
All of which combined to record one of the worst opening weeks in history.1
Quite likely, that the year started badly has had little to do with the calendar, but more to do with seasonal weakness in crude oil and spread-widening. The latter can constrain stock market rallies.
As noted last week, the NYA had taken out the low closes back to October. This was enough to call it a bear. This also showed up in the All-World ex-US Index (VEU). The S&P has taken out the Shanghai-hit lows, but not back to the 2014 lows.
However, the Transports have been leading since April and the way has been down. TRAN took out the lows back to 2014 in early December. The European STOXX took out the August-September lows but not the ones in 2014.
As of today, BKX and XBD have taken out the lows back to 2014. Using the S&P, the US market is not oversold, and still precarious.
Currencies
With some swings, the Dollar Index is slowly rising with the 50-Day ma. Momentum is neutral and above the 100 level suggests a move to 109.
The Canadian dollar’s decline has steepened and at 69 is back to the levels of 2002. At 23 on the Weekly RSI it is getting oversold.
Credit Markets
The reversal to widening spreads triggered the setback in 2007. The second “breakout” in spreads marked the start of the severe contraction in 2008. We were watching for this in late July and it pushed off the infamous Shanghai liquidity crisis.
This time around, the second “breakout” (using the CCC spread) was accomplished on December 21st at 16.74 percentage points. It is now at 17.24, which is moving right along. The “breakout” in late July was at 10.57.
(The problem in Shanghai was more widening credit spreads than bureaucratic blunders at the exchange. Arbitrarily set limit moves did not prompt the selling.)
The extreme in the 2008 Crash was 44.20 percentage points.
This is our target. Once spreads set a new trend it becomes cyclically relentless.
The long bond (TLT) has rallied with each setback in the stock market and is doing it now. The rally from 119.67 in late December has made it to resistance at the 125 level. It is uncertain how far this can go.
Since June 2014 the advice has been to avoid lower-grade stuff and to position 3 to 4-year high-grade US corporates. The contribution from the US dollar has been outstanding.
Link to January 16, 2016 Bob Hoye interview on TalkDigitalNetwork.com:
https://www.youtube.com/watch?v=QAxXWas54pg&feature=youtu.be

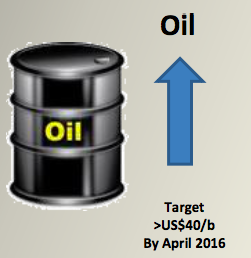 Oil Price Final Plunge Nearly Over
Our forecast of WTI crude falling to US$30/b has been realized. With Iran last weekend having sanctions removed excluding the US, the fight for market share in Europe is well underway. Many refineries in Europe used to take Iranian/Persian crude regularly (especially BP whose historical background included being founded as Anglo-Persian Oil Company in 1908) and so Iran is providing significant discounts to regain access. As a result of the new competitive pressure, prices for WTI and Brent have retreated this week to close today at US$28.36, another new low for the cycle.
There is now a window for crude prices to capitulate to even lower lows as fears of economic slowdown, risk off trading and margin calls across various asset classes have negatively impacted high yield bond, stock and commodity markets in the first two weeks of 2016. The Dow Industrials has fallen over 7%, the TSX by over 8%, and the Shanghai Stock Exchange by a staggering 18% in just the first two weeks. One measure of this developing fear is that the VIX volatility index has risen in the US from the 18 level at the end of December 2015 to as high as 30.95 last week (now 25.88).

-
I know Mike is a very solid investor and respect his opinions very much. So if he says pay attention to this or that - I will.
~ Dale G.
-
I've started managing my own investments so view Michael's site as a one-stop shop from which to get information and perspectives.
~ Dave E.
-
Michael offers easy reading, honest, common sense information that anyone can use in a practical manner.
~ der_al.
-
A sane voice in a scrambled investment world.
~ Ed R.
Inside Edge Pro Contributors

Greg Weldon

Josef Schachter

Tyler Bollhorn

Ryan Irvine

Paul Beattie

Martin Straith

Patrick Ceresna

Mark Leibovit

James Thorne

Victor Adair