
Stocks & Equities
We continue to classify the prospective equity market return/risk profile within the most negative climate we identify. The basis of this classification is fairly straightforward. Historically, once an extended speculative period of extreme overvalued, overbought, overbullish conditions gives way to increasing risk-aversion, as indicated by deterioration in market internals (and particularly in the presence of hostile yield trends in the form of widening credit spreads), the stock market has become vulnerable to vertical losses. Though not every instance of this syndrome has been followed by a market collapse, every notable panic and market crash across more than a century of data has featured that basic setup.


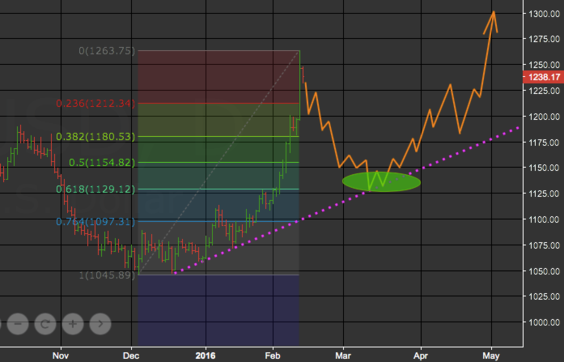
Not much has changed since our gold correction commentary post on the 10th (here) except that gold had spiked up to $1263 on Thursday after global equities weakness and continued fears about European banks.
The fib retracements have stayed pretty much the same except now moving up a bit. For the most part, our analysis has not changed as we still anticipate a move lower from the seasonal February high into a seasonal low (March-April) of between $1130-$1150.


BRUSSELS – For the better part of a decade, central banks have been making only limited headway in curbing powerful global deflationary forces. Since 2008, the US Federal Reserve has maintained zero interest rates, while pursuing multiple waves of unprecedented balance-sheet expansion through large-scale bond purchases. The Bank of England, the Bank of Japan, and the European Central Bank have followed suit, each with its own version of so-called “quantitative easing” (QE). Yet inflation has not picked up appreciably anywhere.
 ….read more HERE
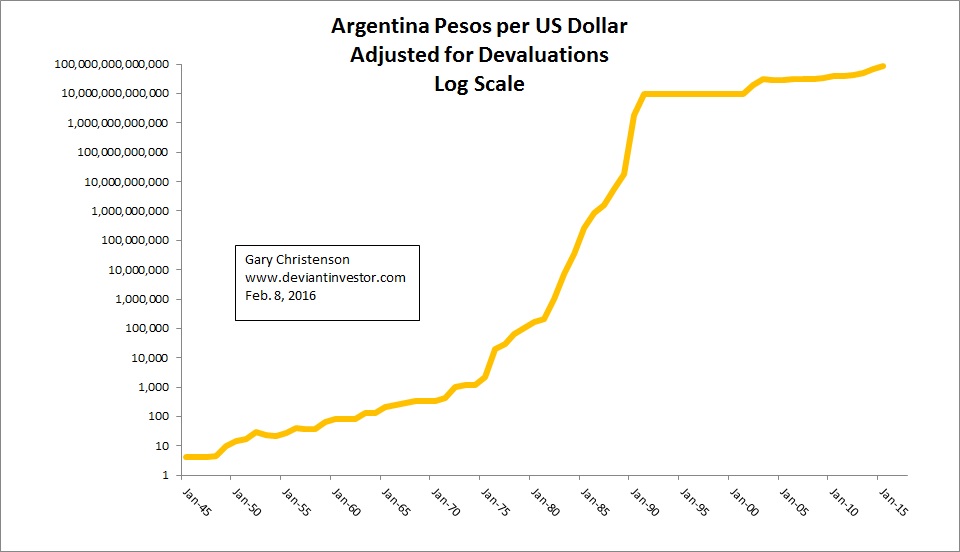
The exchange rate between the Argentina Peso and the US dollar in January 1945 was 4.17 pesos to one dollar. Like the United States, Argentina created substantial price inflation – devaluation of their currency – in the 1950s – 1990s.
According to Wikipedia Argentina devalued their currency by a factor of 100 in 1970, by another 10,000 in 1983, by another 1,000 in 1985, and by another 10,000 in 1992.
From Alan Greenspan in 1966: “In the absence of the gold standard, there is no way to protect savings from confiscation through inflation.”
In summary the 1945 peso was devalued by 10 trillion to one between 1945 and 2015. Imagine what that did to the poor and to the saving of anyone who left that savings or retirement in pesos!
The compounded average rate of increase in the number of pesos per dollar from 1945 to 2015 was about 55% per year, every year. The devaluation was worse than average between 1975 and 1995. Gold in 1945 pesos increased at a compounded average rate of 63% per year since 1945. (Store of value!)
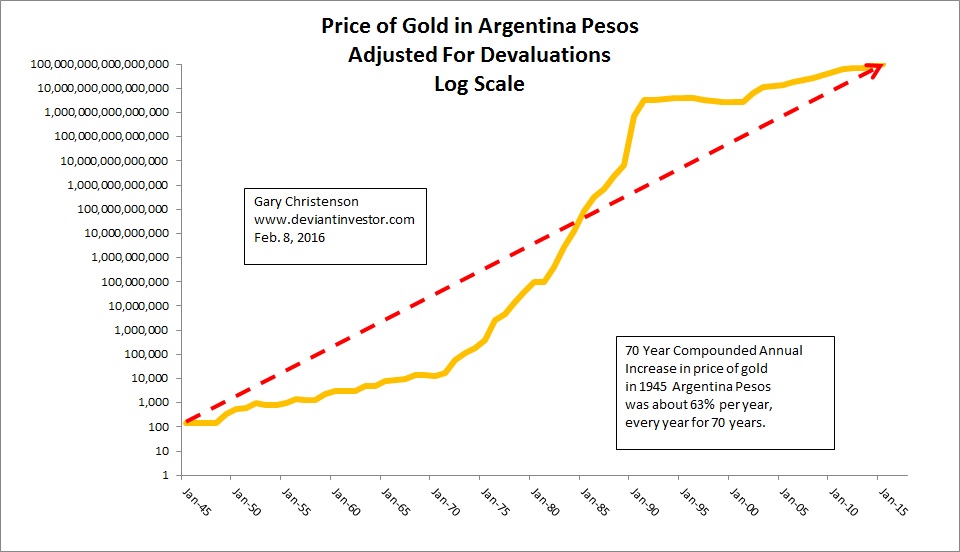
Suppose your savings in Argentina pesos had been valued in gold. Take the peso to dollar exchange rate and multiply by the price of gold in dollars and we see the price of gold in 1945 pesos.THE POINT OF THIS IS:
Argentina devalued their currency from 1950 onward and more aggressively in the 1970s, 1980s and 1990s. The difference between Argentina and the United States (and Japan, the EU, the UK, Australia etc.) is mostly a matter of degree.
The US benefitted from the dollar’s “reserve currency” status plus the US military, but the devaluation process has been similar, though less devastating. In 1971 the US dollar bought approximately 0.03 ounces of gold. By 2015 the US dollar bought less than 0.001 ounces of gold – a devaluation of over 30 to one. More devaluation is coming.
EXPONENTIAL INCREASES HAPPEN HERE:
The global financial system is based on exponentially increasing debt, currency in circulation, and devaluations. Examples:
- Official US national debt: Approximately 9% per year exponential increase since 1913. (Consumer price inflation is alive and well.)
- Gold price increase in US dollars since 1971: Approximately 7.8% per year exponential increase since 1971. (Increases coming soon.)
- Silver price increase in US dollars since 1971: Approximately 5.5% per year exponential increase since 1971. (Big increases coming soon.)
- Shanghai Index from June 2005 to October 2007: Approximately 217% per year exponential increase for 2.3 years.
- Shanghai Index from March 2014 to June 2015: Approximately 216% per year exponential increase for 1.3 years.
- Crude Oil price increase from December 1998 to October 2000: Approximately 196% per year exponential increase for 1.8 years.
- Crude Oil price increase from January 2007 to July 2008: Approximately 203% per year exponential increase for 1.5 years.
- NASDAQ Composite price increase from October 1998 to March 2000: Approximately 257% per year exponential increase for 1.4 years.
- Nikkei Index price increase from July 1984 to December of 1989: Approximately 129% per year exponential increase for 5.4 years.
- Silver price increase from August 1977 to January of 1980: Approximately 276% per year exponential increase for 2.4 years.
- Adjusted US monetary base per Federal Reserve Bank of St. Louis increase from 2008 to January of 2015: Approximately 24% per year exponential increase for 6.5 years.
- Exponential increases have also occurred in student loans, sub-prime auto loans, military expenditures, SNAP program (food stamps) expenses, media expenses to help purchase US Presidential elections, donations (pay-offs) from Wall Street to Presidential candidates, and many more.
CONCLUSIONS:
The Argentina peso was aggressively devalued over many decades due to excessive government spending, corruption, stupidity, and “central bank printing.”
The US dollar was aggressively devalued over many decades due to excessive government spending, corruption, stupidity, and “central bank printing.” The rate of devaluation was substantially less in the US, but the basic concept and result were the same – higher prices.
Since the US dollar is backed by “full faith and credit” and not by gold, oil, diamonds, or anything real, exponential increases (since 1971) in public and private debt, expenses, loans, currency in circulation, and prices for most items have been typical.
Exponential increases are occasionally not managed or controlled and increases of 25% to 250% per year occur, as per the above examples.
Such parabolic spikes usually correct in a nasty crash and people invested in those spiking “assets” typically lose money, whether it is the NASDAQ, Nikkei, gold, crude oil, or many others. Imagine the impact from a crash in the US dollar – it might happen. (Some suggest it is inevitable.)
Pesos, dollars, yen, euros, pounds, and other fiat currencies will continue to be devalued since we live in a devaluing world. Backing the US dollar with the military will help, support from petro-dollars will help, “reserve currency” status will help, but the trend is the same – fiat currencies always devalue and gold, on average, holds value. Examine again the chart of gold prices in Argentina pesos for an extreme example.
Do your own research, but in my opinion, gold and silver bottomed in 2015, the S&P 500 Index topped in 2015, and the next several years will see much higher gold and silver prices, and considerable trauma for stock prices.
Interesting Reading:
Clive Maund: Gold Market Update
Bill Holter: You are Watching It
Dave Kranzler: Global Economic System is Crashing
King World News: Dire Warning to the World
Gold Thrives, Paper Dies!
Silver Thrives, Paper Dies!

-
I know Mike is a very solid investor and respect his opinions very much. So if he says pay attention to this or that - I will.
~ Dale G.
-
I've started managing my own investments so view Michael's site as a one-stop shop from which to get information and perspectives.
~ Dave E.
-
Michael offers easy reading, honest, common sense information that anyone can use in a practical manner.
~ der_al.
-
A sane voice in a scrambled investment world.
~ Ed R.
Inside Edge Pro Contributors

Greg Weldon

Josef Schachter

Tyler Bollhorn

Ryan Irvine

Paul Beattie

Martin Straith

Patrick Ceresna

Mark Leibovit

James Thorne

Victor Adair