
Bonds & Interest Rates

While central bankers warn about deflation, the real danger for consumers is inflation, and more specifically stagflation—a combination of price inflation and low growth or no growth. Stagflation is the reality of the US economy right now.
Shadowstats says that inflation has run 4% to 8% since 2012. During much of this period, the US economy has been in recession. Eight percent inflation plus low or no growth certainly sounds like stagflation.
After all, how could deflation be a threat when banks regularly print billions, if not trillions, of dollars? While there may be a time lag, inflation is the inevitable consequence of printing. And now it’s hitting Canada.
The Fed had four rate hikes planned for the US this year to dampen growing price inflation. But market reaction to the first has been so bad, it’s more likely additional quantitative easing is on the table.
As for the vaunted US recovery, the country has been in a recessionary environment since 2001, when the dollar began to move down against gold. The Fed revved up the printing presses at that time and created a series of asset bubbles, including the great subprime bubble that collapsed in 2008.
There was no recovery. The economy was goosed, and the resultant monetary debasement was so significant that the whole world was plunged into a quasi-depression. The crises are manufactured; each one brings the economic environment closer to a terminal breakdown. When it comes, there will be elaborate plans for a more centralized monetary and banking system.
In the meantime, central banks have taken to buying gold. It’s something that investors should take note of.
The economy is not recovering. Deflation, going forward, is not going to be an issue. What lies ahead, just as in the 1970s, is stagflation. At that time, gold reached $800 an ounce, and silver was $50. Where precious metals could go this time is anyone’s guess. But if you own some, you may be happy to find out.

| Wed. | Thu. | Fri. | Mon. | Tue. | Wed. | Evaluation | |
| Monetary conditions | 0 | 0 | 0 | 0 | 0 | 0 | 0 |
| 5 day RSI S&P 500 | 72 | 66 | 66 | 76 | 57 | 62 | 0 |
| 5 day RSI NASDAQ | 74 | 63 | 65 | 73 | 56 | 63 | 0 |
|
McCl-
lAN OSC.
|
+191 | +174 | +154 | +226 | +148 | +168 |
–
|
| Composite Gauge | 5 | 12 | 10 | 4 | 16 | 9 | 0 |
| Comp. Gauge, 5 day m.a. | 8.4 | 8.0 | 7.2 | 7.0 | 9.4 | 10.2 | 0 |
| CBOE Put Call Ratio | 1.14 | 1.07 | 1.03 | .95 | 1.12 | 1.04 |
+
|
| VIX | 22.31 | 21.65 | 20.53 | 19.38 | 20.28 | 20.72 | 0 |
| VIX % change | -7 | -3 | -1 | -6 | +8 | -1 | 0 |
| VIX % change 5 day m.a. | -3.2 | -4.0 | -5.2 | -4.4 | -1.8 | -0.6 | 0 |
| Adv – Dec 3 day m.a. | +1882 | +1301 | +624 | +502 | +143 | +380 | 0 |
| Supply Demand 5 day m.a. | .69 | .71 | .80 | .79 | .61 | .62 | 0 |
| Trading Index (TRIN) | .58 | 1.51 | 1.76 | .37 | 1.96 | 1.06 |
0
|
|
S&P 500
|
1927 | 1918 | 1918 | 1946 | 1921 | 1930 | Plurality 0 |

 A Motley Fool member asked a great question during a Q&A session at a gathering in San Diego last week:
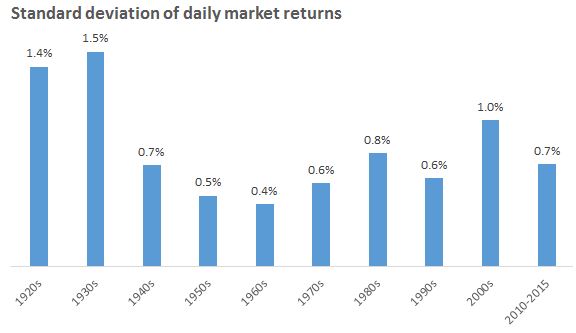
“With the bigger presence of media talking about the markets and the hyperactivity of trading by computers, do you see this higher volatility as a more permanent reality for the markets?”
I like this question because the amount of media attention and computer trading is unquestionably higher today than the past. It worries a lot of people.
But the premise of the question — whether there is more volatility today compared to the past — is a separate issue. And the answer might surprise you.
In response to the question I said that I suspected, without looking at the data, that …
- Hour-to-hour, day-to-day, market volatility is indeed higher now than it was in the past.
- Month-to-month, year-to-year, I didn’t think volatility is higher now than it’s been for most of history.
But that was a guess. So I crunched the numbers this week and … CLICK HERE to read the complete article

This is a financial cold war — nothing more, nothing less.
While there are billions of reasons to cut output, and every major producing country is reeling from the loss of revenues, some are weathering the current bust better than others, but the devil is in the details, and the details contain tons of variables.
Production cost and breakeven figures that analysts enjoy bandying can trap you in bubble of black-and-white mathematics that is a few brush-strokes shy of a full picture.
Breakeven prices are hard to pin down, and harder yet because they fluctuate. OPEC governments downsize their budgets, cut social spending and put big projects on hold to lower the breakeven price. Independent producers likewise cut spending and delay development to get closer to a feasible breakeven. So the breakeven is elusive.
Saudi Arabia and Kuwait enjoy some of the lowest production costs in the world, at about $10 and $8.50, respectively, according to Rystad Energy data. Production in the UAE costs just over $12 per barrel, which is pretty much the same as in Iran, though Iranian officials say they will eventually be able to produce for as low as $1 per barrel from their central fields.
But these are just the costs of lifting oil out of the ground. State-owned oil companies often have many more responsibilities than just producing oil. They underpin generous spending levels by their governments, and thus any estimate of a “breakeven” price should include the cost of those obligations.
It’s hard to come up with a real breakeven point for Saudi oil, for example, because it is responsible for funding the royal palace and indirectly, a large number of social programs that include everything from education to housing and energy subsidies. It’s hard to measure costs when this oil has to pay for all the luxuries of the Saudi royal family.
According to Quartz, if you add in all these costs that U.S. shale producers don’t have, we’re looking at a breakeven point of around $86 per barrel for Saudi oil. That’s just one opinion, but it’s a poignant one. So is the royal family ready to give up its luxuries? Or will they sacrifice things such as healthcare and education first? The fact that the government is considering taking parts of Saudi Aramco public does not bode well.
The Iranian perspective, newly off sanctions, is entirely different. It’s probably more concerned about regaining the market share it lost under sanctions than it is about low prices. In June, Iran will launch a new grade of heavy crude that will compete with Basra crude, and which the Iranians will surely seek to undercut in price in order to win Asian market share from Iraq and the Saudis.
For Nigeria, Libya and Iraq, the breakeven point is the point at which they can fund the fight against Boko Haram, a civil war and the Islamic State, respectively. Right now, they can’t. And that’s with per barrel production costs of around $31/$32 in Nigeria, $23/$24 in Libya, and $10/$11 in Iraq.
Then we have Venezuela, where production costs hover just over $23 per barrel on average, but where disaster is imminent. Debt defaults here are looming, and inflation is soaring, while recent moves to drastically devalue the currency and raise gas prices by over 6,000 percent for the first time in decades are harbingers of highly destabilizing unrest. For Venezuela, the breakeven point is particularly elusive because the country’s oil is very heavy and very dirty — and thus very expensive to extract and refine.
Breaking the back of U.S. shale?
From the Saudi perspective, the end game here is to break the back of U.S. shale.
The average production costs for the U.S. is about $36 per barrel, but Rystad Energy estimates that some the key U.S. shale plays have a $58-per-barrel breakeven point. This, too, varies section by section, and even well by well, so it’s hard to get a concrete picture.
Here is the breakeven picture in more detail, courtesy of Rystad Energy:

Plenty of shale areas are still profitable even with oil below $30, according to Bloomberg Intelligence — just ask Texas, where the Eagle Ford shale play’s Dewitt County patch, for instance, can turn a profit even with crude below $23. Other counties, though, might need $58 to be profitable.
It’s all about hedging right now for U.S. shale producers. The larger percentage of oil output that’s protected by hedging, the longer the lifeline.
Last week, Denbury Resources Inc. (NYSE: DNR), for instance, said it had increased its fourth-quarter hedges to cover 30 Mbbl/d at around $38/bbl.
So far, “there is little evidence of production shut-ins for economic reasons,” according to Wood Mackenzie’s vice president of investment research, Robert Plummer. “Given the cost of restarting production, many producers will continue to take the loss in the hope of a rebound in prices.”
The breakeven is quite simply the line in the sand that determines whether extracting a barrel of oil is profitable or not. And this line in the sand is vastly different for private American producers than it is for kingdoms such as Saudi Arabia.
Everyone is hurting, some more than others. Venezuela is already on its knees. But even $30 oil isn’t enough to bring the other bigger players down or to end the cold oil war. Saudi Arabia has some $600 billion in financial reserves; Russia is worried enough only to start talking to OPEC; U.S. producers are holding strong and are fairly calm, closely measuring the pace of desperation most recently indicated in the word game over an output freeze.
The variables of the breakeven game favor U.S. shale. But Saudi Arabia won’t give up the cold war path easily because its ultimate goal is to preserve its market share at all costs.
Article Source: http://oilprice.com/Energy/Crude-Oil/Who-Will-Be-Left-Standing-At-The-End-Of-The-Oil-War.html
By Charles Kennedy for Oilprice.com

One of the most important aspects of the rising tide of geopolitical disruptions — as spelled out by the research I have done on war cycles — is how they are impacting the world’s financial markets.
As I’ve discussed many times in the past, they are changing everything you thought you knew about investing.
Consider the U.S. property markets, which have already recovered from their lows quite nicely — even as mortgage rates have stabilized and started moving higher.
Consider how the Chinese and Europeans, as well as the Canadians, are now the biggest foreign buyers of U.S. real estate, which is helping to support that sector.
Consider that recently, a Chinese-led investor group announced it would buy the Chicago Stock Exchange.
Or that there have already been 82 Chinese outbound mergers-and-acquisitions deals announced this year, amounting to $73 billion in value, according to Dealogic. That’s up from 55 deals worth $6.2 billion in the same period last year.
Or consider gold, which is now nearly 16 percent above its bear market low of last December, moving up right on schedule, even though the U.S. dollar also remains strong.
Or the U.S. stock markets, whose bear market correction is continually being supported by foreign capital inflows.
You are going to see and hear more about foreign-capital inflows in the months and years ahead. Inflows that will shock you and cause wild moves in markets that defy logic.
Moves that dumbfound most U.S. analysts, especially those — the majority of them — who still focus merely on the U.S. economy and who ignore what’s happening on a global basis.
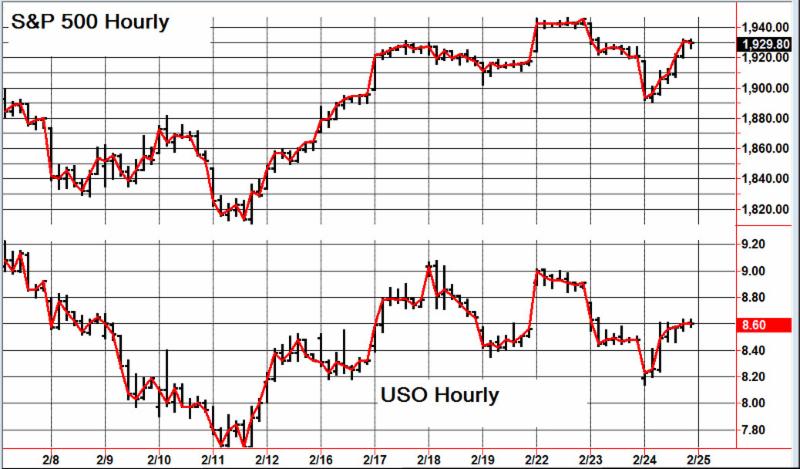
 Gold will rise with a stronger dollar. Commodity prices in general will soon bottom and head higher, even though the global economy remains lackluster at best. Oil, for instance, has already bottomed, again right on cue with my forecasts.
Equity markets and property prices will increase with rising interest rates.
So what then is the common denominator behind these market moves?
What’s the fuel that is causing the linkages between them to change, wreaking havoc on old rules of thumb and ushering in new relationships between markets, between economic data and logic …
Creating forces that you must grasp to truly protect and grow your wealth?
It’s geopolitics and international capital flows. Reasons:
Today, we live in a world where governments are at war with each other. Propaganda wars. Trade wars. Currency wars.
Today, we live in a world where governments are getting ready to reignite “hot” wars: Russia/Ukraine. China/Japan. Israel/Gaza. Then, there’s ISIS and its rampage in the Middle East.
And today, we also live in a world where the bankrupt governments of the West are waging wars against their very own citizens, via tax hikes, confiscatory schemes, and capital controls.
All of this is causing capital in nearly every corner of the globe to take flight, leaving risky countries and investments and heading toward safer shores.
For many months now. I have told you that those capital flows are pointing directly toward the United States. Savvy European investors are moving their investments out of Europe in droves.
Middle Eastern money is also coming to our shores. Savvy Chinese investors are investing in the Unites States hand over fist, and especially in U.S. property markets.
My view: Based on how the war cycles are ramping up for another five years and how they do not show any relief until 2020, capital is likely to continue to stampede into U.S. investments.
Reason: Despite our country’s problems, we remain one of the safest countries on the planet, with the most open, liquid and diverse markets in the world.
My words for you: Follow the money going forward. The international capital flows. They are the single biggest key to protecting and growing your wealth now and for many moons to come.
Best wishes,
Larry
P.S. We are on the cusp of the most profitable bull market of our lifetime. Stocks will be driven higher by powerful global undercurrents that Wall Street will either ignore or fail to understand. As the Dow doubles, some stocks will see explosive gains of 300%, 400%, 500% and more. Savvy investors who make the right moves will become very rich! Click here for my free report and to find out how it could make you rich beyond your dreams.

-
I know Mike is a very solid investor and respect his opinions very much. So if he says pay attention to this or that - I will.
~ Dale G.
-
I've started managing my own investments so view Michael's site as a one-stop shop from which to get information and perspectives.
~ Dave E.
-
Michael offers easy reading, honest, common sense information that anyone can use in a practical manner.
~ der_al.
-
A sane voice in a scrambled investment world.
~ Ed R.
Inside Edge Pro Contributors

Greg Weldon

Josef Schachter

Tyler Bollhorn

Ryan Irvine

Paul Beattie

Martin Straith

Patrick Ceresna

Mark Leibovit

James Thorne

Victor Adair