
Stocks & Equities
If you like volatility, you had to love this past week. After sliding 22 points on Tuesday, the market rebounded sharply on Wednesday, gave up those plus more on Thursday, and as of Friday is struggling to stay positive.

The spike on Wednesday followed the release of the FOMC minutes which confirmed “bad news is still good news” for the markets as global weakness is keeping the Fed from hiking rates. The surge out of the gate on Friday was again “Fed Speak” as Fed President William Dudley continued “dovish” comments suggesting no rush to hiking rates anytime soon. To wit:
“Caution is needed because of our limited ability to reduce the policy rate to respond to adverse developments, recognizing that we could also use forward guidance and balance sheet policies to provide additional accommodation if that proved warranted.
Although the downside risks have diminished since earlier in the year, I still judge the balance of risks to my inflation and growth outlooks to be tilted slightly to the downside.”
And with those “silky smooth” words, traders rushed to buy stocks as the risk of tighter monetary policy continues to pushed further out into the future. Like the cartoon shows, courtesy of Hedgeye, the only thing that matters to the markets right now is the Fed.

1. Mike’s Editorial of the Week
In a blistering commentary Michael roasts emotional thinkers, the mainstream media, and weaknesses that can cost you money.
{mp3}grant/040216x{/mp3}
2. “Awesome Silver & USD Alarm Bell”
Stewart Thomson of Graceland Updates and his 24 key points for the short and intermediate term of the most important price driver of precious metals, the US dollar
3. Martin Armstrong – ECB Losing Control
Banks continue to implode in Europe and smart capital flees to the USA, the ECB is incapable to reversing the trend.

Last week we concluded:
As long as the gold stocks continue to hold support for another week or two then the near term outlook is bullish. A bull flag is a consolidation pattern that separates two strong moves. It could be developing in the miners. There is logical reason to be cautious if not bearish at this point. The metals look okay at best while the miners remain somewhat overbought. However, the action in the miners, if it continues for another few weeks is telling us what could be ahead.
The strength in the miners continues to surprise as the majority of pundits look for any reason for a pullback in the face of very bullish price action. The gold miners are now breaking out and Gold is likely to follow.
The weekly candle charts of GDXJ and GDX are shown below along with their 80-week moving averages. Note that the miners advanced for six weeks and their bullish consolidation began during that sixth week in late February. This week marks the fifth week since the previous advance. The miners are a little overbought here but not as much as they were five weeks ago. Moreover, we should note that overbought can become very overbought and extremely overbought. The immediate upside targets are GDXJ $33 and GDX $22.50 and it is possible this move has even greater upside.

Turning to Gold, we see that it has stabilized in the mid $1200s within a larger range of $1210 to $1270/oz. With the miners breaking to the upside, Gold is very likely to follow to the upside. The current net speculative position of 43% is relatively high but we should note that from 2001 to 2012 it often peaked at 50% to 60%. Gold is weaker than the miners and may require a bit more consolidation. Nevertheless, weekly closes above $1262/oz and $1300/oz could send Gold on its way to $1400/oz.

A move in Gold to $1400/oz would fall in line with history. In the chart below we compare the current rebound in Gold to its rebounds following major lows in 1976 and 2008. If Gold rallies to $1400/oz in the next few months then its recovery would be in line with those previous two recoveries.

After consolidating in bullish fashion for a good five weeks the miners appear to be starting their next leg higher and this should eventually propel Gold higher. The toughest time to buy is after a market has already had a strong rebound, following a nasty bear market. Investors and pundits alike subconsciously refuse to believe a major change has taken place. Gold stocks endured the worst bear market in 90 years. Of course there will be fear that it could reassert itself at any time. However, the action of the market is clear. Gold stocks are breaking out and could be headed much higher in the near term.

Stock Markets
The Sensational Season seems to be improving. How much sensation is needed to become overdone?
Our target on the rally in stocks, commodities and junk has been for around March. As noted last week, equity sectors we cover had reached technical readings high enough to conclude that most of the expected move has been accomplished.
Base metal miners (XME) rallied from 11.33 in January to 21.48 last week. Outstanding enough to take money off the table. Trading between 19 and 21 since, taking out the 200- Day at 17.50 would turn a correction into the next phase of the decline.
The decline started in 2011 with exceptional momentum and real prices for metals having been unusually high for an unusually long time.
We don’t see anything that undoes the condition of too much capacity.
Oil stocks (XLE) rallied from 49 in January to 63.85. This was right to the 200-Day ma. Also it reached Daily and Weekly RSIs that limited rallies since the peak in 2014. It has traded between 60 and 62, remaining below the 200-Day.
Since 2014, mining stocks fell to a quarter of the high. Oil stocks have fallen in half, which suggests too many investors are still positioning on Middle East problems. Until this capitulates, the longer-term outlook is not positive.
Retail (XRT) did well in accomplishing the best momentum in a couple of years. The rally started at 37.67 in January and has reached 46.50 this week. The last part of the rally has been sharp enough to register an Inverse Springboard, which could reverse the action.
Getting below the 200-Day would be negative.
Weaker sectors such as the banks (BKX) have been modest on the rebound. That’s despite the best action in spreads and the curve since the pressures started in June. BKX moved from 56 in February to 66 last week. Since the peak in July, this is the second test of the 20-Week exponential moving average.
If it fails it would be similar to 2008 when it followed the ema down. Seemingly forever. Broker-Dealers are in the same pattern and the chart follows.
This week, credit spreads seem to have stopped narrowing.
After the technically heralded peak at 400 in July, Biotech (IBB) sold off to the 240 level. The rebound was to 272 in early March. It has been around 257 since.
On the longer term, the rebound is the second attempt to get above the declining 20-Week ema. If it fails Biotechs have much further to fall.
Currencies
Over the past year, the US dollar seems to building a base. This is noticeable on many declines ending at 30 on the Daily RSI. The basing level for the DX has been either side of the 95 level.
It could take more time in the basing pattern, but the next surprise will be to the upside. We hope not to be surprised.
The Canadian dollar has accomplished the best rally since the bear began at 106 in 2011. This was from 68 to almost 78. The Weekly RSI is now as overbought as it was at the key high in June 2014. That’s as crude peaked at 107.
This rally in the C$ seems to be topping.
Credit Markets
Credit spreads have clocked the best run of narrowing since the pressures erupted last June. That’s when the CCC spread was trading at 9.50%. It reached its worst in the panic into February at 20.66%.
The low was 17.08% a couple of weeks ago. Now at 17.57%, getting above 17.80% would formally end the correction.
As noted last week, JNK, HYG and EMB had accomplished technical excesses. The potential setback would likely begin to widen spreads.
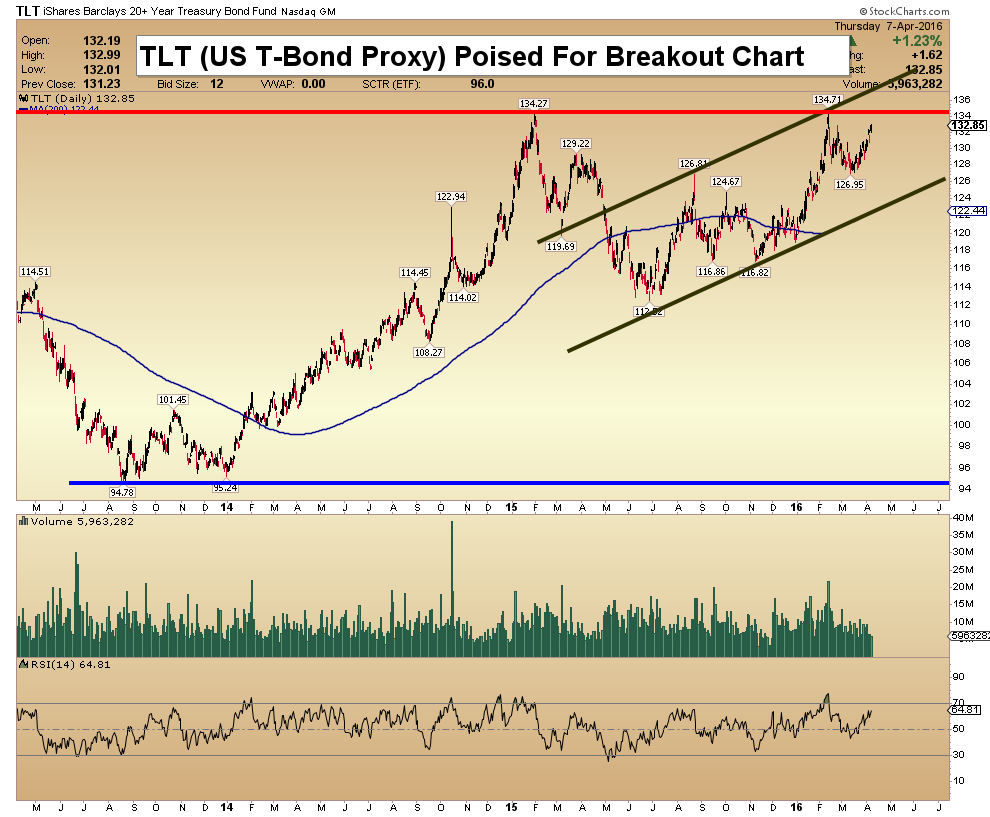
The long bond (TLT) seems poised to take another run at the 135 level.
Precious Metals
Gold rallied from the depressed 1045 level in December to the high at 1287 earlier in the month. Essentially, a 23% rally against a 3% drop in the dollar. This has stimulated supply/demand researchers to discover shortages in supply as well as growing demand.
We have found that the only time it is really safe for fundamental research is at a distressed bottom for the sector. Such as in December. Other than in such conditions, supply/demand analysis is usually dangerous. Particularly, in silver.
Our policy is to consider that December was likely a cyclical low for gold stocks that would set up a cyclical bull driven by improving earnings. The latter would depend more upon improving operating margins than upon a soaring price in dollars.
The sector as charted by the HUI became the most overbought on the Weekly RSI in five years. The low was 99 and the high was 189 in the middle of the month. The 90 percent gain compares to the 23 percent gain in the bullion price.
A significant correction is needed and seems to have started.
Latest on the Canadian Dollar jump April 8th HERE
Link to April 1, 2016 Ross Clark and Bob Hoye interview on TalkDigitalNetwork.com:
https://www.youtube.com/watch?v=V1Z4teyHFoI&feature=youtu.be

Today’s commentary and charts (double click to enlarge):
US Bonds, Dollar & Dow Video Analysis
Gold & Silver Bullion Video Analysis
Precious Metal ETFs Video Analysis
Trader Time Swing Trades Video Analysis
Key Individual Stocks Video Analysis
Morris
The SuperForce Proprietary SURGE index SIGNALS:
25 Surge Index Buy or 25 Surge Index Sell: Solid Power.
50 Surge Index Buy or 50 Surge Index Sell: Stronger Power.
75 Surge Index Buy or 75 Surge Index Sell: Maximum Power.
100 Surge Index Buy or 100 Surge Index Sell: “Over The Top” Power.
Stay alert for our surge signals, sent by email to subscribers, for both the daily charts on Super Force Signals at www.superforcesignals.com and for the 60 minute charts at www.superforce60.com
About Super Force Signals:
Our Surge Index Signals are created thru our proprietary blend of the highest quality technical analysis and many years of successful business building. We are two business owners with excellent synergy. We understand risk and reward. Our subscribers are generally successfully business owners, people like yourself with speculative funds, looking for serious management of your risk and reward in the market.
Frank Johnson: Executive Editor, Macro Risk Manager.
Morris Hubbartt: Chief Market Analyst, Trading Risk Specialist.
website: www.superforcesignals.com
email: trading@superforcesignals.com
email: trading@superforce60.com
SFS Web Services
1170 Bay Street, Suite #143
Toronto, Ontario, M5S 2B4
Canada


-
I know Mike is a very solid investor and respect his opinions very much. So if he says pay attention to this or that - I will.
~ Dale G.
-
I've started managing my own investments so view Michael's site as a one-stop shop from which to get information and perspectives.
~ Dave E.
-
Michael offers easy reading, honest, common sense information that anyone can use in a practical manner.
~ der_al.
-
A sane voice in a scrambled investment world.
~ Ed R.
Inside Edge Pro Contributors

Greg Weldon

Josef Schachter

Tyler Bollhorn

Ryan Irvine

Paul Beattie

Martin Straith

Patrick Ceresna

Mark Leibovit

James Thorne

Victor Adair