
Gold & Precious Metals
The gold stocks have had a tremendous rally in recent months that has left most investors and even gold bulls on the sidelines. From low tick to high tick GDXJ has more than doubled while GDX has nearly doubled. Indices such as the HUI and XAU have more than doubled. It has been a fantastic rally yet both anecdotal and actual data suggests there has been a major wall of worry building. Although gold stocks may be starting a correction, the presence of a strong wall of worry provides further confirmation of a major trend change.
In recent weeks readers and followers of various gold centric websites have been bombarded with bearish commentaries from pundits and analysts forecasting a correction. More than a month ago the reasoning was the commitment of traders (CoT) report. More recently, the reasoning revolved around an alleged “parabolic move” in the gold stocks and a budding head and shoulders top in Gold.
Today Bloomberg published an excellent article calling the rally one of a lifetime yet also noting that investors have completely missed it. GDX is up more than 65% year to date but gold miner ETFs have seen half a billion in outflows. According to SentimenTrader, the majority of the outflows occurred after February 19 yet GDX has climbed since then. Furthermore, and I’m not sure how actionable this is but on February 19 StockTwits sentiment for GDX showed only 19% bears. A few days ago bears were at 52%. Most investors have grown more bearish even as miners have continued to rally!
The fact is when a devastating bear market finally gives way to a new bull most investors and even those with a bullish bias are either outright incredulous or simply decide to wait for the inevitable correction. The problem is the correction never comes or when it does come, it is smaller than expected and the buying opportunity evaporates quickly and instantly. For those who are incredulous, their mindset is simply stuck in the previous bear as they have not accepted the new bull market.
Take a look at our chart of the HUI bull analogs. Does the recent rebound look like a bear market rally to you?
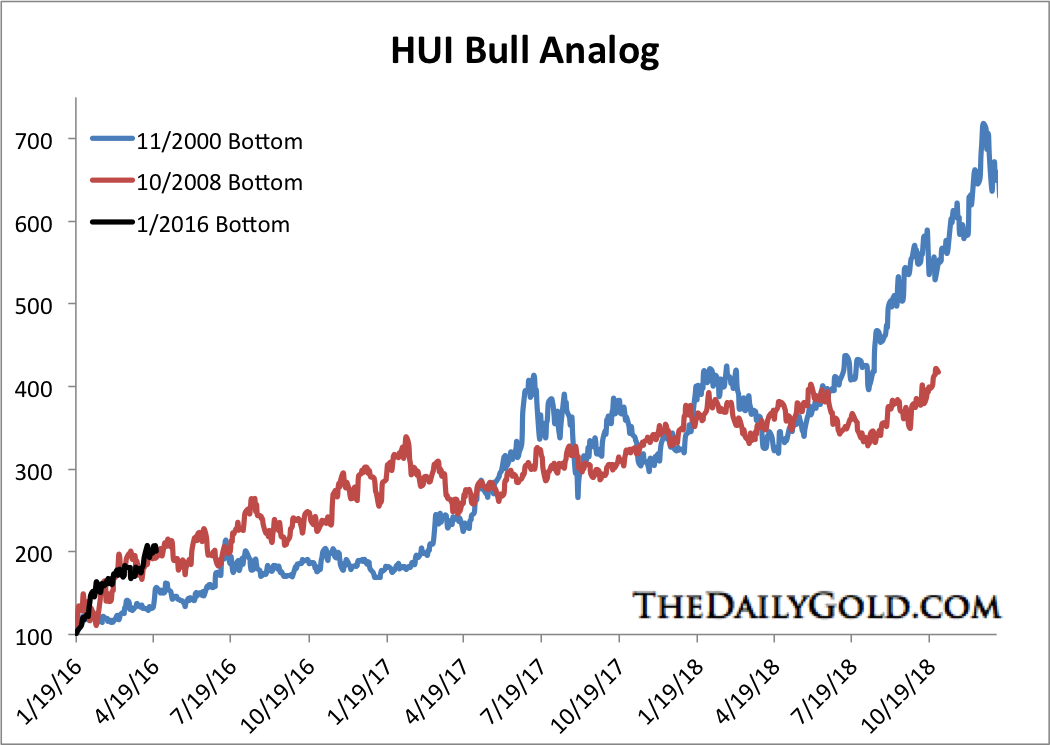
HUI Bull Analog
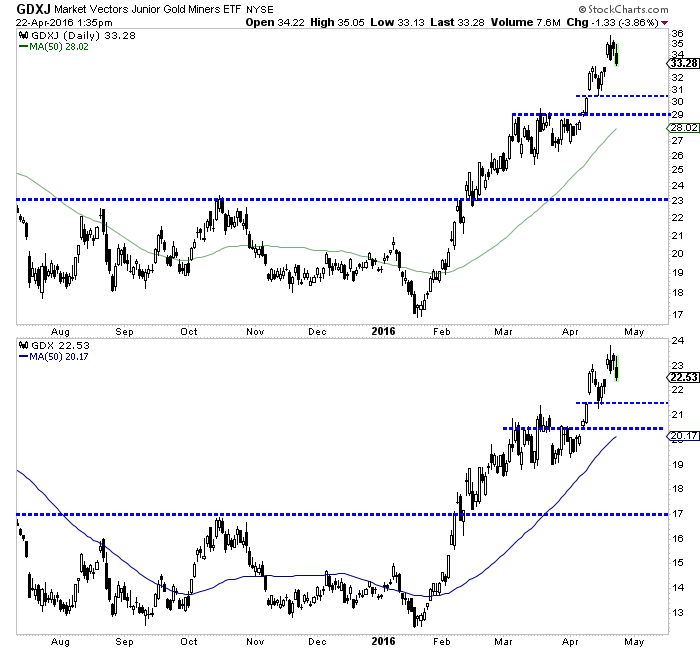
Turning to the present, it appears that those who have called for a correction could finally be correct. Both GDX and GDXJ appear to have completed an interim top in recent days. The miners are filling Tuesday’s gap and should test lower levels in the weeks ahead. GDXJ has initial support below $31 with strong support at $29 while GDX has initial support at $21.50 with strong support near $20.50.
If this weakness continues in the days and weeks ahead then it will only cause the already building wall of worry to grow. As the analog chart shows the gold stocks have had a very strong rally and are due for some correction. Better now rather than later when the correction would be much larger. The data shows a clear wall of worry has been building. That is no surprise considering gold stocks are only a few months removed from their worst bear market in 90 years! Readers are advised to carefully accumulate positions on weakness as forthcoming weakness may be your last chance at reasonable prices.
Jordan Roy-Byrne, CMT
also:

 Disnat GPS Commentary
Apple’s financial health is one of the best ever.
While official figures show a debt of over $50 billion and a debt/equity ratio greater than 0.40, Apple’s situation is actually much better than it seems. The company currently holds about $200 billion in cash.
That said, much of this cash is abroad, and if Apple decides to bring those profits back the United States, the amount would be taxed as profits made in the US (at a rate between 20% and 35%).
Although there are too many unknowns to make a precise calculation, even if taxed at 50%, Apple would benefit from funds that would be much greater than its debt.
We can therefore say that Apple has no net debt and clearly has a favorable cash position.
Although Apple is one of the most innovative companies in the technology sector and its range of products, which inspire new technologies, is very impressive (suggesting very promising potential sales), we must recognize that the iPhone, which represents 66% of sales, continues to have a crucial impact on the financial results of the company.
Geographically, sales are highly concentrated: 40% of sales come from the US, while China, which is experiencing the fastest growth in the world, already accounts for 25% of total sales.
With over 60% of sales made outside of the United States, a strong US dollar hurts the company’s sales and profits. We do not expect any major rise in the American dollar in the short term. If we are wrong, however, it is reassuring to know that Apple has managed to adapt to a strong dollar in recent years.
Financial Health

Growth
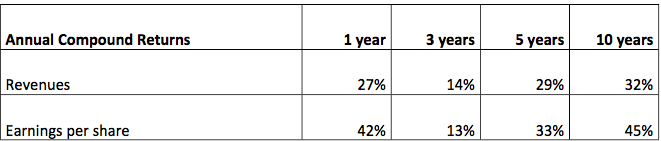
Apple’s revenue growth and earnings per share in the past five or 10 years shows that it has experienced a tremendous growth period for a large cap company.
This growth primarily comes from sales of its iPhone; in addition to representing 66% of total sales of the company, this device showed a solid growth of 52% in 2015.
In comparison, sales of PCs rank second; Mac accounts for 11% of total sales and has grown by only 6%.
Meanwhile, sales of the iPad tablet were down 23% and accounted for approximately 10% of total sales.
Geographically, sales in the US, which constitute almost 40% of total sales, experienced a strong growth of 17%, while China, which now accounts for a quarter of Apple’s sales, experienced an increase of 84% in 2015.
Although GDP growth in China is less than what was observed in previous years, we believe that the transformation of the Chinese economy to one based on consumers will continue to benefit companies like Apple.
Evaluation

Apple’s evaluation, and specifically its undervaluation, is one of the main reasons for our interest in the company.
In terms of price/earnings, price/future earnings and price/cash flow, Apple stock currently trades at a significant discount compared to its average over the past five years. In fact, with a P/E of 11.3, the stock would only be in line with its own average if it instantly rose by 25%.
In addition to trading at a discount to its own average, this stock also trades at a very deep discount to the S&P 500. In this regard, an instant increase of 50% in the stock would produce a price/earnings ratio equal to that of the S&P 500.
In other words, the market currently pays a lot less for $1 of Apple earnings than $1 earnings of an average S&P 500 company. We disagree with the idea that more than 250 companies in the S&P 500 have stronger prospects than Apple.
At Disnat GPS, we believe that the market is not evaluating Apple at its fair value, and we are very pleased to hold the stock at its current price in our portfolio of US equities.
Return on Investment

Dividend:
In 2012, Apple introduced a dividend which has increased every year since, and we are confident that this situation will last for many years. At the current stock price, the dividend represents a yield of approximately 2%.
Shares repurchase:
The company regularly repurchases its shares. In fact, over the past five years, Apple has bought over 15% of its outstanding shares. Apple still has a share repurchase program that it continues to use when the situation allows.
Investment:
Historically, Apple is not a company that has made large acquisitions, and we believe that this philosophy will continue to apply. As for internal investments, it must be understood that few new products or services can have a fast and strong impact on a company the size of Apple. However, as many consumers want to stay within the Apple ecosystem, we can be relatively optimistic and believe that some products (watches, televisions, etc.) could one day exhibit an attractive performance.
Company Description
Apple produces and markets numerous computer products, including smart phones, tablets, computers and MP3 players, as well as software and related services. The company is constantly developing new products and services like the Apple Watch, Apple TV and Apple Pay, whose sales could grow over the coming years.
Disclaimer
This Disnat GPS report is presented to you for general information only. Desjardins Group, Desjardins Online Brokerage (Disnat) and Disnat GPS assume no responsibility for any errors or omissions and reserve the right to modify or revise the content of this report at any time, without notice.
Financial and economic data, including stock quotes, analyses and interpretations thereof, is provided for informational purposes only and should in no way be regarded as a recommendation or advice to buy or sell any security or derivative.
It is possible that Desjardins or Desjardins Securities has published differing or even contrary opinions to what is expressed herein. These reflect the different views, assumptions and portfolio analysis methods used to produce them.
Desjardins Online Brokerage, its directors, officers, employees and agents will not be held liable for damages, losses or expenses incurred as a result of the use of information contained in this report.
All data comes from Morningstar (© Morningstar)

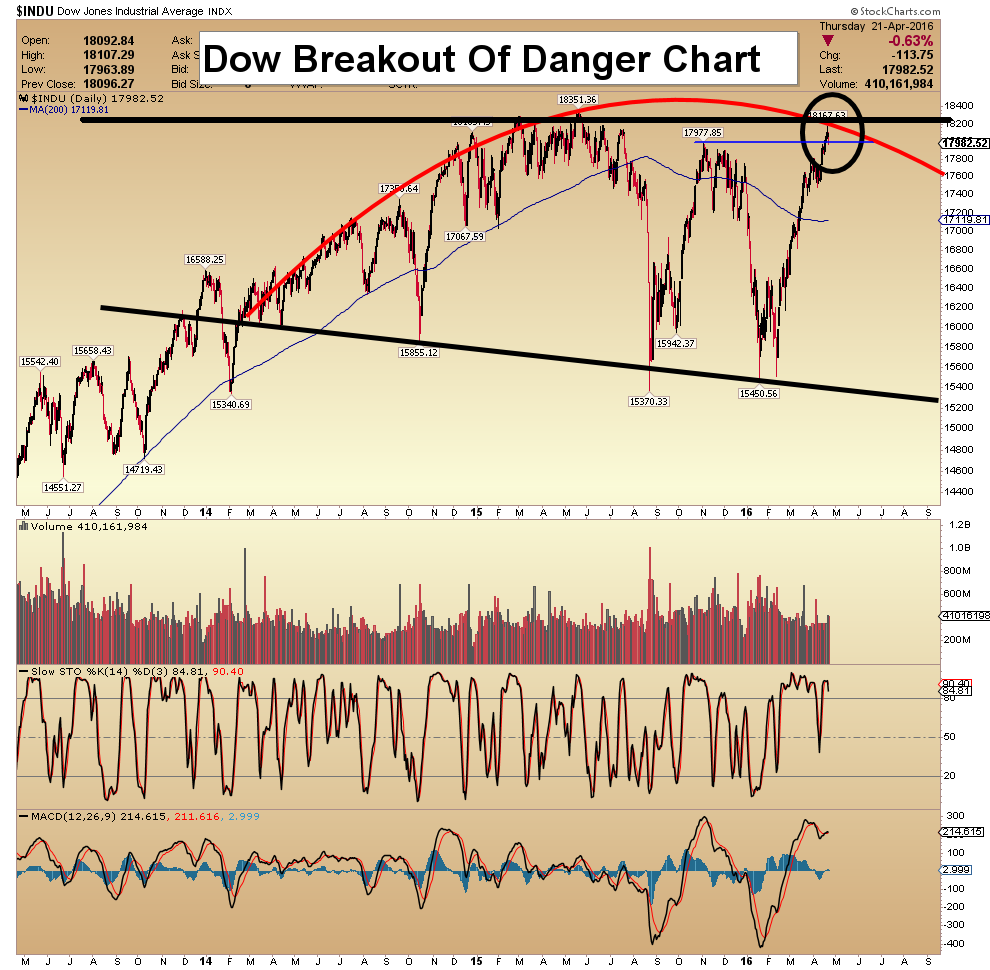
 Will the dollar continue to trend down and will it be enough to sustain a broader move in equities above their respective highs – is the follow up question for investors and traders alike. Over the near-term, the major benchmarks for the dollar continue to flirt with the lows from last fall; a spot we have speculated would provide support for a retracement bounce. Considering the strengthening inverse correlation that equities and the dollar have trended with since that time, the S&P 500 is now bumping up against its highs from last fall as well. Although the bounce in the dollar may move first, we do not believe the rally in equities is sustainable or represents a major breakout from the range the markets have remained within over the past 2 years.
 Fraud as a way of life caters an extravagant banquet of consequences.
This can’t be said politely: the entire status quo in America is a fraud.
The financial system is a fraud.
The political system is a fraud.
National Defense is a fraud.
The healthcare system is a fraud.
Higher education is a fraud.
The mainstream corporate media is a fraud.
Culture–from high to pop–is a fraud.
Need I go on?
We have come to accept fraud as standard operating practice in America, to the detriment of everything that was once worthy. why is this so?
Related:
Greenspan: Monetary policy has done everything it can
Today’s videos and charts (double click to enlarge):
US Bonds, Dollar & Stock Market Video Analysis –
Gold & Silver Bullion Video Analysis –
Precious Metal ETFs Video Analysis –
Trader Time Swing Trades Video Analysis –
Super Force Juniors Key Stocks Video Analysis –
Thanks,
Morris
The SuperForce Proprietary SURGE index SIGNALS:
25 Surge Index Buy or 25 Surge Index Sell: Solid Power.
50 Surge Index Buy or 50 Surge Index Sell: Stronger Power.
75 Surge Index Buy or 75 Surge Index Sell: Maximum Power.
100 Surge Index Buy or 100 Surge Index Sell: “Over The Top” Power.
Stay alert for our surge signals, sent by email to subscribers, for both the daily charts on Super Force Signals at www.superforcesignals.com and for the 60 minute charts at www.superforce60.com
About Super Force Signals:
Our Surge Index Signals are created thru our proprietary blend of the highest quality technical analysis and many years of successful business building. We are two business owners with excellent synergy. We understand risk and reward. Our subscribers are generally successfully business owners, people like yourself with speculative funds, looking for serious management of your risk and reward in the market.
Frank Johnson: Executive Editor, Macro Risk Manager.
Morris Hubbartt: Chief Market Analyst, Trading Risk Specialist.
website: www.superforcesignals.com
email: trading@superforcesignals.com
email: trading@superforce60.com
SFS Web Services
1170 Bay Street, Suite #143
Toronto, Ontario, M5S 2B4
Canada
###
Apr 22, 2016
Morris Hubbartt

-
I know Mike is a very solid investor and respect his opinions very much. So if he says pay attention to this or that - I will.
~ Dale G.
-
I've started managing my own investments so view Michael's site as a one-stop shop from which to get information and perspectives.
~ Dave E.
-
Michael offers easy reading, honest, common sense information that anyone can use in a practical manner.
~ der_al.
-
A sane voice in a scrambled investment world.
~ Ed R.
Inside Edge Pro Contributors

Greg Weldon

Josef Schachter

Tyler Bollhorn

Ryan Irvine

Paul Beattie

Martin Straith

Patrick Ceresna

Mark Leibovit

James Thorne

Victor Adair