
Stocks & Equities
Short term Elliottwave structure suggests wave “b” is proposed over at 18173.54. Decline from there is unfolding in a zigzag where wave (A) ended at 17580.38 as 5 waves diagonal. Near term, while wave B pullback stays above 17580.38, Index has scope to do another leg higher in wave C of (B) towards 17872.98 – 18028.26 area before the Index resumes the decline lower again. We don’t like buying the proposed bounce and expect wave (B) bounce to fail below 18173.54 for another extension lower.

Check out an offer from Elliottwave-Forecast.com
related: Is the most hated stock market bull ready to crumble?

 Something interesting has happened. China earlier this year responded to falling stock prices by borrowing a trillion dollars and spending it on commodities, boosting the prices of iron ore, oil, copper, etc., and giving the global economy a patina of recovery.
Nothing unusual so far. China did the same thing in response to 2008’s Great Recession, and the world breathed an appreciative sigh of relief, ignoring the massive new leverage that the policy involved.
Which is why the past month has been so interesting. Instead of just accepting China’s largess and blithely assuming that all was once again well, the global financial media have chosen (for perhaps the first time ever outside of a full-on crisis) to focus on the negative aspects of rising leverage. They’re now anticipating trouble for China, with titles like:
China’s debt problem is bigger than you think
Chinese banks grappling with ‘crisis level’ bad debts
CLSA Sees China Bad-Loan Epidemic With $1 Trillion of Losses
The $571 Billion Debt Wall That Points to More Defaults in China
To call thus unusual is a huge understatement. And it seems to have made a difference. Yesterday China announced a fairly radical course change:
Even China’s Party Mouthpiece Is Warning About Debt
(Bloomberg) – China’s leading Communist Party mouthpiece acknowledged the risks of a build-up of debt that is worrying the world and said the nation needed to face up to its nonperforming loans.
High leverage is the “original sin” that leads to risks in the foreign-exchange market, stocks, bonds, real estate and bank credit, the People’s Daily said in a full-page interview with an unnamed “authoritative person” starting on page one and filling the second page on Monday.
China should put deleveraging ahead of short-term growth and drop the “fantasy” of stimulating the economy through monetary easing, the person was cited as saying. The nation needs to be proactive in dealing with rising bad loans, rather than delaying or hiding them, the report said.
“Overall, the report suggests to us that future policy easing may be more cautious and that the government may try to hasten the pace of reform,” said Zhao Yang, chief China economist at Nomura Holdings Inc. in Hong Kong. Similar commentaries have had a “large impact” in the past, the analyst said in a note.
The pace of China’s accumulation of debt and dwindling economic returns on each unit of credit have fueled concern that the nation is set for either a financial crisis or a Japanese-style growth slump. Strong growth in mortgage lending means that banks could be exposed to significant losses should property prices drop sharply, Fitch Ratings said in a statement dated Sunday.
“A tree cannot grow up to the sky — high leverage will definitely lead to high risks,” the person was cited as saying. “Any mishandling will lead to systemic financial risks, negative economic growth, or even have households’ savings evaporate. That’s deadly.”
China’s accumulation of debt has been the fastest of Group of 20 members over the past decade, according to Tom Orlik, an economist for Bloomberg Intelligence. Debt has climbed to 247 percent of gross domestic product, Bloomberg Intelligence estimates.
Volatility in stocks and the foreign-exchange market early this year had partly reflected the vulnerability of the financial system, the article said.
The newspaper piece touched on the topic raised by Premier Li Keqiang of banks swapping debt for equity to cut excess borrowing by Chinese firms.
While bankruptcies should generally be avoided, “zombie” companies beyond salvage should be allowed to fail because debt-to-equity swaps would be costly and self-deceiving, the commentary said.
Supply-side reform will remain the focus of economic policies for the near future, the article said. While the economy can grow sufficiently without stimulus, its performance will be “L-shaped,” not a “U” or a “V,” for quite some time, rather than just a year or two, the commentary said.
Traders responded to this sudden honesty by selling pretty much everything:
Metals, Mining Stocks Sink as Chinese Data Signal Weak Demand
(Bloomberg) – Industrial metals fell while mining stocks dropped the most in six weeks as a slump in Chinese copper purchases and an increase in steel exports signaled weak demand in the top user.
The decline in commodities deepened on Monday after China copper imports fell from a record while exports of steel in the first four months rose 7.6 percent from a year earlier. Iron-ore futures in Asia plummeted after port stockpiles in China expanded to the highest in more than a year.
“A morning of widespread price retreats along with iron ore as Chinese demand appears to stumble again,” Michael Turek, the head of base metals at BGC Partners Inc. in New York, said in an e-mail. “April’s lower copper imports raises questions about the March spike.”
Copper futures for July delivery dropped 2 percent to $2.111 a pound at 10:42 a.m. on the Comex in New York, after earlier touching $2.1025 a pound, the lowest in almost a month.
The Bloomberg Americas Mining Index slumped as much as 4.8 percent in New York, the steepest intraday decline since March 23.
Some Thoughts
China is the latest in a growing line of “command and control” economies that have risen to prominence, captured the imagination of people who find free markets too messy for comfort, and then blown up when it turns out that dictators have no idea how to allocate capital.
First it was the Soviet Union, which looked during its initial decades like a viable alternative to market-based systems. From journalist Lincoln Steffens’ famous 1919 observation “I have seen the future and it works” to the 1957 launch of Sputnik, an amazingly-large number of people assumed that it was possible for a handful of men sitting around a conference table to efficiently organize a modern economy. It eventually became clear that they were wrong.
Then came Japan, which emerged from the rubble of WWII to become a global economic power, largely be grafting its semi-feudal samurai tradition onto factory life — under the direction of its Ministry of International Trade and Industry (MITI). That is, guys sitting around a table deciding what gets built where. This resulted in an epic debt and mal-investment binge from which Japan may never recover.
And now comes China’s hybrid Japanese/Soviet model, with various Communist Party organs and shadow banking system entities directing investment from the top down, borrowing immense amounts of money and plucking growth figures out of thin air, which Western media accept at face value. It too seems to be failing, which should come as no surprise but — given the numbers involved — should scare the hell out of anyone with a sense of history.
related: Central Banks Roil Markets M/T Editor

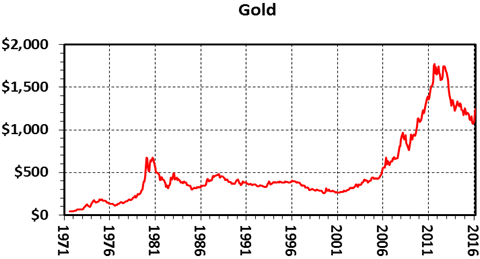
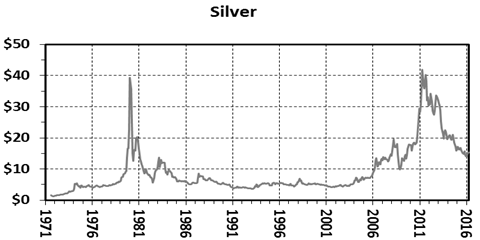
The gold to silver price ratio determines the relative value of the two precious metals and is a useful parameter in deciding which metal to buy at any given time (Mercenary Video, March 19, 2016).
In two previous musings, I first documented the history of gold, silver, and the US dollar from the establishment of a national monetary system in 1792 until abandonment of the gold standard in 1971 (Mercenary Musing, April 25, 2016); then price histories and gold-silver ratios from the United States’ abandonment of the gold standard in 1971 to present (Mercenary Musing, May 2, 2016).
In the final installment of this trilogy, let’s revisit the modern-day paradigm and focus on the distribution of gold-silver ratios over the past 45 years.
Here again are the monthly average price charts for each metal and gold-silver ratios since August 1971:
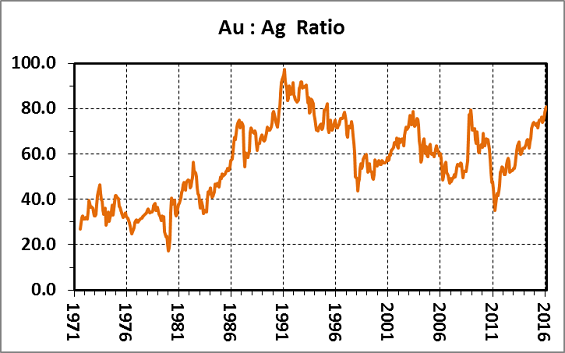
Our data set covers nearly 45 years (537 months). The distribution of ratios follows in both chart and tabular format:

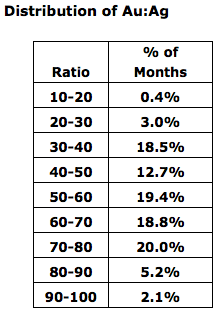
I glean the following from the post-gold standard distribution of gold-silver ratios:
- A ratio of less than 20 is a rare outlier that occurred for only two months in 1980 when both gold and silver went exponential and silver markets were being manipulated by the Hunt Brothers’ speculative attempts to corner worldwide control of the metal.
- Ratios between 20 and 30 are quite unusual at 3.0% of the record. They occurred in the first two months after Nixon did his deed in 1971; for one month in 1974; for eight months in 1976 when gold corrected and silver was flat; and for five months in late 1979 and early 1980 when both metals were in exponential moves up then silver collapsed.
- Ratios from 30 to 40 (18.5%), 50 to 60 (19.4%), 60 to 70 (18.8%), and 70 to 80 (20.0%) are common and almost evenly distributed in the price records.
- Paradoxically, the middle increment from 40 to 50 comprises only 12.7% of the total months in our study.
- Ratios from 80 to 90 constitute 5.2% of the record. Almost all occurred during a three-year period from September 1990 to November 1993 when there was an oversupply of silver stocks, industrial demand was down, and prices languished from $3.65 to $5.00 an ounce.
- Other than the three-year period mentioned above, there were only two months, in March 1995 and March 2016, when the monthly average ratio was above 80.
- Ratios greater than 90 make up 2.1% of the record and also happened in that 1990-1993 interval. The ratio averaged over 97 in February 1991, a value that was exceeded only in 1939 at the end of the depression and beginning of World War II.
Our documentation of ratios since August 1971 debunks the propaganda that comes from hard-core silver bugs about the metal’s relative value to gold.
From a compendium of sources, the average abundance of gold in Earth’s crust is about 4 ppb while silver is about 70 ppb, for a ratio of 1:17.5. Based on these crustal abundances, silver perma-bulls promote a platform that gold-silver ratios should be less than 20.
Their argument is also based on historic gold-silver ratios from late 1792 to 1890 when there was bimetallic backing of the US dollar and/or attempts to control silver prices with coinage legislation, and a two-month period during the parabolic top of precious metals prices in early 1980.
Ergo say they, the price of silver is constantly manipulated, silver is woefully undervalued, and it is always on the verge of a major breakout.
However, silver aficionados ignore important facts regarding supplies, demand, and uses of the two radically different metals:
- Silver is mostly used as an industrial metal (54%); much of that yearly demand is consumed and a relatively minor amount is recycled.
- Gold is a precious metal; 90% is used in jewelry and investments and 10% in industrial applications.
- An estimated 98% of all the gold ever mined in the world remains available and held in jewelry, by central banks, in private hoards, and as fabricated products (source: USGS).
- Cumulative historic world production of silver and gold is estimated from various sources to be about 9.2:1 (1,690,000 tonnes versus 182,000 tonnes).
- For the past 11 years, the ratio of silver to gold mined is about the same at 9.0:1 (258,000 tonnes versus 28,600 tonnes from 2005-2015).
- About 70% of new silver is a by-product from base metal or gold mines; therefore, silver production is largely dependent on the prices of these primary metals.
I conclude that since August 1971 when gold was partially freed from the US dollar on world exchanges, Earth’s crustal abundances, historic fixed-price relationships, and mine production have had no influence on the gold-silver ratio.
Instead, the relative prices of gold and silver are driven by:
- Industrial demand for silver and the vast amount of available above-ground stocks of silver held by hoarders and speculators.
- The health of the world economy and geopolitical events.
- Central bank transactions and safe haven hoarding of gold.
- Speculative traders moving in and out of physical and paper markets of both metals.
In my opinion, gold is the only real money, and it is my safe haven and insurance policy against financial calamity.
Although silver functions mainly as an industrial metal, it is strongly tied to the price of gold and is generally more volatile during upside and downside moves of the yellow metal. In times of financial distress and economic calamity, silver tends to behave more like a precious metal with widespread hoarding of gold trickling down. For this reason, it is often called the “poor man’s gold”.
The gold-silver ratio lends valuable guidance to ascertain whether one metal is over- or undervalued with respect to the other. The rarity of a daily gold-silver ratio above 80 is evidence that silver is severely undervalued and is a strong buy signal for the metal.
My fundamental idea is to buy silver during instances of very high ratios and then trade most of it for gold when the ratio corrects and reverses to the other side. I suggest that a range of 40 to 50 is apropos. Note however, that mark-ups to buy or sell silver are always substantially higher than for gold and the additional cost becomes a factor in the evaluation process.
I strive to have 10-20% of my net worth in physical bullion, mostly in gold but always a portion in platinum and silver.
As a hoarder, my basic strategy for accumulating gold is to buy during downticks in its price regardless of a bull or bear market cycle. In a previous musing, I showed that there is seasonality to the gold price and that the best time to buy is from mid-June to mid-August of any given year (Mercenary Musing, January 4, 2016).
That folks, is the way I see it.
And the way I do it.
Ciao for now,
Mickey Fulp
Be sure to read Eight “New Normal” Charts That Are Insanely Abnormal–and Dangerous M/T Ed

 The stock market has now “exhausted itself” and it’s time to “get out.”
On gold: “Some regard it as a metal, we regard it as a currency and it remains our largest currency allocation.”


-
I know Mike is a very solid investor and respect his opinions very much. So if he says pay attention to this or that - I will.
~ Dale G.
-
I've started managing my own investments so view Michael's site as a one-stop shop from which to get information and perspectives.
~ Dave E.
-
Michael offers easy reading, honest, common sense information that anyone can use in a practical manner.
~ der_al.
-
A sane voice in a scrambled investment world.
~ Ed R.
Inside Edge Pro Contributors

Greg Weldon

Josef Schachter

Tyler Bollhorn

Ryan Irvine

Paul Beattie

Martin Straith

Patrick Ceresna

Mark Leibovit

James Thorne

Victor Adair