
Stocks & Equities
Marc Faber and Frank Berlage discuss what investors should look for in 2016. They speak to Bloomberg’s Joe Weisenthal and Scarlet Fu on “What’d You Miss?”
related by Marc: How Terror Impacts Markets 2016
About Dr. Marc Faber
 Marc, the author of the Gloom, Boom and Doom report is a world class Investor, Doctor Faber ‘s typically controversial and contrarian views have earned him the label of Dr. Doom. Doctor Doom also trades currencies and commodity futures like Gold Natural Gas and Crude Oil.Even his harshest critics must admit that he’s been unerringly correct in his market forecasts over the past three decades .

The VIX gave up 0.98 points last week to close at 14.72 after peaking on the expected short-term cycle high on Wednesday. Since March, the VIX has been turned back by resistance at 16.40 several times highlighting the importance of this level. A breakout from 16.40 will be very bearish for equities. Last Friday was an expected 34-day cycle low. The weekly Coppock is very oversold warning of a tradable rally in the VIX (bearish equities).

related:

For those that understand how metals trade, it is quite clear that they move to extremes. And, the main reason this is so is due to the driver of the metals market being emotionally based. Yes, you heard me right. The driver is not market crashes, or world-wide debt, or inflation, as so many have tried to sell you upon. Rather, emotion is what drives this market, and when you can understand how to track such emotion, you can have a better handle on how it may move. This is the main reason why it often pushes us to the edge of our expectations, and is driven to extreme movements.
This past week, I noted how we were going to begin the week at an extreme, and the complex was on the precipice of either a break down or break out. Our primary expectation was that it was going to break down into a corrective phase, and, thus far, the market has followed through.
But, we are not out of the woods just yet. It is still “possible” that the markets may continue to break out, so let’s go through what we need to look for in the coming week.
Again, the GDX presents us with the cleanest picture of the market, so I will begin there. As noted last weekend, it would take a strong move through the 28 region to signal we are heading to the 40+ region sooner rather than later.

But, the GDX turned down right at the top of the market pivot on our daily chart, and seems have begun a corrective retracement. What supports this perspective is that the rally off the low struck on Wednesday this past week began in corrective fashion, was followed by what seems to be a triangle consolidation, with an impulsive (c) wave rally continuing thereafter, all of which I am counting as a b-wave rally.
My preference is to see the GDX maintain below the 25.80 region in the upcoming week, and then drop down below 23, which I will count as the (a) wave in the blue wave ii.
As you can see, the alternative count would suggest that we are already in wave 2 of wave iii, but I will need to see confirmation of that perspective before being able to adopt it. If GDX would be able to strongly exceed the 25.80 region, and then rally through the 26.60 level, that would be an initial indication that this “correction” has completed, and we will be watching the all-important 28 region for cues as to whether we are heading directly to the 40+ region. Again, this is not my primary expectation, but I do have to respect the manner in which the metals move, having much experience in this arena.
As far as GLD, that too seems to be completing its b-wave rally, which may have one more push higher in the coming week before it “should” turn down. As noted last weekend, resistance is between 125-126, with only a strong break out through the 129/30 region suggesting the correction is over and another major leg up is in progress.
Lastly, with regard to silver, I am still in between several potential counts, as you can see from the chart, and which has been outlined over the last several weeks. The 16.90-17.10 region remains support and upside is still open as long as we do not break that support. Should that support break, then we are either in a i-ii, 1-2 structure (blue count), or the outside chance remains for a lower low (red count). And, as I noted before, should we see a break of support, I will discuss the other counts more extensively in a mid-week update.
See charts illustrating the wave counts on the GDX, GLD and YI at https://www.elliottwavetrader.net/scharts/Charts-on-GDX-GLD-YI-201605081261.html.
related: Misreading the COT’s Again

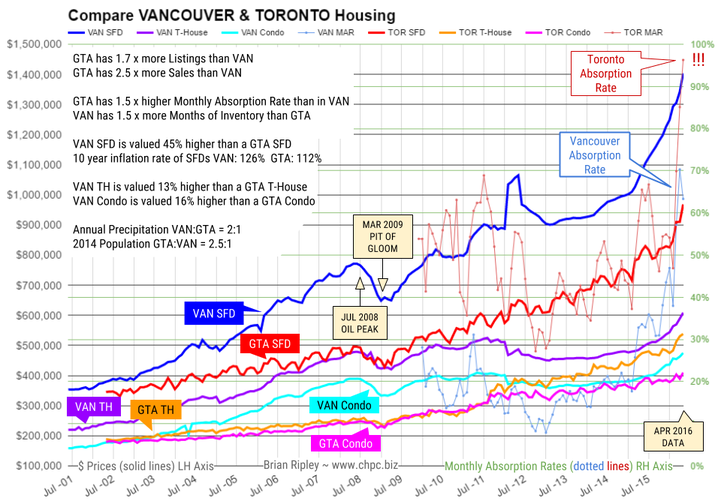
Higher Average Prices in Vancouver than GTA:
45% more for a SFD
13% more for a Town House
16% more for a Condo
related:

A quick way of reducing risk and increasing opportunities plus Oil, Gold & Stock Market analysis.
Summary:
1. Key Tool:
It is such a key tool, and with Tyler’s method you can look at a chart of anything from an individual company to real estate and quickly determine where it is likely to go. Basic principles in analysis of charts reveal a great reflection of what the market thinks of the fundamentals of a company or market.
2. Oil Gaining Momentum:
Presently, the Oil chart shows that momentum to the upside is waning. Why the easy money has been made to the upside.
3. Gold Long Term Switching From Bear to Bull:
Last week shows a turnaround from Bear to Bull. First there was a break of the downward trend-line, then the build-up of a rising bottom indicating optimism followed by an abnormal break to the upside in the last week of April. Though Gold looks like it wants to continue the upward momentum, Tyler explains why Gold stocks are risky here.
4. There’s a 70% chance that the Dow will run to its April highs:
The Dow Jones Industrials has had a great run up from the low in February 2016. Though that great rally has brought the stock market up into overhead resistance there’s a very good chance its going higher. The question is whether the risk is worth the reward.
 About Michael Campbell:
One of Canada`s most respected business analyst, Michael is best known as the host of Canada’s top rated syndicated business radio show MoneyTalks. Each week Campbell conducts interviews with important people from business and finance from internationally renowned analysts like James Dines, Martin Armstrong, Eric Coffin, Greg Weldon, Mark Leibovit, Dennis Gartman and many more. Michael’s Inside Edge subscribers have made, and perhaps more importantly, saved money based on his analysis of market trends and opportunities. Including advocating picking up blue-chip dividend paying stocks in every major dip since 2011, getting out of gold in September of 2012, recommending $US denominated assets in Dec of 2013, and getting out of oil stocks in Jan of 2014.

-
I know Mike is a very solid investor and respect his opinions very much. So if he says pay attention to this or that - I will.
~ Dale G.
-
I've started managing my own investments so view Michael's site as a one-stop shop from which to get information and perspectives.
~ Dave E.
-
Michael offers easy reading, honest, common sense information that anyone can use in a practical manner.
~ der_al.
-
A sane voice in a scrambled investment world.
~ Ed R.
Inside Edge Pro Contributors

Greg Weldon

Josef Schachter

Tyler Bollhorn

Ryan Irvine

Paul Beattie

Martin Straith

Patrick Ceresna

Mark Leibovit

James Thorne

Victor Adair