
Gold & Precious Metals

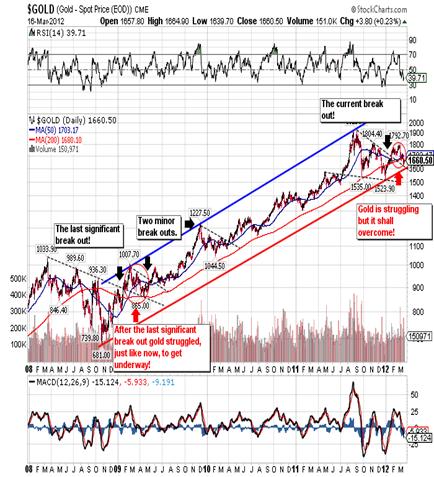
With gold more than $250 off its August 2011 peak, today’s chart provides some long-term perspective in regards to the gold market. Today’s chart provides an illustration of the bull market in gold that began back in 2001. As today’s chart illustrates, the pace of the 11-year bull market has increased over time. However, over the past seven months the price of an ounce of the shiny metal has declined more than at any point since 2008. This latest pullback has brought gold down to support (green line) for a second test of its three-year accelerated trend channel. So while the upward trend in gold is still intact, the accelerated trend is once again being tested.
Notes:
Even the bulls are turning bearish on gold prices. Or rather, they’d like to.
“Everything’s beginning to look as if it’s turning the corner, we’ve passed the point of maximum despair,” reckons Nick Moore, head of commodity research at state-owned Royal Bank of Scotland in London. He cut the bank’s bullish 2012 forecasts for all precious metals except goldback in January.
But now, “A number of things which would have kept people with an eye on the upside for gold have now been neutralized.” And despair over, gold must be fated to sink, right? Not quite.
“Gold can now settle back,” Moore tells Bloomberg, plumping a cushion and fetching a foot-stool.
Over at Mineweb, “Is gold now the contrarian play?” asks Geoff Candy, pretty much answering his own question by asking it, and also noting that analysts pointing to “warning signs” can only find “fairly optimistic” ones for gold prices.
“The one danger with gold is that the bullish consensus on gold is now higher than it’s been at any time for the last two or three decades,” says former base-metal trader (and Eurocrat nemesis) Nigel Farage, speaking to Eric King. Markets do whatever it takes the screw the most people the most, of course. But while “there is a danger that the short-term speculative market finds itself a bit long of gold,” says Farage, the outcome really isn’t that bad.
“You can’t discount – when a market is shaped that way – that it could have a dip.”
Jeez, let’s fetch it a towel and a bathrobe! Won’t anyone call gold’s bull market dead?
“Ten years ago gold was not owned by retail investors but was primarily held by central banks,” says UK asset manager Armstrong Investment, overlooking the world’s biggest holders both then and now – Indian households. “Strong performance, uncorrelated returns with other asset classes and the advent of easily-accessible ETFs have seen investors make ever-increasing allocations to the precious metal.” SocGen strategist Dylan Grice agrees, also noting that “Gold just isn’t the misunderstood, widely shunned asset it was a few years ago. Isn’t the gold bull market now long in the tooth, with better opportunities to be found elsewhere?”
But again, both analyses find more cause to stay long of gold than sell it, let alone short it. Grice because the real crisis – the final calamity awaiting Western state finances – still awaits. Armstrong because “an allocation to gold [still] makes sense in a diversified portfolio.”
Still, “Investors should not view [gold] as a safe haven without its own inherent risks.” Most notably because its correlation with equities – the way it moves in (or out) of line with stock markets – has risen to what seems a high level since risk assets bottomed in early 2009.
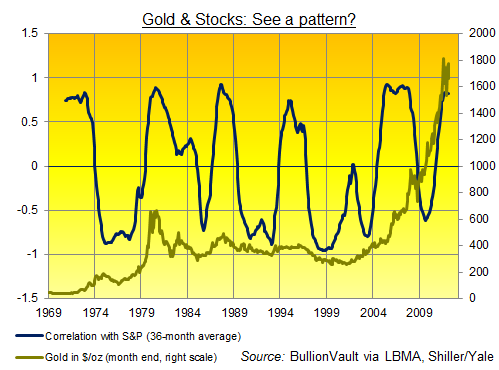
“Over the long term,” says Armstrong, “gold has been a perfect portfolio diversifier – positive returns with no correlation to traditional asset classes. [But] over the past three years gold priceshave shown a correlation of 0.8 with the S&P500.”
Now, gold and the US stock market would show a correlation of +1.0 if they moved in lock-step together. They’d show a perfectly negative correlation of –1.0 if they moved in precisely opposition. So the three-year reading of +0.8 does indeed suggest gold has lost a good chunk of its risk-spreading power, moving higher as stocks have also moved up and threatening a sharp drop if equities now lose their mojo.
Look again at the chart, however. Because this strong correlation is hardly unknown. And while the current three-year correlation of +0.8 has been maintained for seven months so far, it was achieved (and breached) for 33 months in 2005-2008…nine months in 1987…and 11 months back in 1980.
What really matters is the huge swings in between. See, all told, and since gold prices began to move freely in the late 1960s, gold has moved in the same direction as stocks – on a quarterly basis – for pretty much half the time. It’s gone the other way for pretty much the other half, leaving gold a great diversifier overall. Neither positive nor negative. Just unrelated.
Or as a statistician would put it, the rolling 12-month correlation between Dollar gold and the S&P 500 index has been 0.04. That’s as good as zero. There’s really very little link between gold and equities long term. And what link there is comes through, say, a strong correlation today, and then strongly inverse correlation tomorrow. Net-net the result comes out at sweet nothing. Provided you buy and hold for the long run, rather than daring to time a move in (or out) on where the latest correlation now stands. Or where you judge the rest of the world to be, relative to the 11-year bull market in gold prices.
Looking to start or add to your gold bullion holdings today…?
The S&P 500 is nearing resistance and the precious metals sector is testing its December low. A successful retest of the low in many markets (juniors, metals, silver stocks) should be a signal that the market has confirmed its bottom. Unless you feel the bull market in precious metals is over then you should use this opportunity to be a contrarian. We may not get another buying opportunity like this for a few years.
PRECIOUS METALS ARE DECOUPLING FROM THE STOCK MARKET
Normally, decoupling from the stock market is a good thing. In recent turbulent times, many have wondered if emerging markets would decouple or if gold stocks would decouple. Its surprising to see gold stocks decouple from a strong stock market. Many wondered if the sector would decouple from a weak market. Yet, the decoupling now could be positive long-term provided the decoupling continues when the stock market peaks just below the 2007-2008 highs.
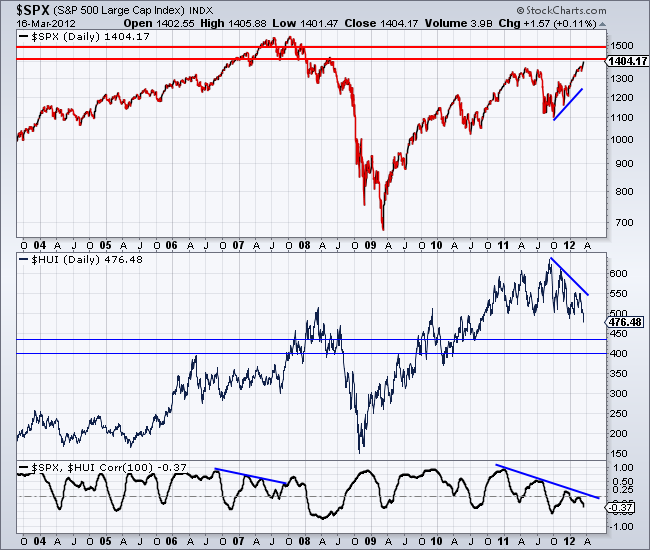
Below we plot the S&P 500 and the HUI Gold Bugs Index. At the bottom we show the 100-day correlation between the two markets. Note that the correlation has been trending down since the end of 2010. The broad stock market (S&P 500) appears to be headed for a test of major resistance at 1500 while the large cap gold stocks just closed at a 52-week low.
Although large cap gold stocks have closed at a new low, the rest of the sector has not followed suit. The chart below shows GDXJ, the CDNX (Canadian venture exchange) and SIL (silver stocks ETF). While the HUI has closed at a new low, the other markets remain well above their December lows. The CDNX and SIL are showing a strong divergence since October.
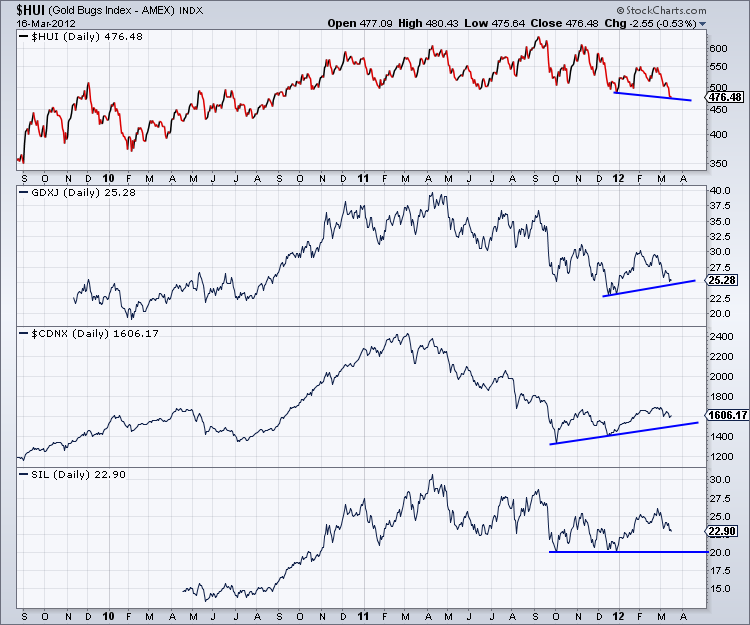
Should most of the precious metals sector hold its December lows then it will be very encouraging for the sector even with the large caps breaking to new lows. One can recall 2007-2008 when the speculative side of the sector fell to new lows well ahead of the metals and the large cap gold stocks. One should also keep the 1970s in mind. Large cap miners experienced significant gains at the start of the bull market but not at the end. Sure, the large caps performed well from 1974-1980 but it was the speculative side of the sector that captured the vast majority of the gains.
Presently, the precious metals sector has underperformed badly as the stock market has continued to move higher. We know that it is highly unlikely the S&P 500 is going to make new highs. In fact, in two of the previous three secular bear markets, the market in the second half of the bear rallied to within 5% of the all-time high before falling back into a mild 4-5 year bear market. This happened in 1909 and 1976. Profit margins, the most mean reverting statistic in finance are already at record highs. Higher interest rates and higher inflation will cut into profit margins.
Everyone loves stocks now and the masses can forget about gold stocks. This is a perfect contrarian opportunity for precious metals investors. The S&P 500 is nearing resistance and the precious metals sector is testing its December low. A successful retest of the low in many markets (juniors, metals, silver stocks) should be a signal that the market has confirmed its bottom. Unless you feel the bull market in precious metals is over then you should use this opportunity to be a contrarian. We may not get another buying opportunity like this for a few years. We invite you to learn more about our service.
Good Luck!
Jordan Roy-Byrne, CMT
Jordan@TheDailyGold.com“>Jordan@TheDailyGold.com” data-mce-href=”mailto:Jordan@TheDailyGold.com“>Jordan@TheDailyGold.com
TheDailyGold.com
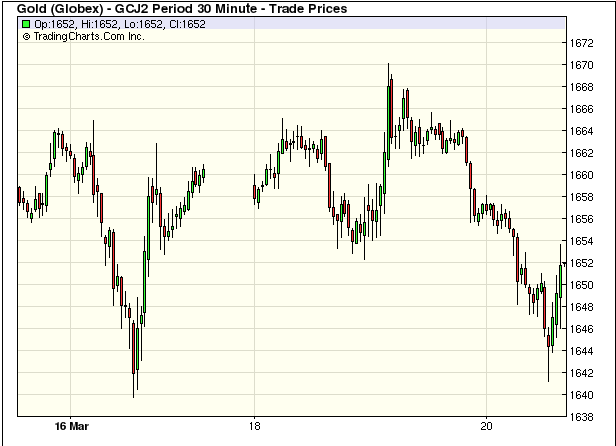
After Mar. 20 Close:
TSE Gold Index Seasonality:
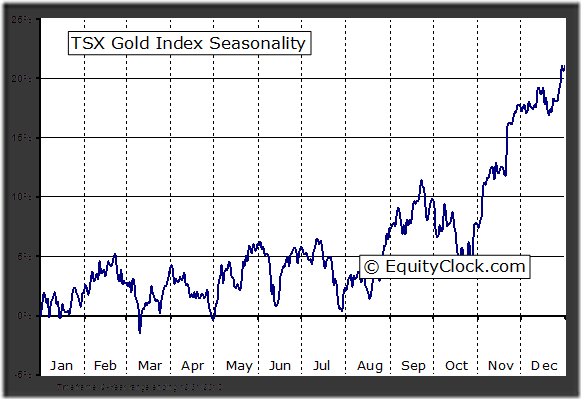
Via Don & Jon Vialoux’s Equity Clock
Good As Gold!
Just as a matter of reference on January 1, 2010 the Dow was at 10,550 so to date it has risen 25.42% while gold has moved from 1,100.00 for a gain 50.54%! So in spite of the Fed’s best efforts to pump the stock market up with a barrage of fiat currency while at the same time suppressing the price of gold with relentless intervention, gold has out performed the Dow two to one!! That tells you all you need to know.
They say a picture is worth a thousand words so if that’s true
…..read the rest & view more charts HERE
(also don’t miss Mark Leibovits daily gold comment HERE
A Big Relative Decline
Since April of 2011, gold stocks have entered a notable downtrend relative to the prices of gold and silver. Various theories have been advanced as to why this is the case and all of them have some merit (e.g. the fact that ‘resource nationalism’ is increasing all over the world, that costs are ratcheting higher, that metal-backed ETFs give investors exposure to the metals while avoiding the hassles gold mining companies have to deal with, and so forth).


-
I know Mike is a very solid investor and respect his opinions very much. So if he says pay attention to this or that - I will.
~ Dale G.
-
I've started managing my own investments so view Michael's site as a one-stop shop from which to get information and perspectives.
~ Dave E.
-
Michael offers easy reading, honest, common sense information that anyone can use in a practical manner.
~ der_al.
-
A sane voice in a scrambled investment world.
~ Ed R.
Inside Edge Pro Contributors

Greg Weldon

Josef Schachter

Tyler Bollhorn

Ryan Irvine

Paul Beattie

Martin Straith

Patrick Ceresna

Mark Leibovit

James Thorne

Victor Adair