
Gold & Precious Metals
“While what happened looks disastrous, we don’t think that this means the end of the great, secular bull market in precious metals.”
What happened on Friday, April 12 and Monday, April 15 on gold and silver markets looked like a gigantic earthquake – a drop of about $200 (13%) for the yellow and almost $5 (18%) for the silver metal. There has been a lot of hyperbole going on. We even heard it said that a move of that scale would statistically only be expected “once every 4,776 years.” Going even further, John Kemp of Reuters calculates that, based on a normal distribution (by the way, market returns are not normally distributed), movements like this can be expected once in every 500 million trading days, or two million years. Sounds far-fetched?
There have been plenty of attempts to explain the cause of this enormous plunge. China’s economy grew “only” 7.7% in the first quarter, undershooting market expectations for an 8% expansion. China is the world’s second largest buyer of gold. There were concerns that the U.S. stimulus may be cut short since minutes of the Fed released just before the big decline in gold prices showed some officials were interested in ending the QE program this year. Another theory posits that since the new Japanese central bank governor promised to re-inflate the Japanese economy, Japanese government bonds (JGBs) have been on a wild ride. When investors in volatile assets are asked to put up wider margins they often sell assets they are holding. In this case, CME’s decision to raise margins for the entire precious metals sector is another bearish factor for the short term.
While what happened looks disastrous, we don’t think that this means the end of the great, secular bull market in precious metals. Bull markets have a parabolic stage when everyone is in a frenzy to get in and prices go up in a straight line. We have yet to see that spike.
Furthermore, we don’t see any changes in the fundamentals for gold and silver to make us think the bull market is over. There is still large unemployment, ballooning national debt, currency debasement and currency war, eurozone problems, QEs etc. etc. We like gold and silver for the same reasons we have liked them for the past decade.
The fundamentals are intact which ‘forces’ silver to rally in the long run but let us now turn to today’s technical portion to see whether recent events have marked the final bottom in the white metal or rather further declines are to be expected – we’ll start with silver’s long term chart (charts courtesy of http://stockcharts.com).
Click on the chart or HERE for a larger chart:

We don’t see the same corrective price action as we saw for gold – the yellow metal rallied for 7 out of last 8 days. Silver prices declined this week, except for a quite substantial move up on Thursday.
Overall, declines simply continue here (there was a small pullback within the 2008 decline as well); gold prices corrected quite a bit and silver did not. If this underperformance continues and gold prices move lower by $100 or so, the implication appears to be that silver will decline sharply to perhaps the $18 level or so. This price level is created by the July local bottom and the declining trend channel (parallel, green lines on the chart above), and the price level where the huge 2010 to 2011 rally began.
Let us now move on to the short-term timeframe.
Here, in the short-term SLV ETF chart, the underperformance of silver is very clearly visible. While there has been some sideways trading, prices have declined overall, and the lack of any real pullback indicates the overall weakness of this market at the present time.
Given Thursday’s close in the SLV ETF at $23.49 (silver at $24.30), we still see no significant change in silver’s performance – its correction is still very small compared to the one seen in gold.
Since silver’s underperformance is such an important issue at this time, we decided to examine it particularly closely, using silver-to-gold ratio.
Click on the chart or HERE for larger chart:

In today’s silver to gold ratio chart, we present a somewhat new view of this ratio. We’ve discussed the underperformance of silver for some time now so we felt this graphic would be useful. We believe it’s best to plot the rate-of-change indicator (ROC) on this ratio as it does a very good job at measuring sharpness of given moves. The solid line in the chart is the ratio itself with gold’s daily price in the background and represented by the gold line.
The key point here is this: major bottoms used to be preceded by a sharp drop in the silver to gold ratio. We used to see either capitulation of silver investors or artificial sell-offs before the declines were over. Regardless of what the reasons were, it’s something that used to happen before the bottom was truly in. Recently, however, we saw silver’s price decline, but not as sharp as expected relative to gold if a major bottom was forming. In the recent days, we have seen steady underperformance rather than a very sharp drop in the ratio. It looks on the chart like the trend is accelerating, though, sort of like a reversing parabola.
Ideally, we’d like to see a lower rate-of-change indicator, say -10 or -15 at least before stating that the final bottom is in. This indicator barely moved when the precious metals declined heavily earlier this month. The declines seen in 2008 and in the first 2 months of 2010 provide a good example of what the indicator can do. At first, metals declined but silver not as significantly as gold. Only when gold formed a major bottom, did the ratio decline sharply. We would like to see this confirmation also in case of the current decline.
Summing up, silver has been underperforming recently but not as extremely as we would expect during a major bottom. It seems therefore that the final bottom is still ahead of us. Thursday’s move to $24.30 doesn’t invalidate the above.
To make sure that you are notified once the new features are implemented, and get immediate access to our free thoughts on the market, including information not available publicly, we urge you to sign up for our free gold newsletter. Sign up today and you’ll also get free, 7-day access to the Premium Sections on our website, including valuable tools and charts dedicated to serious Precious Metals Investors and Traders along with our 14 best gold investment practices. It’s free and you may unsubscribe at any time.
Thank you for reading. Have a great and profitable week!
Przemyslaw Radomski, CFA
Founder, Editor-in-chief
Gold Investment & Silver Investment Website – Sunshine Profits
* * * * *
About Sunshine Profits
Sunshine Profits enables anyone to forecast market changes with a level of accuracy that was once only available to closed-door institutions. It provides free trial access to its best investment tools (including lists of best gold mining stocks and silver mining stocks), proprietary gold & silver indicators, buy & sell signals, weekly newsletter, and more. Seeing is believing.
Disclaimer
All essays, research and information found above represent analyses and opinions of Przemyslaw Radomski, CFA and Sunshine Profits’ associates only. As such, it may prove wrong and be a subject to change without notice. Opinions and analyses were based on data available to authors of respective essays at the time of writing. Although the information provided above is based on careful research and sources that are believed to be accurate, Przemyslaw Radomski, CFA and his associates do not guarantee the accuracy or thoroughness of the data or information reported. The opinions published above are neither an offer nor a recommendation to purchase or sell any securities. Mr. Radomski is not a Registered Securities Advisor. By reading Przemyslaw Radomski’s, CFA reports you fully agree that he will not be held responsible or liable for any decisions you make regarding any information provided in these reports. Investing, trading and speculation in any financial markets may involve high risk of loss. Przemyslaw Radomski, CFA, Sunshine Profits’ employees and affiliates as well as members of their families may have a short or long position in any securities, including those mentioned in any of the reports or essays, and may make additional purchases and/or sales of those securities without notice.

 , who will be Michael Campbell’s guest on Money Talks April 27th, who also predicted a commodity rally in 1999, said he may buy gold if a bear market deepens and prices fall to $1,300 an ounce or below
Bullion for immediate delivery tumbled to $1,321.95 on April 16, the lowest since January 2011, stoking a frenzy among coin and jewellery buyers from the US to India and Australia. Rogers, the chairman of Singapore-based Rogers Holdings, hasn’t bought any bullion after the slump, he said in an interview. “If it goes to $1,300, I hope, I am smart enough to buy some,” he said in Singapore. “If it goes lower to $1,200, I hope to buy even more…”
“Gold was acting very unusually for the last 12 years and was overdue for a decline,” Rogers said in a separate interview on Bloomberg India TV. “Gold will make a proper bottom before resuming the bull market.”
Morgan Stanley said this week the peak in the price “has now passed,” while Goldman Sachs said it exited a bet on lower prices while saying bullion may fall even more. But billionaire John Paulson has stuck with his view that the metal will climb as a hedge against inflation. Demand for gold in India is double the level for this time of year, said Rajesh Mehta, chairman of Rajesh Exports.
Rogers first rose to fame when In a short 10 years Rogers Quantum Fund gained an astonishing 4200% vs the S&P 500’s gain of 50% during the same time period.
So be sure to tune in to CKNW or listen on the Money Talks Website to hear what he has to tell you and Michael in this exclusive Saturday interview beginning at 8:30 am PST April 27th
 Gold forecasts split at $10,000 & $1000 as ETFs sell, central banks buy, Indian dealers cleaned out
Wholesale gold rose to an eight-session high just shy of $1450 per ounce in London trade Thursday morning, recovering 45% of this month’s near-record slump.
Asian stock markets also ticked higher, but European shares were flat while commodities extended their rally.
Silver prices were unchanged for the week so far at $23.30 per ounce.
Gold priced in sterling fell £10 per ounce from an eight-session high of £946 as the pound jump on news that the U.K. avoided recession – growing just 0.3% – in the first quarter of 2013.
“Gold is continuing [its] recovery,” says the daily comment from the commodities team at Germany’s Commerzbank.
“Rate-cut speculation ahead of next week’s [Eurozone central bank] meeting – and the prospect of continued ultra-loose U.S. monetary policy following more weak economic figures – are lending buoyancy to the gold price.”
Investors who buy gold,” writes Société Générale’s global strategist Albert Edwards in a new report, are making “a bet against central banks’ competency.”
Given central banks’ track record, he adds – repeating his team’s forecast of $10,000 gold – “that’s certainly a bet I’d be happy to still take.”
Money-creation leading to a surge in inflation is also the forecast from billionaire hedge-fund manager John Paulson, who reportedly told clients on a webinar Wednesday that he and his chief precious metals strategist – the highly respected former UBS analyst John Reade – are also “holding course” despite last week’s price crash.
Dutch bank ABN Amro however – which this month said “the demise of gold [was] still at an early stage” – today revised its $1000 gold forecast from end-2015 to the end of 2014.
“ETF [trust funds] still see sellers, but physical demand remains very strong,” says Moudi Raad at Swiss refining and finance group MKS.
New York’s giant SPDR Gold Trust yesterday shed another 4 tonnes of gold, taking the bullion held to back its shares down to the lowest level since the start of September 2009 at 1093 tonnes.
Over in India however – the world’s heaviest gold-buying nation – “We are unable to get supply,” Reuters quotes a state-bank dealer.
“Refiners have sold out till second or third week of May. Gold for immediate delivery is quoted at $10 on London prices.”
Latest data from the International Monetary Fund meantime show that emerging-market central banks again chose to buy gold for their reserves in March.
Russia led central-bank gold buying, adding 4.7 tonnes to reach 981 tonnes, while Turkey continued to pull in metal from its commercial banks, adding a further 33 tonnes to reach 409.
“I think physical and central banks…those buyers are supporting the market,” Reuters quotes Yuichi Ikemizu at Standard Bank in Tokyo.
“With this sharp decline in the price,” he adds, “I think South Korea is buying gold too. [It] always buys gold when the price comes off.”
 About the Author
Related Articles:
- Stocks higher, U.K. looking better, gold has glimmer
- Physical gold vs. paper gold: waiting for the dam to break
- Portfolio manager Greg Orrell: ‘my belief in gold has not wavered’
- Gold lifted by physical bar demand but silver relatively weak
- U.S. Mint suspends sales of small gold coins
“Gold futures & the Gold Bug’s Index (HUI), have turned higher”
Our friend Chuck Cohen, a gold timer with a proven gift for knowing when to bet against the crowd, phoned the other day with urgent advice. Almost no one sees it coming, he said, but bullion is getting ready to explode. “It’s time to jump in head-first!”
Chuck has been wrong before, and we’d all but tuned him out for the last eight months or so, since his bullish drumbeat went against the asphyxiating weight of bullion charts that have shouted “lower” since last October. Now, he says, the winning bet is to be short stocks and long gold and silver. Will he be right? From a technical standpoint, it’s still too early to tell. To be sure, some key vehicles, including gold futures and the Gold Bug’s Index (HUI), have turned higher from levels that coincide with Hidden Pivot correction targets of our own. But the bounce so far, especially in Comex quotes, seems tentative at best. Moreover, this is occurring at a time when the juggernaut of deflation is threatening to overwhelm the central banks’ desperate efforts to thwart the collapse of a quadrillion dollar financial-asset bubble.
All things considered, we’re inclined to give Chuck the benefit of the doubt right now. Here are some persuasive points that he makes:
- Sentiment indicators suggest that gold is the leper of the investment world, with Rydex bulls currently at an astounding 2%.
- Shares of mining companies with real gold and silver in the ground, juniors in particular, have collapsed beyond the point of despair.
- As the price of paper gold has fallen in recent weeks, physical supplies have tightened sharply.
- Mining-share options are trading at giveaway volatilities.
IN ADDITION, CHUCK NOTES SOME TROUBLING SIGNS ON WALL STREET:
- Bull-mania has been brazenly flouting weaker corporate earnings, stagnant incomes and fizzling retail sales.
- With the Dow in record territory, institutional buyers have turned defensive, focusing on health care, big pharma and consumer staples.
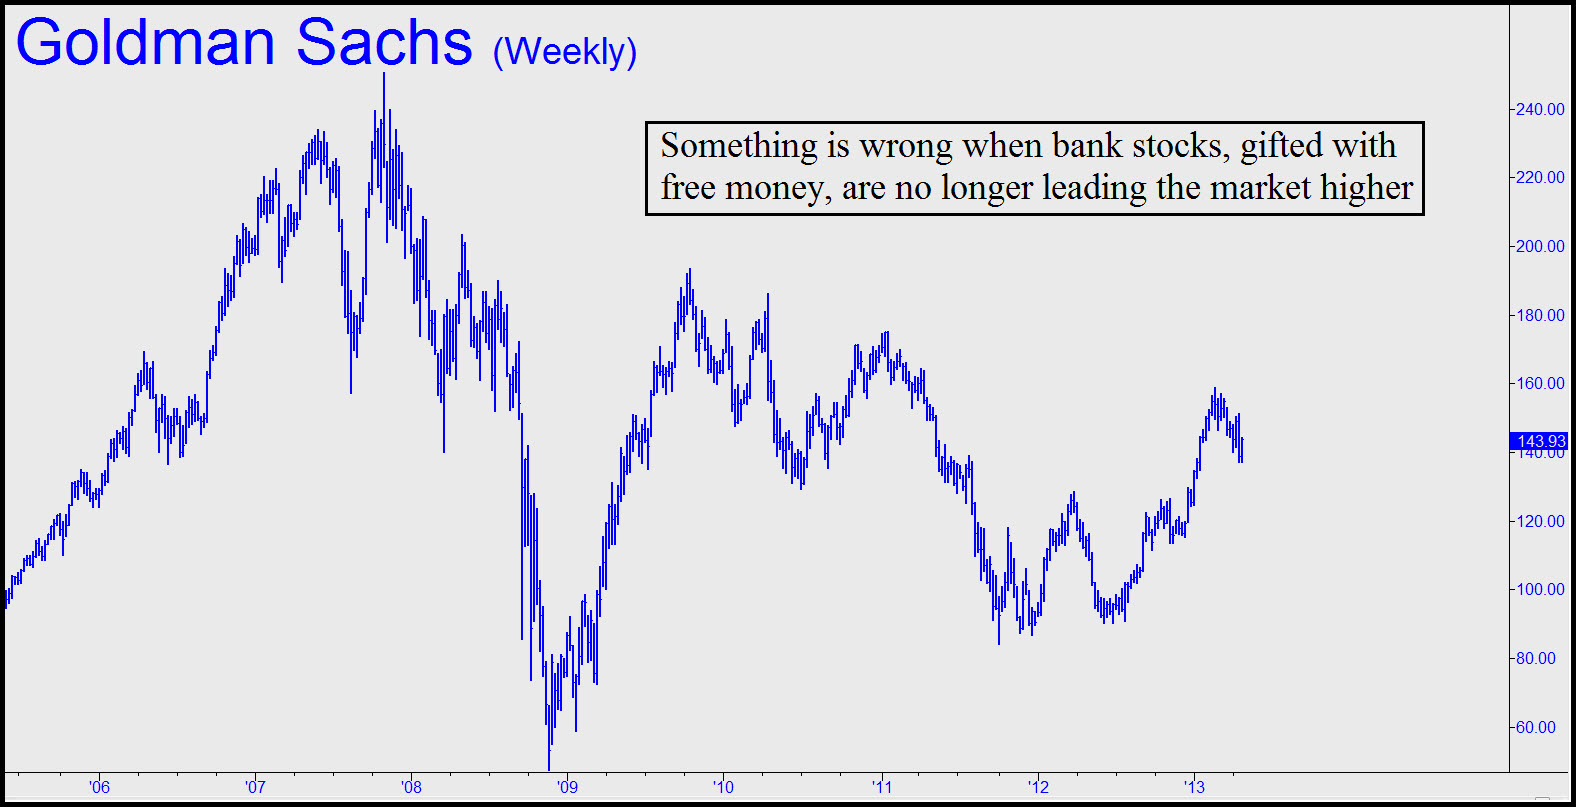
- Ominously, the banking sector has turned weak even though it is by far the biggest beneficiary of a global money blowout.
- With respect to seasonality, the month of May has typically been anything but merry.
- Europe’s deepening recession has become intractable.
- China’s economy is turning down as well.
A MAJOR TURNING POINT?
All of these factors suggest that stocks, bullion and financial assets could be at a major turning point. If this proves to be the case, and it leads to the epiphany that quantitative easing isn’t working, a stepped-up response by the central banks could be the signal that bullion markets have long awaited.
In the meantime, we’ve been recommending bottom-fishing in gold futures, GDXJ, HUI and some other popular bullion vehicles, since we know how difficult it will be, psychologically speaking, to buy these erstwhile dogs after they’ve exploded for 15%-20% gains in mere days. That is how great bull markets often begin, and the only way to avoid being shut out is to be aboard before they begin. This is the lesson we learned when stocks took off in August of 1982 with a burst of ebullience and power such as we had never before witnessed. It’s going to happen in bullion sooner or later; but even if not now, with shares and T-bonds wafting ever higher on a sea of brazen lies, our gut instinct is telling us that this is no time for bullion bulls to throw in the towel.
The crash of the price of paper gold on Monday has unleashed an unprecedented global frenzy to buy physical gold and silver. All over the planet, people are recognizing that this is a unique opportunity to be able to acquire large amounts of gold and silver at a bargain price. So precious metals dealers now find themselves being overwhelmed with orders in the United States, in Canada, in Europe and over in Asia. Will this massive run on physical gold and silver soon lead to widespread shortages of those metals? Instead of frightening people away from gold and silver,the takedown of paper gold seems to have had just the opposite effect. People just can’t seem to get enough physical gold and silver right now. Those that wish that they had gotten into gold when it was less than $1400 an ounce are able to do so now, and it is absolutely insane that silver is sitting at about $23 an ounce. If the big banks continue to play games with the price of gold, we are going to see existing supplies of physical gold and silver dry up very quickly. And once reports of physical shortages of gold and silver become widespread, it is going to absolutely rock the financial world. But this is what happens when you manipulate free markets – it often has unintended consequences far beyond anything that you ever imagined.
The following are 10 signs that the takedown of paper gold has unleashed an unprecedented global run on physical gold and silver…
 #1 According to Zero Hedge, the U.S. Mint set a new all-time record for the number of gold ounces sold on Wednesday…
(Ed Note: Demand for gold coins has surged following the record price plunge in gold last week. Demand is so high that the U.S. Mint Runs Out of Smallest American Eagle Gold Coin)
……read 2 thru 10 HERE


-
I know Mike is a very solid investor and respect his opinions very much. So if he says pay attention to this or that - I will.
~ Dale G.
-
I've started managing my own investments so view Michael's site as a one-stop shop from which to get information and perspectives.
~ Dave E.
-
Michael offers easy reading, honest, common sense information that anyone can use in a practical manner.
~ der_al.
-
A sane voice in a scrambled investment world.
~ Ed R.
Inside Edge Pro Contributors

Greg Weldon

Josef Schachter

Tyler Bollhorn

Ryan Irvine

Paul Beattie

Martin Straith

Patrick Ceresna

Mark Leibovit

James Thorne

Victor Adair