
Economic Outlook
Low oil prices today may be setting the world up for an oil shortage as early as 2016. Today we have just 2% more crude oil supply than demand and the price of gasoline is under $2.00/gallon in Texas. If oil supply falls too far, we could see gasoline prices doubling within 18 months. For a commodity as critical to our standard of living as oil is, it only takes a small shortage to drive up the price.
On Thanksgiving Day, 2014 Saudi Arabia decided to maintain their crude oil output of approximately 9.5 million barrels per day. They’ve taken this action despite the fact that they know the world’s oil markets are currently over-supplied by an estimated 1.5 million barrels per day and the severe financial pain it is causing many of the other OPEC nations. By now you are all aware this has caused a sharp drop in global crude oil prices and has a dark cloud hanging over the energy sector. I believe this will be a short-lived dip in the long history of crude oil price cycles. Oil prices have always bounced back and this is not going to be an exception.
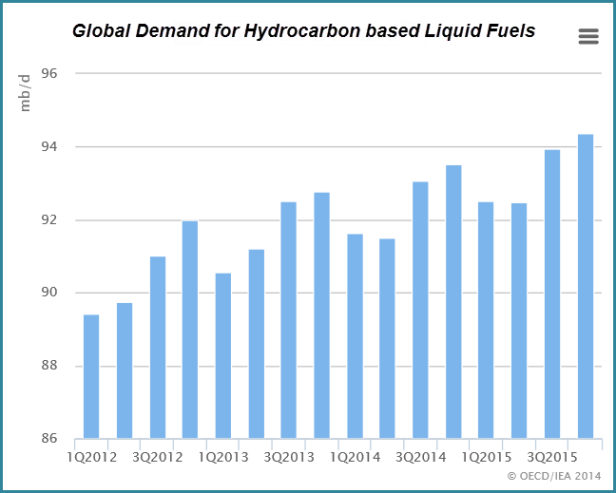
To put this in prospective, the world currently consumes about 93.5 million barrels per day of liquid fuels, not all of which are made from crude oil. About 17% of the world’s total fuel supply comes from natural gas liquids (“NGLs”) and biofuels.
One thing that drives the Bears opinion that oil prices will go lower during the first half of 2015 is that demand does decline during the first half of each year. Since most humans live in the northern hemisphere, weather does have an impact on demand. I agree that this fact will play a part in keeping oil prices depressed for the next few months. However, low gasoline prices in the U.S. are certain to play a part in the fuel demand outlook for this year’s vacation driving season.
Related: Ten Reasons Why A Sustained Drop In Oil Prices Could Be Catastrophic
Brent oil prices are now hovering around $60 a barrel. In my opinion, this is quite a bit lower than Saudi Arabia thought the price would go and may lead to an “Emergency” OPEC meeting during the first quarter. But for now, I am assuming that Saudi Arabia is willing to let the other OPEC members suffer until the next scheduled OPEC meeting in June.
The commonly held belief is that Saudi Arabia is doing this to put a stop to the rapid growth of production from the U.S. shale oil plays. Others believe it is their goal to crush the Russian and Iranian economies. If the oil price remains at the current level for a few months longer it will do all of the above.
My forecast models for 2015 assume that crude oil prices will remain depressed during the first quarter, then slowly ramp up and accelerate as next winter approaches. I believe that by December we will see a much tighter oil market and significantly higher prices. In a December 24, 2014 article in The National, Steven Kopits managing director of Princeton Energy Advisors states that, “In permitting low oil prices, the Saudis seek to bring the market back into equilibrium. At present, our calculation of break-even system-wide is in the $85–$100 a barrel range on a Brent basis.”
Mark Mobius, an economist and regular guest on Bloomberg TV recently said he sees Brent rebounding to $90/bbl by the end of 2015.
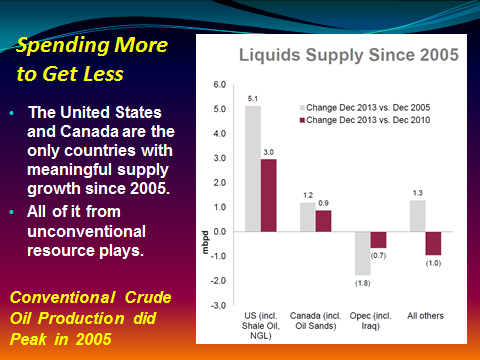
Since 2005, only North America has been able to add meaningful crude oil supply. Outside of Canada and the United States (including the Gulf of Mexico), the rest of the world’s crude oil production netted to a decline of a million barrels per day from December, 2010 to December, 2013. More than half of the OPEC nations are now in decline. We’ve been able to supplement our fuel supply during the last ten years with biofuels, but that is limited since we need the farmland for food supply.
I believe the current low crude oil price could be overkill and result in the next “Energy Crisis” by early 2016. Enjoy these low gasoline prices while they last.
The upstream U.S. oil companies we follow closely are all announcing 20% to 50% cuts in capital spending for 2015. We will start seeing the impact on supply at the same time the annual increase in demand kicks in. Our model portfolio companies are all expected to report year-over-year increases in production, but at a much slower pace than the last few years.
A study released by Credit Suisse two weeks ago shows that U.S. independents expect capital-expenditure (Capex) cuts of one-third against production gains of 10 per cent next year. This would imply production growth of 600,000 bpd of shale liquids, and perhaps another 200,000 bpd from Gulf of Mexico deepwater projects. At the same time, U.S. conventional onshore production continues to fall. I have seen estimates of 500,000 to 700,000 bpd declines within twelve months. If these forecasts are accurate, U.S. oil production growth would be barely positive next year and headed for a material downturn in 2016.
North American unconventionals (oil sands, shale and other tight formations) have been almost all of net global supply growth since 2005. If unconventional growth grinds to zero and conventional growth is falling outright, the supply side heading into 2016 looks highly compromised. At today’s oil price, only the “Sweet Spots” in the North American Shale Plays and the Canadian Oil Sands generate decent financial returns to justify the massive capital requirements needed to continue development. Global deepwater exploration is rapidly coming to a halt.
Were demand growth muted, this might not matter. Demand for liquid fuels goes up year-after-year. It even increased in 2008 during the “Great Recession” and ramped up sharply during 2009 and 2010 despite a sluggish global economy. Low fuel prices are increasing demand today and my guess is that, with U.S. GDP growth now forecast at 5% in 2015, we could see demand for fuels increase by close to 1.5 million barrels per day this year. The current IEA forecast is for oil demand to increase by 900,000 bpd in 2015.
If this plays out, the oil markets will be heading into a significant squeeze in the first half of 2016.
The last extended period of low oil prices was 1985 to 1990. In 1985, when oil prices collapsed similar to what’s happening now, the world had 13 million bpd of spare capacity, with 7 million bpd in Saudi Arabia alone. OPEC was well-positioned to comfortably meet any increase in demand.
Today, just about all of the world’s discretionary spare capacity resides in Saudi Arabia and amounts to an estimate 2 million bpd. Lou Powers, an EPG member and author of “The World Energy Dilemma,” has said that Saudi Arabia will have difficulty maintaining production at over 10 million bpd for an extended period. If we do swing to a supply shortage, Saudi Arabia may find itself in the position of needing to run the taps full out for much of 2016. In such an event, the world will be headed right back into an oil shock and we will see much higher oil prices than $100/bbl.
Related: The Hidden Costs Of Cheap Oil
Low oil prices will hurt the unhedged upstream companies, but they will hurt the oilfield services sector the most. I’m expecting the onshore active rig count to drop by 30% by mid-2015. Oil price will need to firm up for several months before the upstream companies commit to higher spending levels. That said, the high quality drillers like Helmerich & Payne (HP), Patterson-UTI Energy (PTEN) and Precision Drilling Corp. (PDS) will be fine since a lot of their high end rigs will keep working on long-term contracts. By 2016, they will have gained market share.
Remember, North America and deepwater are the only places with meaningful production upside. If crude oil prices move below $60/bbl and stay there for even six months it could prove catastrophic to non-OPEC supply. At some point, OPEC action may become necessary.
“But perhaps not by the Saudis. Russia’s position is comparable to Saudi Arabia’s. Either could cut production by meaningful quantity, but the Russians need the incremental revenue more. Saudi Arabia would be right to argue that any calls for production cuts should be directed to Moscow. OPEC could cut production to prop up prices and increase revenues. But for now, a better strategy (for Saudi Arabia) would be to hang back, deflect criticism, and let events play out. If the Russians are thinking clearly, Moscow will cut first.” – Steven Kopits the managing director of Princeton Energy Advisors.
The best news for all of us is that Iran may be quite willing to put an end to their nuclear enrichment program a few months from now. I believe this is the real reason for what Saudi Arabia is doing.
By Dan Steffens for Oilprice.com
More Top Reads From Oilprice.com:
- Could Libyan Militants Spark An Oil Price Rebound?
- How Broken Are The Energy Markets?
- Follow The Trends For Oil Price Rebound

 Last week, U.S. President Barack Obama and Cuban President Raul Castro agreed to an exchange of prisoners being held on espionage charges. In addition, Washington and Havana agreed to hold discussions with the goal of establishing diplomatic relations between the two countries. No agreement was reached on ending the U.S. embargo on Cuba, a step that requires congressional approval.
It was a modest agreement, striking only because there was any agreement at all. U.S.-Cuba relations had been frozen for decades, with neither side prepared to make significant concessions or even first moves. The cause was partly the domestic politics of each country that made it easier to leave the relationship frozen. On the American side, a coalition of Cuban-Americans, conservatives and human rights advocates decrying Cuba’s record of human rights violations blocked the effort. On the Cuban side, enmity with the United States plays a pivotal role in legitimizing the communist regime. Not only was the government born out of opposition to American imperialism, but Havana also uses the ongoing U.S. embargo to explain Cuban economic failures. There was no external pressure compelling either side to accommodate the other, and there were substantial internal reasons to let the situation stay as it is……
 It’s only 8 a.m. here in New York, but we have had a full day already.
Here’s a super-quick overview of all the crazy things that are happening in markets right now.
- The Russian ruble is collapsing. The ruble fell to as low as 78 against the US dollar and 100 against the euro. This collapse comes after the Russian central bank on Monday night unexpectedly raised interest rates to 17% from 10.5%.
- US futures are down big after trading higher earlier Tuesday morning. Dow futures are down 100 points, S&P 500 futures are down 14, and Nasdaq futures are down 36.
- Bond yields are collapsing. The US 10-year yield fell to as low as 2.01%, while the German 10-year bund fell below 0.6%.
- Oil is still in free fall. West Texas Intermediate crude oil is making new lows, trading near $54.20 a barrel. Brent crude oil also cracked the $60-a-barrel market and traded below $59. Both oil benchmarks are down more than 3%.
- The dollar is getting whacked. The dollar was falling against the euro, the British pound, and, most notably, the Japanese yen. The dollar was trading at about 116 against the yen after trading as high as 121 last week. This is the yen’s best level against the dollar in more than a month.
- The Norwegian krone is getting annihilated. The Norwegian krone was getting whacked Tuesday, falling to below 7.5 against the dollar and reaching parity — or equal value — with the Swedish krona for the first time since 2000.
This post will be updated as the market story changes throughout the day.
Read more: http://www.businessinsider.com/us-market-update-december-16-2014-12#ixzz3M4WkQk7e

 There can be little doubt that data releases rather than experience or intuition are driving the economic conversation. This is perhaps a function of the disconnection that many people feel about an economy that they no longer understand. Rather than trusting their own eyes or their own gut to form an opinion, it’s much easier to grab a set of convenient numbers. The big question then becomes what numbers you choose to look at and which you choose to ignore.
While there are a great many types of economic data releases, issued by a myriad of public and private sources, two reports have risen above the rest in importance: the Quarterly GDP estimates issued by the Bureau of Economic Analysis, and the monthly jobs report issued by the Bureau of Labor Statistics. And those two reports have been recently coming up roses. The 3rd quarter GDP growth report, released on November 25th, revised growth upwards to an annualized rate of 3.9%, and the November Jobs report, released on December 5th, showed the creation of 321,000 new jobs in November, the highest monthly total in nearly three years. These reports have solidified the views of the mass of analysts that the U.S. economy is currently firing on all cylinders.
But to make this conclusion, almost all the other data sets, which used to be considered significant, have been either ignored or, when that proves impossible, rationalized away to make the figures unimportant. This never happens with strong data, which is typically accepted at face value.
In the weeks leading up to, and the days after, the recent GDP and jobs reports, a torrent of data releases came in that were almost universally awful. However, in our current era of journalistic lethargy, these reports have received almost no attention at all.
While it would be too long and boring to list all of these moribund statistics, here is a brief overview, in chronological order, of what you are likely not hearing:
November 24 – The Chicago Fed National Activity Index, which weighs 85 different economic indicators to gauge the national economy, fell to 0.14 in October from 0.29 in September. The three-month average declined to negative 0.01 from positive 0.12. The index is designed so that readings above zero indicate above-trend growth.
November 24 – Markit’s Flash PMI, which measures service sector health, came in at 56.3 for November, missing expectations of 57.3. This is the lowest reading for the index since April, and the fifth consecutive month of declines.
November 25 – The Richmond Fed Manufacturing Index came in at a very weak 4 for November, which is down sharply from the 20 posted in October, and far below economist expectations. Consensus expectations were for 16, with survey respondents ranging from 12 to 24.
November 25 – The Commerce Department reported that growth in corporate profits (adjusted for depreciation and the value of inventories) slowed sharply in the third quarter to a 2.1% annual rate, down from an 8.4% annualized rate in the second quarter.
November 25 – The Case Shiller 20-City Index showed year over year price gains of only 4.9%, the lowest reading since October 2012. This continues a trend of a decreasing rate of home price appreciation.
November 25 – The Conference Board reported that U.S. Consumer Confidence dropped to 88.7 in November from a revised 94.1 in October. The November drop was unexpected and puts the index at its lowest reading since June. Economists surveyed by The Wall Street Journal had forecast November to come in at 96.5.
November 26 – U.S. durable-goods orders rebounded 0.4 percent in October after September’s decline of 0.9 percent. However, the rise largely reflected a 45.3% surge in demand for defense aircraft and parts, which masked weak demand elsewhere. Excluding transportation, orders fell 0.9%, the biggest drop since December 2013. Excluding defense-related products, orders fell 0.6%.
November 26 – Personal income rose by only .2% in October, half of the .4% expected by economists.Personal spending also increased by .2%, but this was 33% less than the .3% consensus expectations.
November 26 – Manufacturing activity in the Chicago-area expanded 60.8 in November, which represents a significant drop from 66.2 in October. The decline was larger than the consensus expectations for a decline to 63.
December 3 – Mortgage applications decreased 7.3% from the week earlier, the second straight week of declines.
December 3 – The National Retail Federation reported that Thanksgiving weekend retail sales came in at a disappointing $51 billion, down 11% from 2013. This data includes the entire four day weekend, in which many retailers operated under longer hours than they have in years past.
December 5 – Although the Trade Deficit narrowed slightly to $43.4 billion in October, the figure was actually higher than the consensus estimates and only came down because the September numbers were revised higher. In addition, the trade deficit in manufactured products hit $71.2 billion, the highest on record.
December 5 – Factory orders fell for the third consecutive month, shrinking 0.7% (more than double the .0.3% rate that had been expected) in October after declining 0.5% in September.
December 5 – Consumer credit rose $13.2 billion in October but the increase was far less than the $16.8 billion expected by a Bloomberg survey of economists (September’s rate that had also come in well below the consensus estimate was revised even lower). The gain was largely centered on a $12.3 billion increase in non-revolving credit that includes auto financing and the government’s acquisition of student loans from private lenders. Revolving credit rose only $0.9 billion, down from an already disappointing $1.4 billion in September.
Although the national elections are generally not counted as an economic indicator, the November mid-term elections reflected overwhelming economic dissatisfaction among voters, which resulted in a drubbing at the polls for Democrats associated with the President’s agenda.
So if the majority of the granular reports of weak economic activity persist and the public remains unaware or unconvinced that the economy is improving, how could it be that the two most followed reports could be so strong?
There is much in both the GDP and the Jobs Report that is dependent on forward-looking expectations. I believe that both reports are showing improvement because businesses are building inventory and hiring staff in anticipation of an economy that they believe will continue to improve. It’s like the Field of Dreams recovery, prepare for it and it will come. But I think businesses are following the false narrative, and ignoring, or rationalizing, the bad data as thoroughly as does the media. When they realize they were fooled by the hype, jobs will be lost, and GDP will fall.
Furthermore, the GDP and jobs data would certainly be far weaker if the Federal Reserve were not providing so much monetary support. Sure, they have discontinued the vast majority of the QE, but interest rates are still at zero percent. What would GDP or job growth look like if consumers, businesses, and the federal government were forced to pay anything that approaches the historically normal interest rates on our much greater than normal level of debt? My guess is that it will be awhile before we find out, as I believe that as the bloom comes off the recovery rose, the Fed will launch another round of QE before it gets around to raising interest rates.
Best Selling author Peter Schiff is the CEO and Chief Global Strategist of Euro Pacific Capital. His podcasts are available on The Peter Schiff Channel on Youtube

…..more from the The Gruberization of environmental policies
Former White House medical consultant Jonathan Gruber pocketed millions of taxpayer dollars before infamously explaining how ObamaCare was enacted. “Lack of transparency is a huge political advantage,” he said. “It was really, really critical to getting the bill passed.” At least one key provision was a “very clever basic exploitation of the lack of economic understanding of the American voter.”
The Barack Obama/Gina McCarthy Environmental Protection Agency is likewise exploiting its lack of transparency and most Americans’ lack of scientific understanding. EPA bureaucrats and their hired scientists, pressure groups and PR flacks are getting rich and powerful by implementing costly, punitive, dictatorial regulations “for our own good,” and pretending to be honest and publicly spirited.”
EPA’s latest regulatory onslaught is its “Clean Power Plan
The typical household’s annual electricity and natural gas bills will rise 35% or $680 by 2020, compared to 2012, and will climb every year after that, as EPA regulations get more and more stringent. Median family incomes are already $2,000 lower since President Obama took office, and electricity prices have soared 14-33% in states with the most wind power – so these extra costs will exact a heavy additional toll.
Manufacturing and other businesses will be hit even harder, the study concluded. Their electricity and natural gas costs will almost double between 2012 and 2020, increasing by nearly $200 billion annually over this short period. Energy-intensive industries like aluminum, steel and chemical manufacturing will find it increasingly hard to compete in global markets, but all businesses (and their employees) will suffer.
The EVA analysis calculates that industrial electricity rates will soar by 34% in West Virginia, 59% in Maryland and New York, and a whopping 74% in Ohio. Just imagine running a factory, school district or hospital – and having to factor skyrocketing costs like that into your budget. Where do you find that extra money? How many workers or teachers do you lay off, or patients do you turn away? Can you stay open?
The CPP will also force utility companies to spend billions building new generators (mostly gas-fired, plus wind turbines), and new transmission lines, gas lines and other infrastructure. But EPA does not factor those costs into its calculations; nor does it consider the many years it will take to design, permit, engineer, finance and build those systems – and battle Big Green lawsuits over them.
How “science-based” are EPA’s regulations, really? Its mercury rule is based on computer-generated risks to hypothetical American women who eat 296 pounds of fish a year that they catch themselves, a claim that its rule will prevent a theoretical reduction in IQ test scores by an undetectable “0.00209 points,” and similar absurdities. Its PM2.5 soot standard is equivalent to having one ounce of super-fine dust spread equally in a volume of air one-half mile long, one-half mile wide and one story tall.
….read it all HERE

-
I know Mike is a very solid investor and respect his opinions very much. So if he says pay attention to this or that - I will.
~ Dale G.
-
I've started managing my own investments so view Michael's site as a one-stop shop from which to get information and perspectives.
~ Dave E.
-
Michael offers easy reading, honest, common sense information that anyone can use in a practical manner.
~ der_al.
-
A sane voice in a scrambled investment world.
~ Ed R.
Inside Edge Pro Contributors

Greg Weldon

Josef Schachter

Tyler Bollhorn

Ryan Irvine

Paul Beattie

Martin Straith

Patrick Ceresna

Mark Leibovit

James Thorne

Victor Adair