
Currency
LONDON – The dollar pared earlier gains on Wednesday as investors positioned themselves for U.S. data later this week that could be key indicators of when the Federal Reserve will slow its huge bond buying program.
The euro fell to a two-month low against the Swiss franc after data showed an uneven recovery in the currency bloc. Hedge funds sold the euro ahead of next week’s Swiss National Bank meeting, at which it is likely to reiterate its commitment to the euro/Swiss peg of 1.20 francs.
….read more HERE

From Dave Lutz at Stifel, Nicolaus, here’s an ultra-quick roundup of today’s trader talk:
US Futures are starting on weaker footing this AM, mirroring overseas markets. Much of the global angst is Yen driven, which is catching a bid due to a lower than expected stimulus package being discussed. Nasdaq Futures are outperforming SPX, as AAPL pops over 1% on a upgrade from UBS. Some other “high Beta” names are mixed this AM, with TSLA up 2%, DDD up 1%, but FB losing 40bp. Over In Europe, Markets are considerably weaker in heavy volume. The DAX is off 1%, with volumes 140%+ over the 20day average, while France’s equity market is getting hit for 2%. Focus on the EU fins, which are getting hit for almost 2% (I’ll be surprised if we don’t see a bid developing as US traders man their Bloombergs).. The Nikkei managed a fresh 6year closing high, before the Stimulus details were released by Reuters, which has hit the Nikkei futures for over 1% early this AM. China managed a rebound after the IPO induced weakness today, with their smallcap index surging back after the 8% smackdown yesterday. Aussie lost 50bp, but globally resources companies continue to underperform. Focus today will be in the Autos, as November sales data is released. Bear in mind also, while searching for Liquidity, a few UK firms are hosting Charity Days today.
The 10YY is retreating slightly lower, after tasting 3M highs yesterday – but the Spread between US and German Yields has widened to 7Y highs on diverging Central Bank Policies. The DXY is under pressure this AM, losing ground to both € and Yen. This is a natural tailwind for commodities – but Gold has a “dead Cat” bounce feel, barely holding green – WTI is up small into Inventory data release tonight – but losing ground to Brent (Telling with DXY weaker). Natty Gas is getting hit for 40bp, as we enter a seasonable tough month for the commodity, and Japan’s Tepco is holding off on LNG purchases due to high prices. Aside from Vehicle sales today, we have ISM NY at 9:45, but the big driver may be the double POMO whammy —> Fed has a $750mln – $1B purchase at 11am, followed by a $3-4B purchase operation at 2pm.
More from Business Insider:
20 Years Of Tech Innovation In A Single Picture
The picture below was recently tweeted by @FascinatingPics.
It shows some of the 1993 technology that is now packed into 2013 technology.
Anytime you think the pace of innovation in the world is slowing down, just have another glance at this.

also…
50 Unfortunate Truths About Investing

(Reuters) – The yen rose against the dollar and the euro on Tuesday, rebounding from losses as falling stock markets worldwide prompted safe-haven demand for the Japanese currency.
The dollar slipped against the euro and a basket of currencies but the decline could be short-lived on a view that the Federal Reserve may begin to reduce its huge bond-buying economic stimulus earlier than some had anticipated.
After a strong U.S. ISM factory report on Monday, investors are now looking to U.S. economic growth data on Thursday and, in particular, U.S. nonfarm payrolls numbers on Friday for further signs of when the Fed may act.
The dollar fell 0.5 percent to 102.49 yen after reaching 103.37 yen in Asian trading, according to Reuters data. That was close to its 2013 high of 103.73 yen, a level dollar bulls have been targeting.
“The yen caught a reprieve from extreme selling as a solid coat of red across global bourses spurred a round of safe-haven interest,” said Joe Manimbo, senior market analyst at Western Union Business Solutions in Washington.
“Sentiment, though, remained decidedly bearish on the view that the Bank of Japan will press ahead, and maybe extend, its current pace of support to the world’s No. 3 economy.”
Trading volumes of dollar/yen were almost double the average over the past month, according to data from the Reuters dealing platform. The dollar is up 18 percent against the yen this year and rose strongly over the past month, on expectations the U.S. would soon scale back its bond-buying program while Japanese monetary policy remained loose.
The BoJ’s commitment to easy policy makes the yen the best funding currency for investing in higher-yielding assets in so-called carry trades. When riskier assets such as stocks fall, investors would buy back the yen, giving it a perceived safe- haven status.
Net yen short positions were at their highest since July 2007, according to data from the Commodity Futures Trading Commission.
“There are certainly signs that short positioning is becoming more stretched at current levels, while our short-term valuation model is signaling the yen is becoming more undervalued,” said Lee Hardman, currency economist at BTMU.
“The key is the payrolls report on Friday,” BTMU’s Hardman said. “If it’s another strong report, then it could push dollar/yen higher.”
The euro retreated from a five-year high of 140.03 yen to 139.19 yen, down 0.2 percent on the day.
Against the dollar, the euro rose 0.2 percent to $1.3573 on expectations the European Central Bank would leave interest rates unchanged this week after above-forecast inflation data last Friday.
“Status quo on ECB monetary policy should persist until the end of the year, with no negative rates in sight,” said Francesco Scotto, portfolio manager at RTFX Fund Management. “Euro/dollar is still on a bullish trend and should maintain this tone until the end of the month.”
The Australian dollar was up 0.2 percent against the U.S. dollar at $0.9124 after data showed solid net exports in July-September as well as firm retail sales in October.
Earlier, the Reserve Bank of Australia reiterated after a policy meeting that the Aussie was still uncomfortably high.
(Additional reporting by Laurence Fletcher in London; Editing by James Dalgleish)
It’s been several months since we took an indepth look at some of the more important currencies in the world. In this Weekend Report I would like to show you some important developments that have taken place that could be signalling a stronger US dollar maybe in the cards. Most of the currencies have been in a prolonged topping or consolidation pattern which some broke down awhile ago and some are still consolidating.
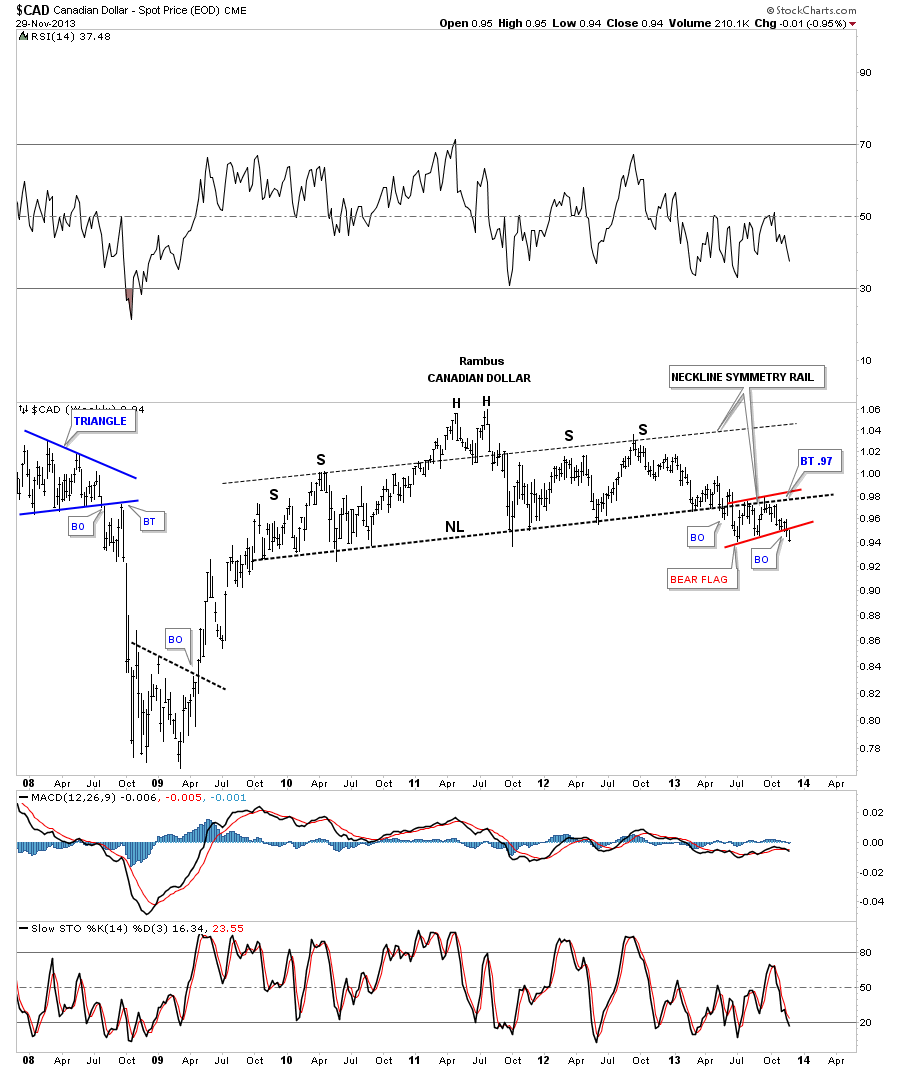
Lets start with the CAD, Canadian Dollar that has been showing a beautiful H&S top formation that broke down in May and has been in backtest mode ever since. The backtest took on the formation of a small red bear flag that finally broke through the bottom rail this past week. The last time I posted this chart I said it was a mirror image of the HUI weekly H&S top, complete with the neckline symmetry rail, that showed us the height for the right shoulder. Like the HUI this is a very large topping pattern that is going to be in play for sometime to come.
Ed Note: Michael Campbell Campbell also had John Johnston on this weekend forecasting a 70 cent Cdn Dollar in the next 10 years: http://moneytalks.net/mikes-content/10854-the-bear-mkt-in-jobs-a-the-great-deleveraging.html
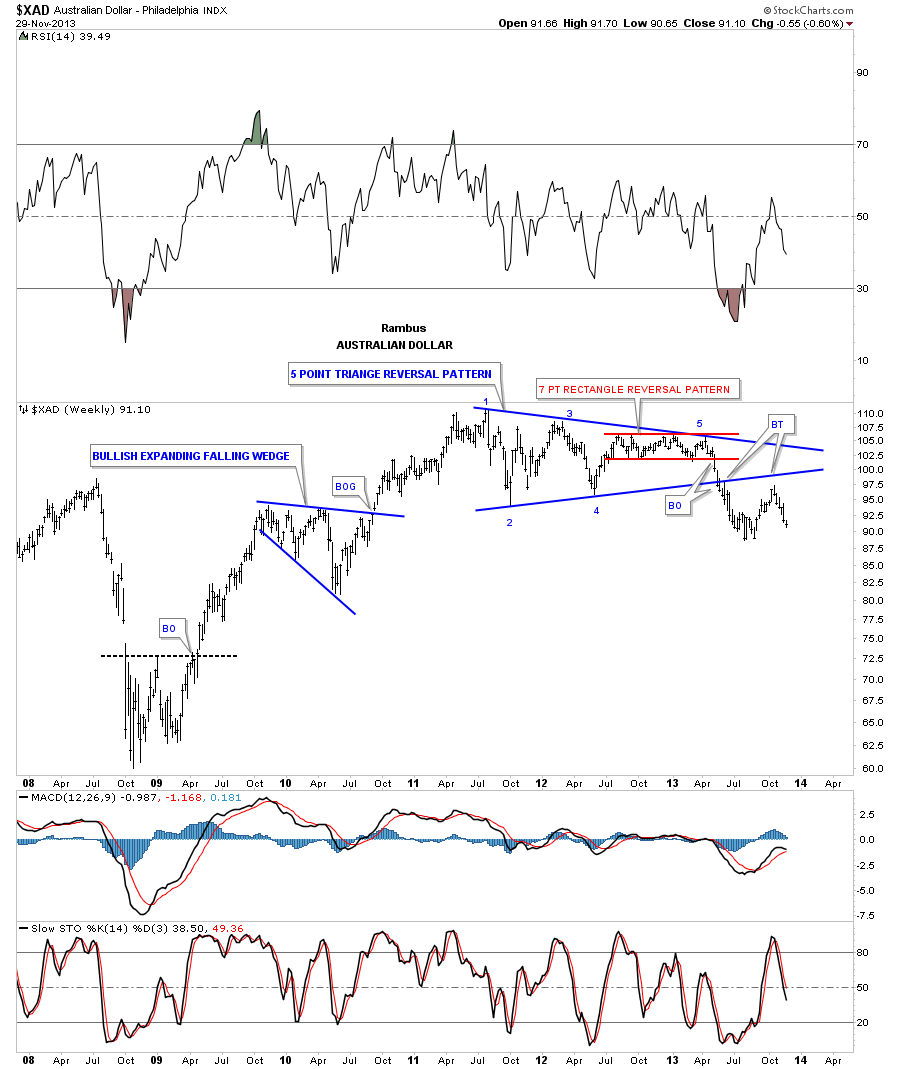
The XAD, Australian dollar, formed a very nice five point triangle reversal pattern that broke out to the downside in May of this year. Our first big clue that the XAD would break down was the completion of the red 7 point rectangle that formed out toward the apex of the 5 point triangle reversal pattern. As you can see on the chart below, even though you have a nice clean breakout, the backtesting process can take some valuable time to complete. This can be frustrating to live through but it doesn’t change the outcome of what that very large triangle reversal pattern represents. Which is a big top.
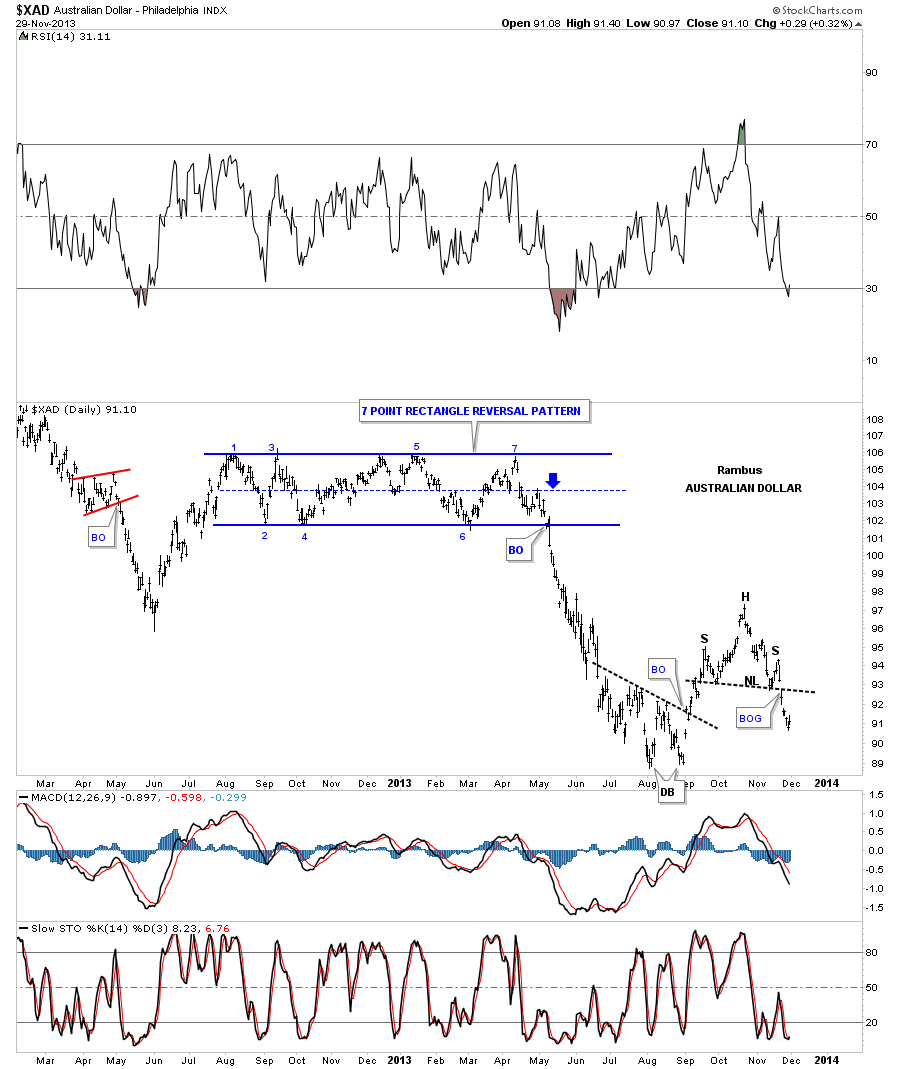
Before we move on lets look at the daily chart for the XAD that shows the beautiful 7 point rectangle reversal pattern. Also note the little H&S that broke out this week signalling the little counter trend rally is now reversing course.
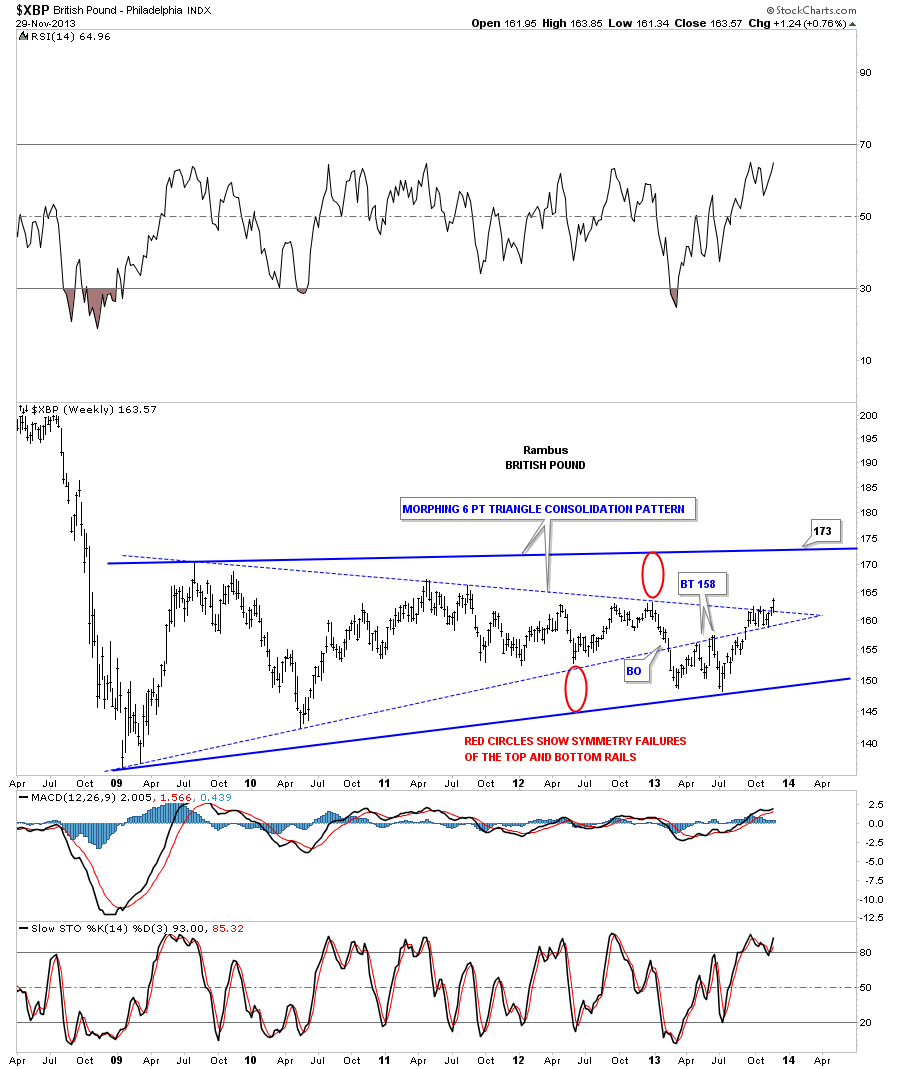
The XBP, British Pound, looks like it’s morphing into a bigger triangle. The blue dashed trendlines shows the original triangle that had a nice clean breakout through the bottom rail and then the backtest at 158. Once the price action traded back above the bottom blue dashed rail that negated the breakout. As you can see the price action has been chopping very tightly within the apex of the original blue dashed triangle, and then broke out to the topside. The red circles shows you where I would expect the top blue solid rail to be place if this triangle is morphing into a bigger triangle. I showed you this in regards to the Yen awhile back.
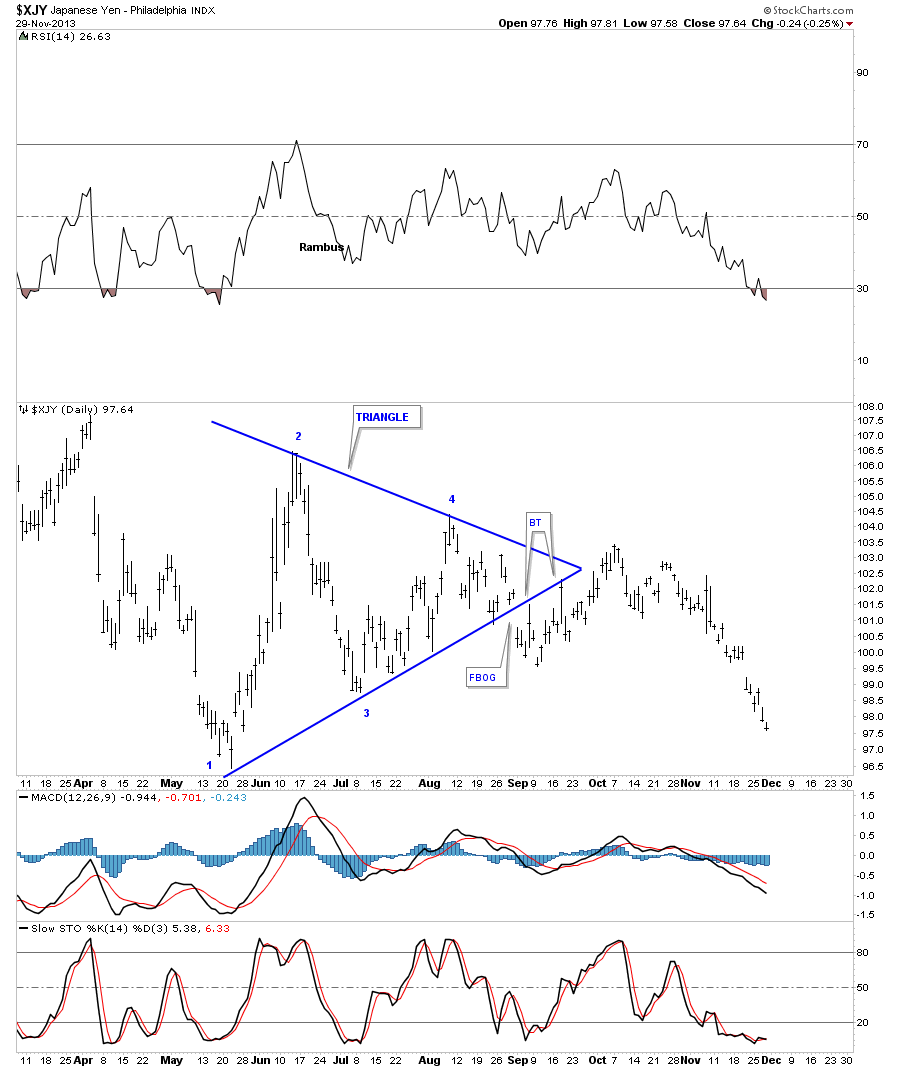
While we’re on the subject of morphing triangles let look at the Yen’s morphing triangle and see how it turned out. First, the original triangle on the daily chart. Note the big breakout gap and the two backtests to the bottom rail that looked perfect.

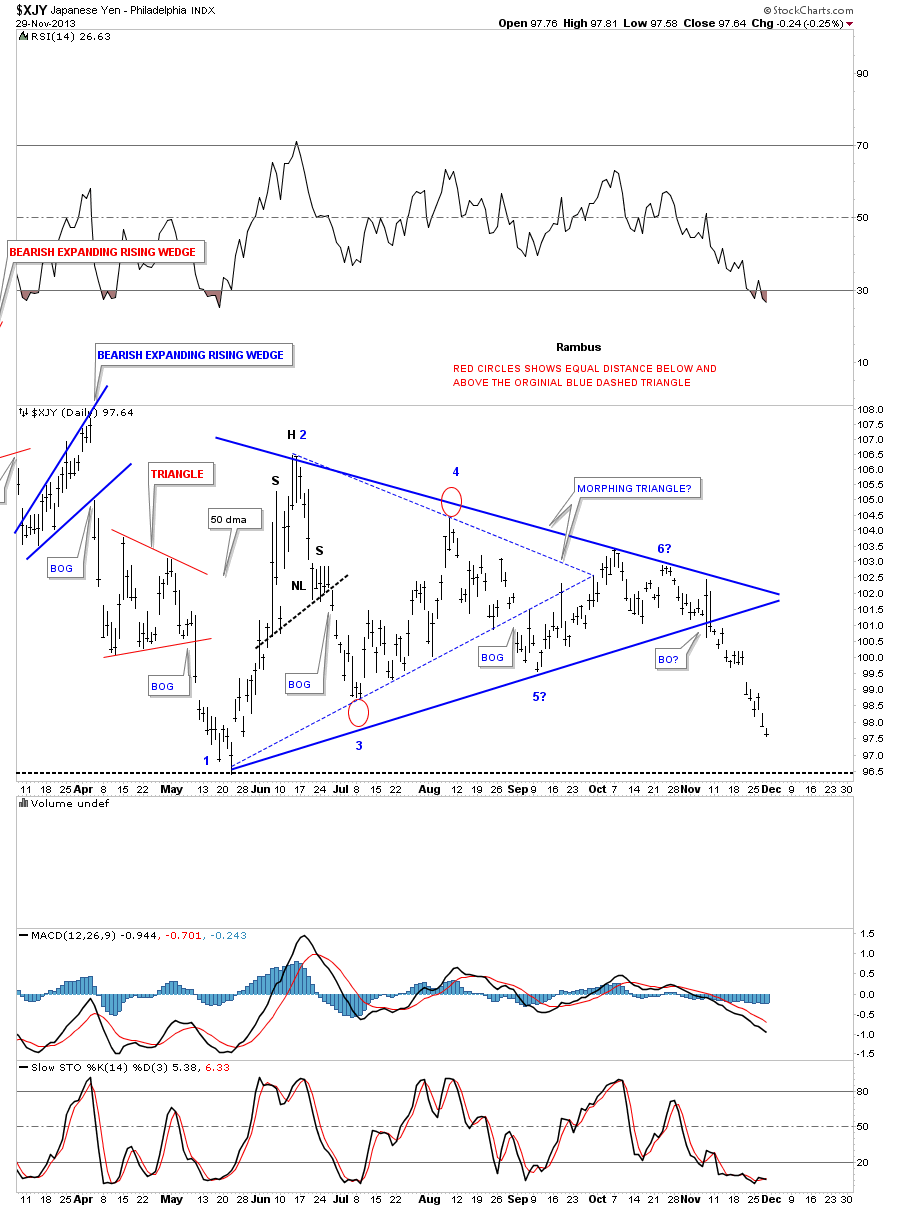
This next chart for the Yen shows how I used the red circles to expand the original blue dashed triangle. It’s not a perfect science but normally when you readjust the bottom rail many times the top rail will need to be adjusted by the same amount. It’s a symmetry thing. As you can see the top solid rail only morphed about half of the red circle for its high and then the price action reversed back down breaking through the new solid blue rail signalling the triangle was complete. Note the last two long bars that formed at the apex of the new solid blue triangle. That was the final gasp before the triangle finally broke down.
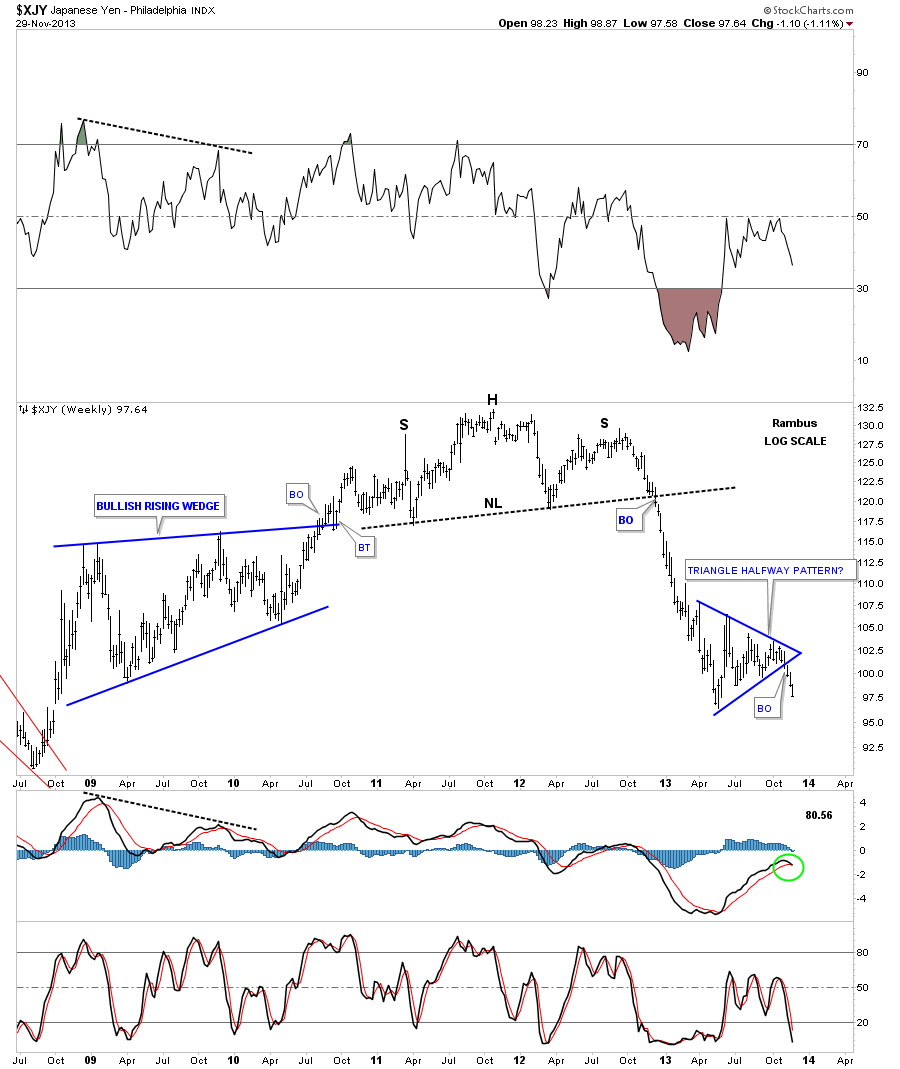
Lets look at a few more charts for the Yen as gold seems to be following the Yen closer than the euro. The Yen made a beautiful H&S top before it broke down that led to a near vertical move lower. Our morphing triangle on the daily chart above shows you why that triangle is so important to the overall big picture. Note the near vertical move down from the breakout of the H&S top into the Blue Triangle. Many times how a move takes place going into a consolidation pattern, a similar move will occur when the price action exits the consolidation pattern. As you can see the Yen has now completed its third week in breakout mode in a near vertical move. I’m viewing the blue triangle as a halfway pattern until something tells me differently. This just maybe a coincidence but silver has now traded three weeks below its Diamond consolidation pattern.
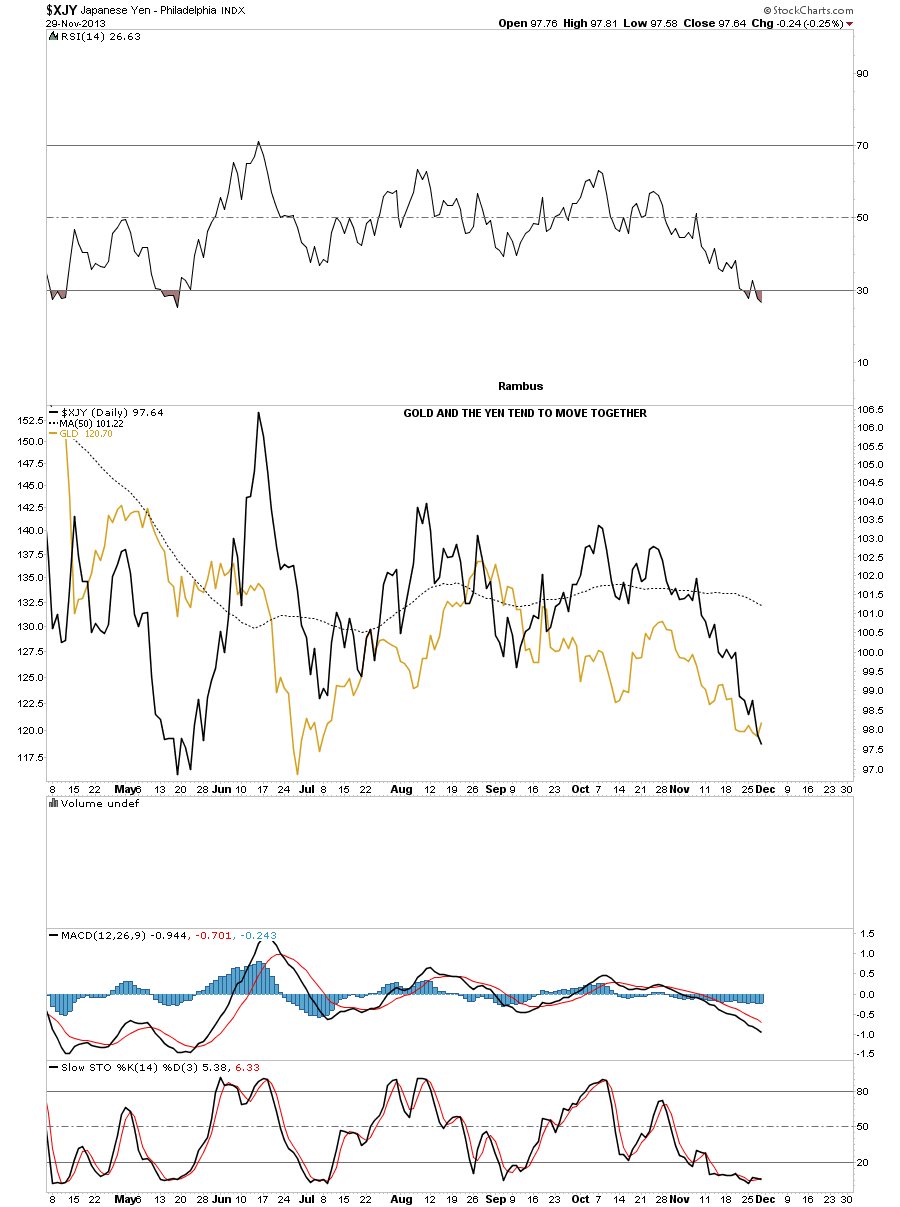
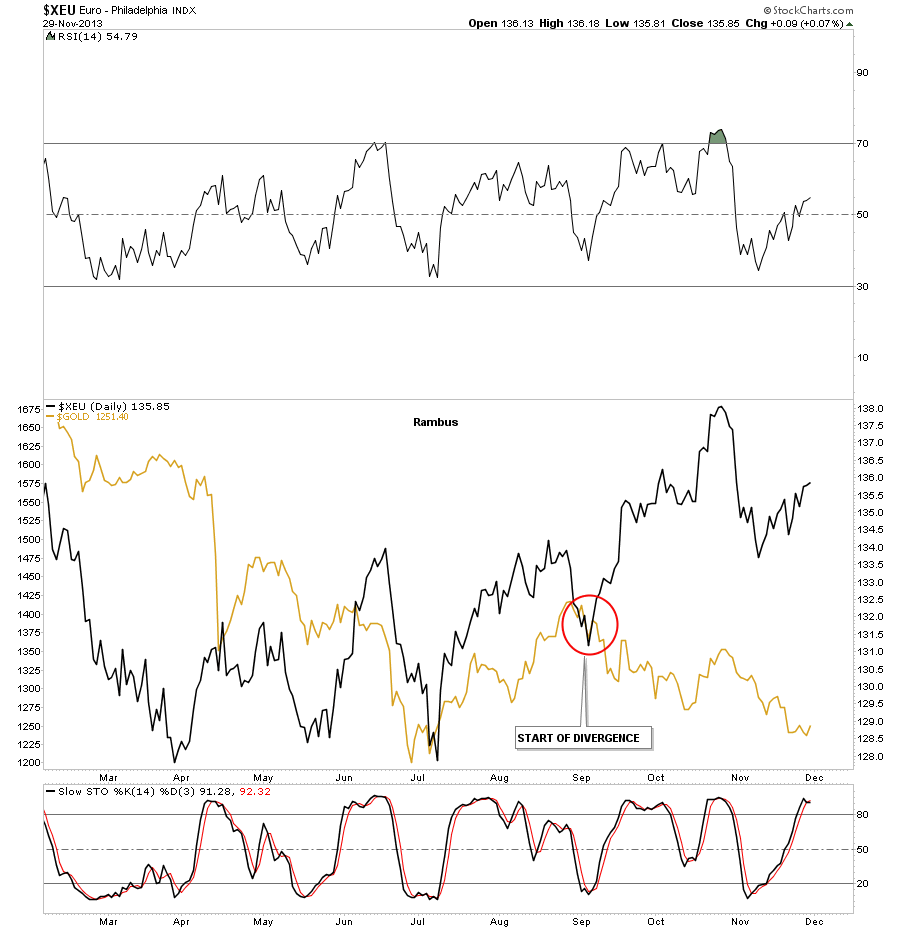
Below is a comparison chart where I’ve overlaid gold on top of the Yen. As you can see we are getting a better correlation then if you overlaid gold on top of the euro.
On the chart below I’ve overlaid gold on top of the euro that shows a very strong negative correlation starting in September of this year. Up until that point they moved fairly close together.
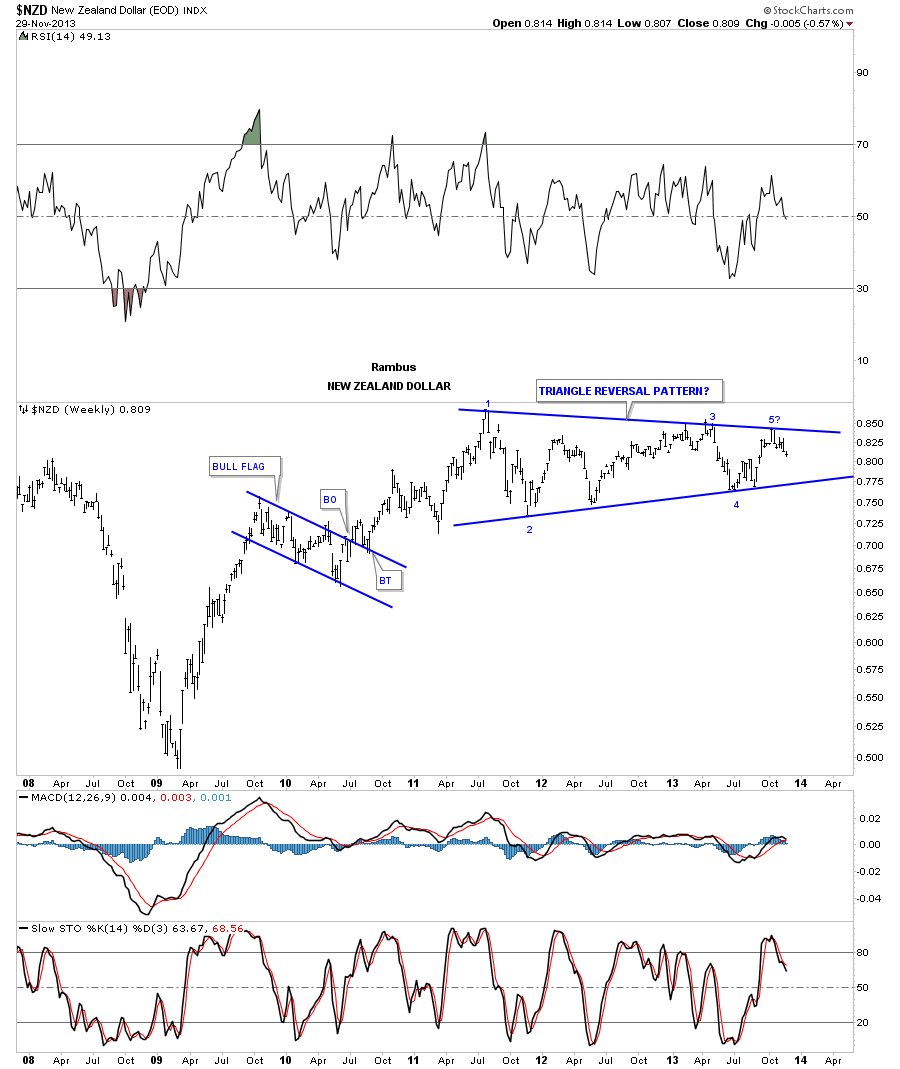
The NZD, New Zealand Dollar, rallied up to the top blue rail of a now possible 5 point triangle reversal pattern. The pattern won’t be complete until the price action touches the bottom rail again. So the pieces of the puzzle are still being put in place that will eventually confirm to us what kind of triangle it will be.
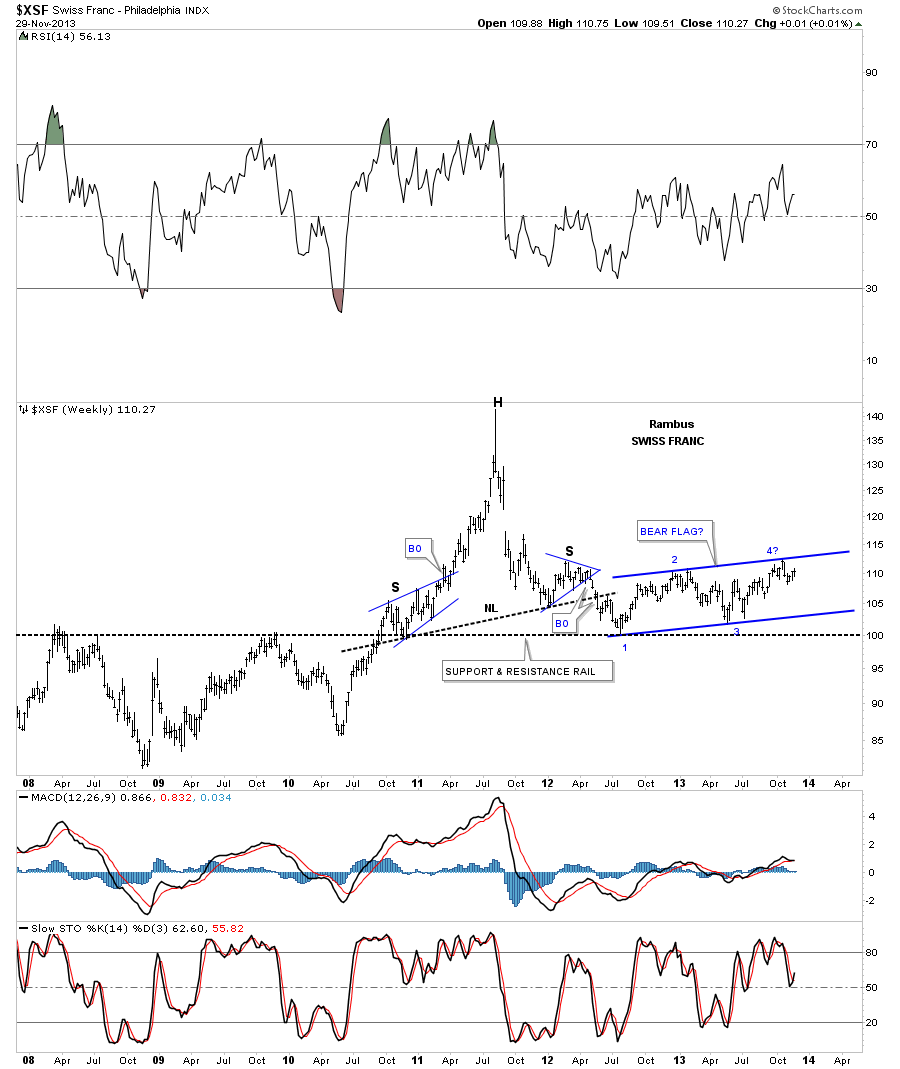
The Swiss Franc was one of the first currencies to top out and in a big way. It went parabolic into its ultimate peak before it reversed symmetry all the way back down to the black dashed support and resistance rail at 100. Since hitting the big support and resistance rail at 100 the Swiss Franc has been building out what looks like a huge blue bear flag. It still has alot of work to do but as long as the price action stays below the top rail it is what it is.
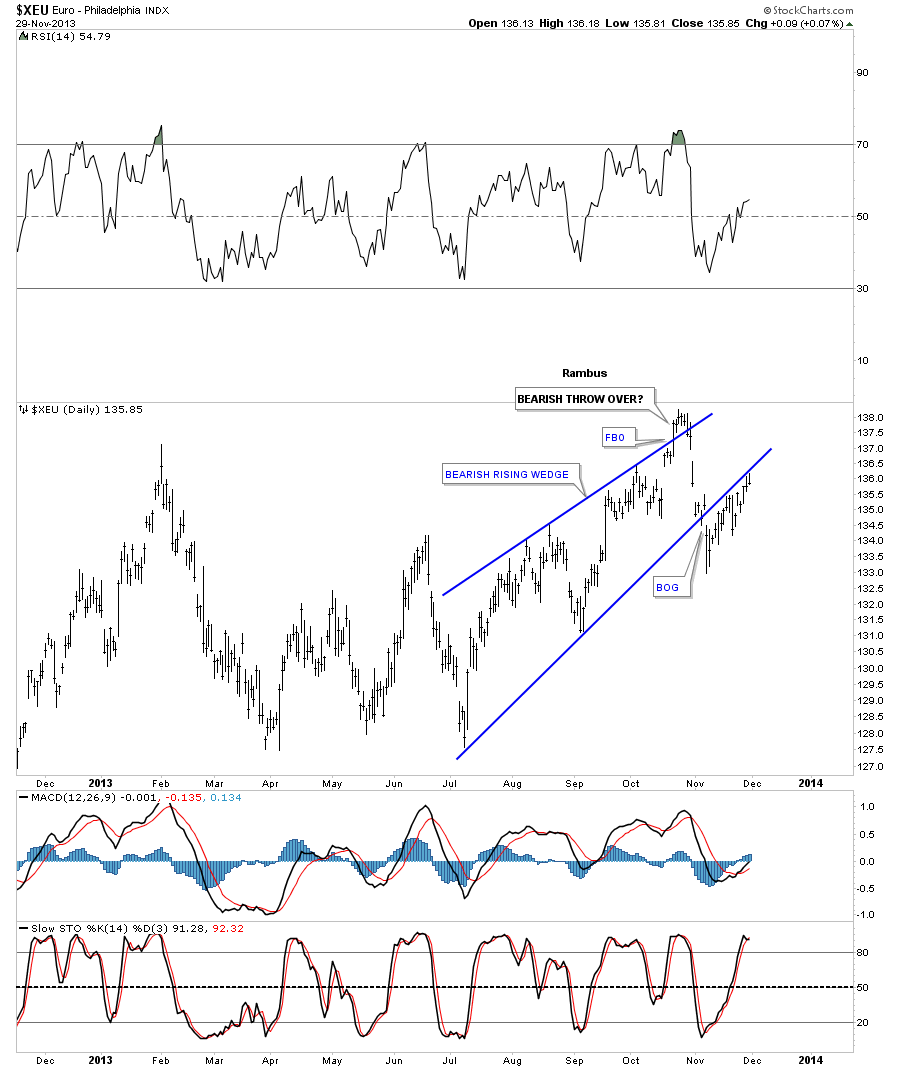
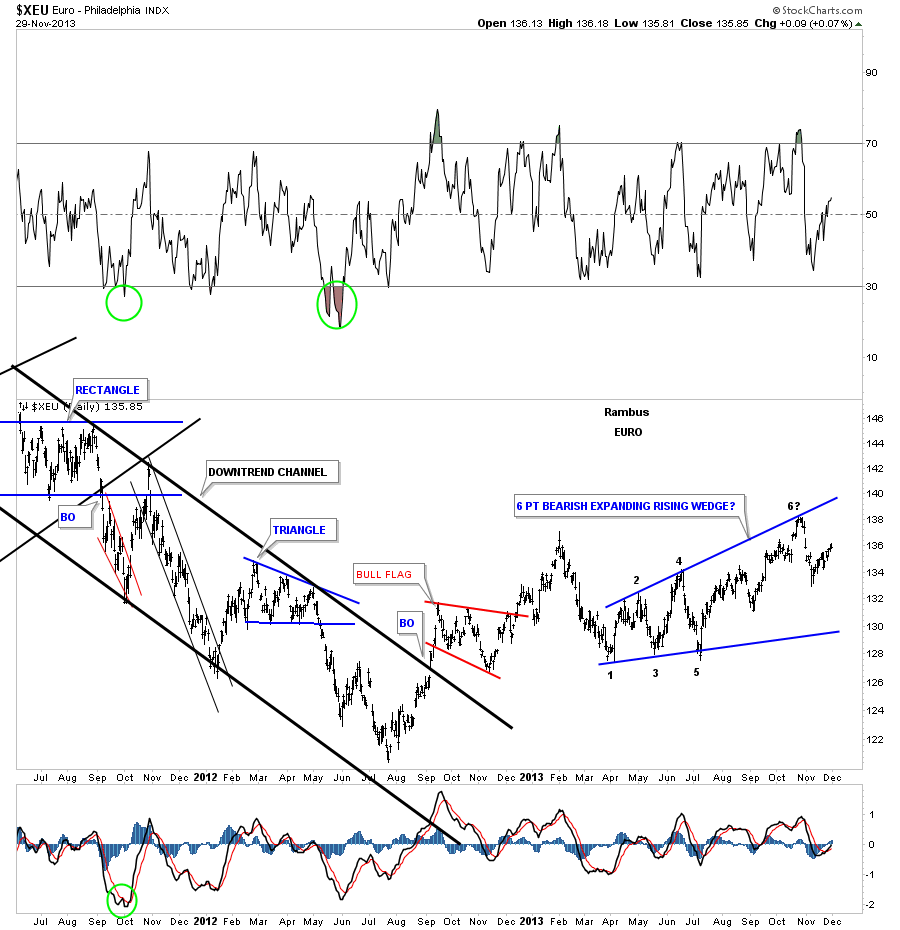
Lets now look at the euro that has been one of the stronger currencies out there. This daily chart shows how the euro broke down below the bottom rail of a bearish rising wedge. It’s not uncommon, with a wedge pattern, that the price action can rally for a prolonged period of time just below the bottom rail of the rising wedge. As you can see it has been testing the underside of the bottom blue rail for close to a month now. A close back inside the rising wedge will negate this pattern. So far the bottom blue rail has held resistance.
This two year daily chart for the euro shows a possible 6 point bearish expanding rising wedge that is still a work in progress. This pattern seems the most logical one to me but until it’s complete I have to remain neutral on the euro.
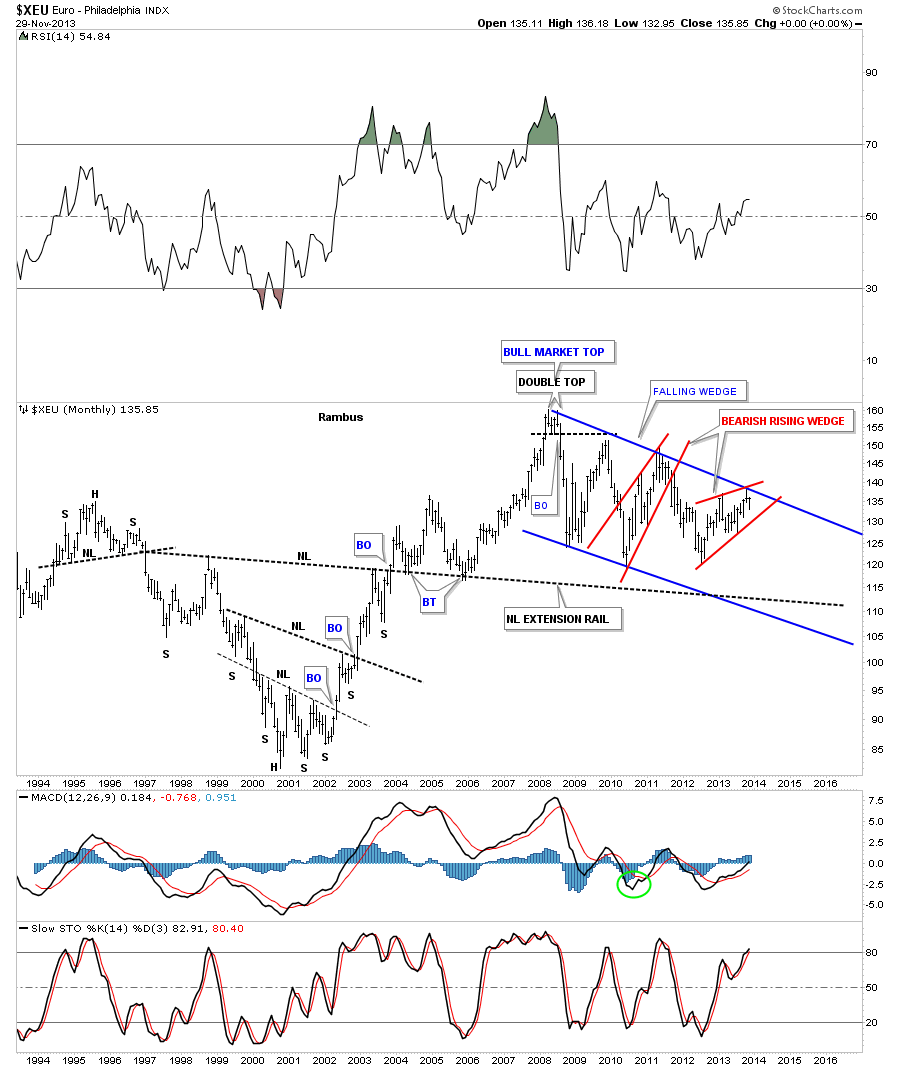
 The long term monthly chart for the euro shows a possible red bearish rising wedge forming within the much bigger blue falling wedge.
The last chart I would like to show you is the long term monthly chart for the US dollar that is showing it trading between two converging rails. The month of October showed the US dollar cracking below the thin support and resistance rail for just a short period of time, before it managed to climb back above it, putting the US dollar back to neutral. There are a lot of short term charts for the US dollar I could show you but for me this is the most important chart to focus on as there is less noise to contend with.
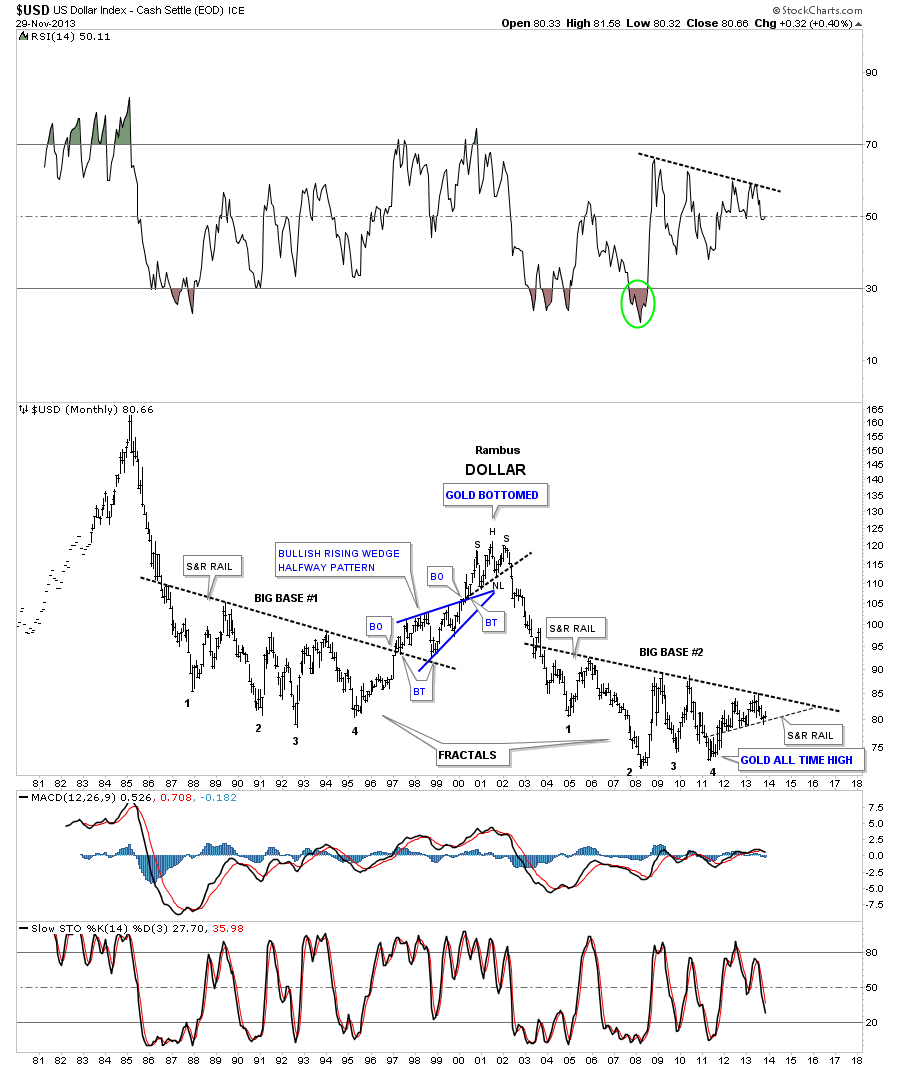
As a whole the currencies seem to be topping out in the big picture. Some have already completed their breakouts and backtests while others are still trading within their topping patterns. The US dollar seems to marking time just chopping around not doing much of anything at the moment. At some point the trend will reassert itself and there will be little doubt as to which way the US dollar is headed. In the mean time we just need to have some patience and wait for some further developments in the other currencies to help guide us along. All the best…Rambus

In our essay on precious metals from Nov. 22, we focused on the markets from the long-term perspective. As we wrote in the summary:
(…) the final bottom for the decline in gold, silver and mining stocks doesn’t seem to be in just yet.
On the next trading day, after the essay was posted, gold, silver and mining stocks declined and dropped to their fresh monthly lows. Although we’ve seens some improvement in recent days, precious metals still have been trading in the narrow range.
Many times in the past, the situation in the U.S. dollar and the euro gave us important clues about future precious metals’ moves. Therefore, today we’ll examine the US Dollar Index (from many perspectives) and the Euro Index to see if there’s anything on the horizon that could drive the precious metal market higher or lower in the near future. We’ll start with the long-term USD Index chart (charts courtesy byhttp://stockcharts.com).
From the long-term perspective, the situation hasn’t changed much recently. The long-term breakout above the declining long-term support line has not been invalidated. Additionally, the USD Index reversed right in the middle of our target area. Therefore, from this perspective, it seems that the downward move – if it’s not already over – will be quite limited because the long-term support line will likely stop any further declines.
Now, let’s examine the weekly chart.
Looking at the above chart, we see that at the beginning of the month the USD Index reached the 50-day moving average, which triggered a corrective move in the following weeks. With this downward move the U.S. dollar dropped to the low that we had seen three weeks ago, therefore, we might see a post-double-bottom rally in the coming weeks.
Keep in mind that from this point of view the current correction is still shallow, which is a bullish signal for the short term. As you can see on the above chart, recent weeks have formed a consolidation, which is likely a pause before further increases.
Let’s check the short-term outlook.
As you can see on the above chart, the USD Index extended its decline and dropped to the previously-broken support/resistance line created by the June low. Last week, the proximity to this support level (or comments from the Fed about the possibility of tapering the QE program – which we don’t believe, by the way) triggered a sharp move up, which took the dollar above the level of 81 once again. Therefore, since this level was reached once again, it seems that we might see a similar rally once again. Additionally, the greenback formed a daily hammer (reversal) candlestick, which is another bullish sign.
On top of that, both happened right after the cyclical turning point, which amplifies their bullish implications. Connecting the dots, it seems that another move up could be seen shortly.
Let’s now take a look at the medium-term Euro Index chart.
As you see on the above chart, since the beginning of the week, the euro has continued its rally. The Euro Index moved above the level of 135 once again and corrected exactly 61.8% of its October-November decline (to 136.09).
At this point, it’s worth mentioning the short-term rising support line based on the July and September lows, which is slightly above the 61.8% retracement. Looking at the above chart, we clearly see that despite the recent corrective upward move, the breakdown below this line hasn’t been invalidated.
Combining these two facts, we can conclude that the move up is quite likely over and the decline can continue. If we see a move below 131.56, the bearish implications will be even stronger.
Having discussed the current situation in the U.S. currency, let’s see how it may translate into the precious metals market. Let’s take a look at the Correlation Matrix.
The Correlation Matrix is a tool which we developed to analyze the impact of the currency markets and the general stock market upon the precious metals sector (namely: gold correlations and silver correlations).
The correlation coefficients remain strongly negative as far as the short-term (30 trading days) link between precious metals and the USD Index is concerned. The 10-day column includes values close to 0, which simply means that gold didn’t respond to dollar’s move lower – which is a bearish sign.
Summing up, looking at the current situation in both currencies, we are likely to see weakness in the Euro Index and improvement in the USD Index on a short-term basis. As mentioned earlier, the USD Index reached its cyclical turning point and, taking this fact into account, it seems that the bottom of the current correction is already in. Additionally, the euro corrected exactly 61.8% of its October-November decline and approached the short-term rising support line without breaking it, which means that the move up is quite likely over. Therefore, currently, the implications for the precious metal market are bearish.
Thank you for reading. Have a great and profitable week!
Przemyslaw Radomski, CFA
Founder, Editor-in-chief
Tools for Effective Gold & Silver Investments – SunshineProfits.com
Tools für Effektives Gold- und Silber-Investment – SunshineProfits.DE
* * * * *
Disclaimer
All essays, research and information found above represent analyses and opinions of Przemyslaw Radomski, CFA and Sunshine Profits’ associates only. As such, it may prove wrong and be a subject to change without notice. Opinions and analyses were based on data available to authors of respective essays at the time of writing. Although the information provided above is based on careful research and sources that are believed to be accurate, Przemyslaw Radomski, CFA and his associates do not guarantee the accuracy or thoroughness of the data or information reported. The opinions published above are neither an offer nor a recommendation to purchase or sell any securities. Mr. Radomski is not a Registered Securities Advisor. By reading Przemyslaw Radomski’s, CFA reports you fully agree that he will not be held responsible or liable for any decisions you make regarding any information provided in these reports. Investing, trading and speculation in any financial markets may involve high risk of loss. Przemyslaw Radomski, CFA, Sunshine Profits’ employees and affiliates as well as members of their families may have a short or long position in any securities, including those mentioned in any of the reports or essays, and may make additional purchases and/or sales of those securities without notice.

-
I know Mike is a very solid investor and respect his opinions very much. So if he says pay attention to this or that - I will.
~ Dale G.
-
I've started managing my own investments so view Michael's site as a one-stop shop from which to get information and perspectives.
~ Dave E.
-
Michael offers easy reading, honest, common sense information that anyone can use in a practical manner.
~ der_al.
-
A sane voice in a scrambled investment world.
~ Ed R.
Inside Edge Pro Contributors

Greg Weldon

Josef Schachter

Tyler Bollhorn

Ryan Irvine

Paul Beattie

Martin Straith

Patrick Ceresna

Mark Leibovit

James Thorne

Victor Adair