
Bonds & Interest Rates
Ed Note: Eventually, after the Federal Reserve has done everything in its power to keep interest rates low, a giant bear market in Bonds is looming. The Fed Fund rates hit a high in May 1981 of 20%. and a low of .25% in Dec 2008. Since then Janet Yellen kept the Fed Funds rate between .05% & .75% before creeping a bit higher to 1.5%. The 30 year bond high was 176.94 on July 8, 2016, and has since fallen to the 150 area. It is a relief that this analyst Rambus has clearly laid out a technical case that that huge 36 year bull market in Bonds appears to finally be ready to roll over into a significant bear market. For anyone with exposure to interest rates, be it through mortgages, loans of investments, this analysis could be absolutely critical to navigating the next decade or more successfully. – Rob Zurrer Money Talks Editor
TMV : 3X Leveraged Short on Treasury Bonds
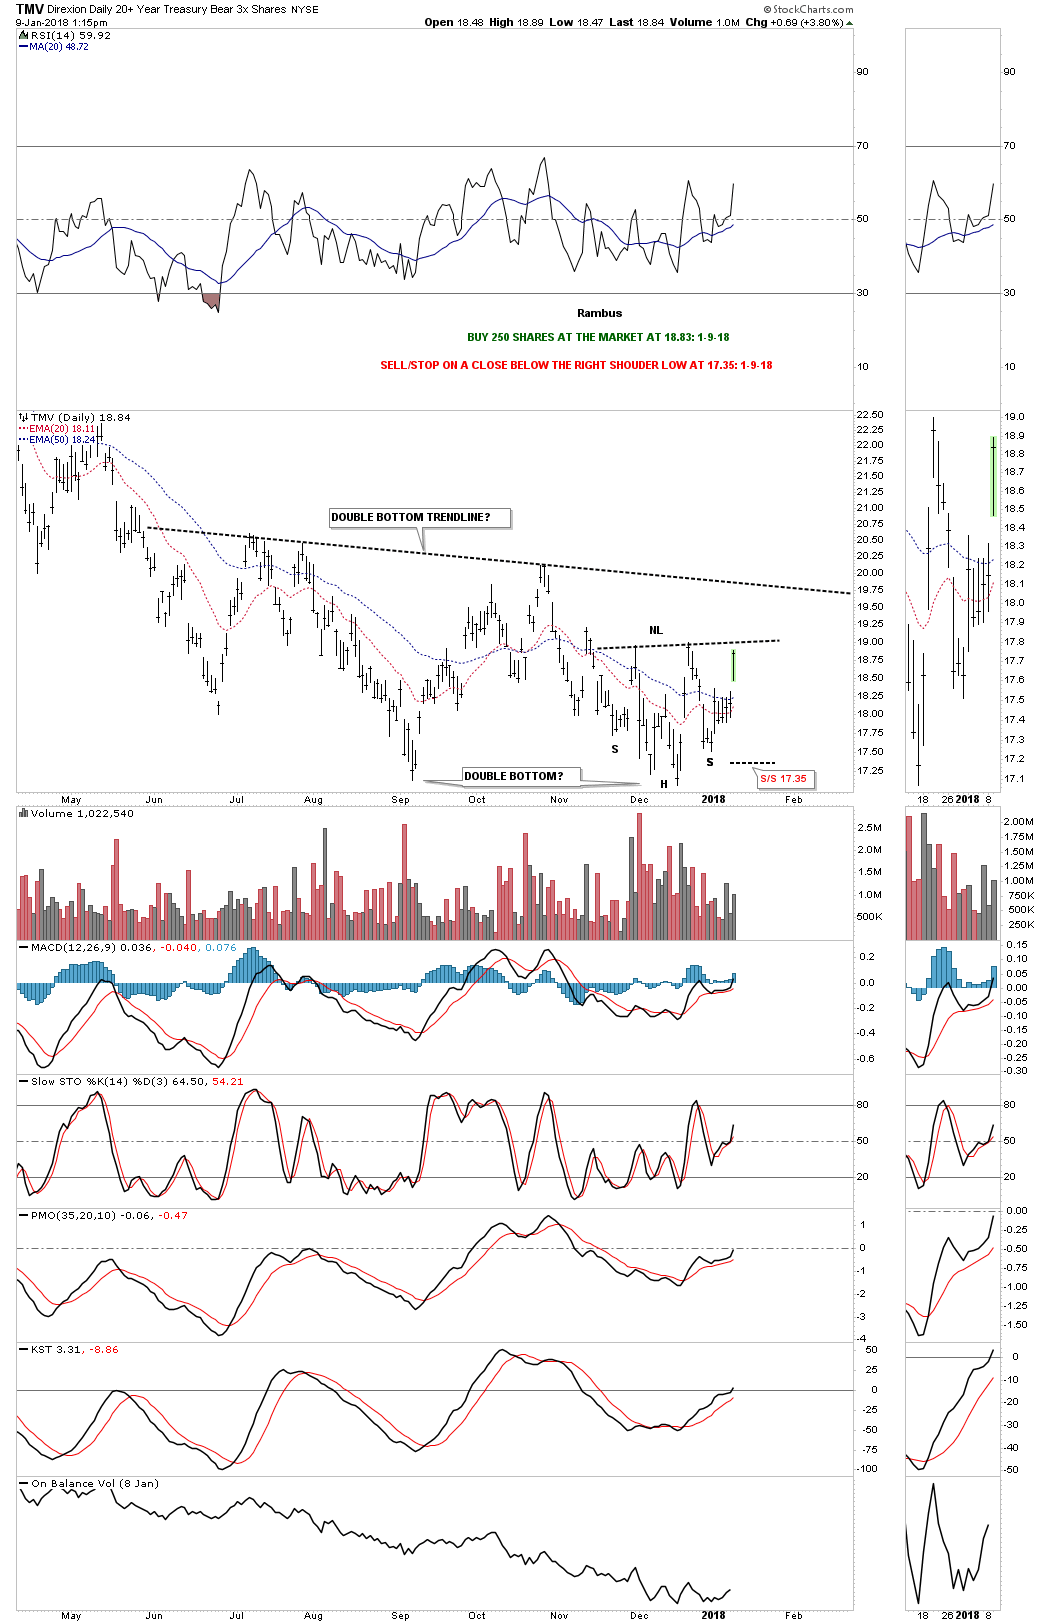
TMV is a 3 X short the TLT 20 year treasure bond etf. This trade is based on the TLT. For well over three years now the TLT has been building out what looks like a massive H&S top with the top of the right shoulder now in play. I’m going to take an initial position and buy 250 shares of TMV, 3 X short the TLT, and buy 250 shares at the market at 18.83 with the sell/stop on a daily close below the right shoulder low on the daily chart for the TMV at 17.35. I’m anticipating the the right shoulder high on the TLT will be the ultimate high. There will be several more entry points if this trades starts to workout.
A second buy point would be on the breakout above the neckline on the daily chart for the TMV. A third buy point would be on a breakout above the double bottom trendline.
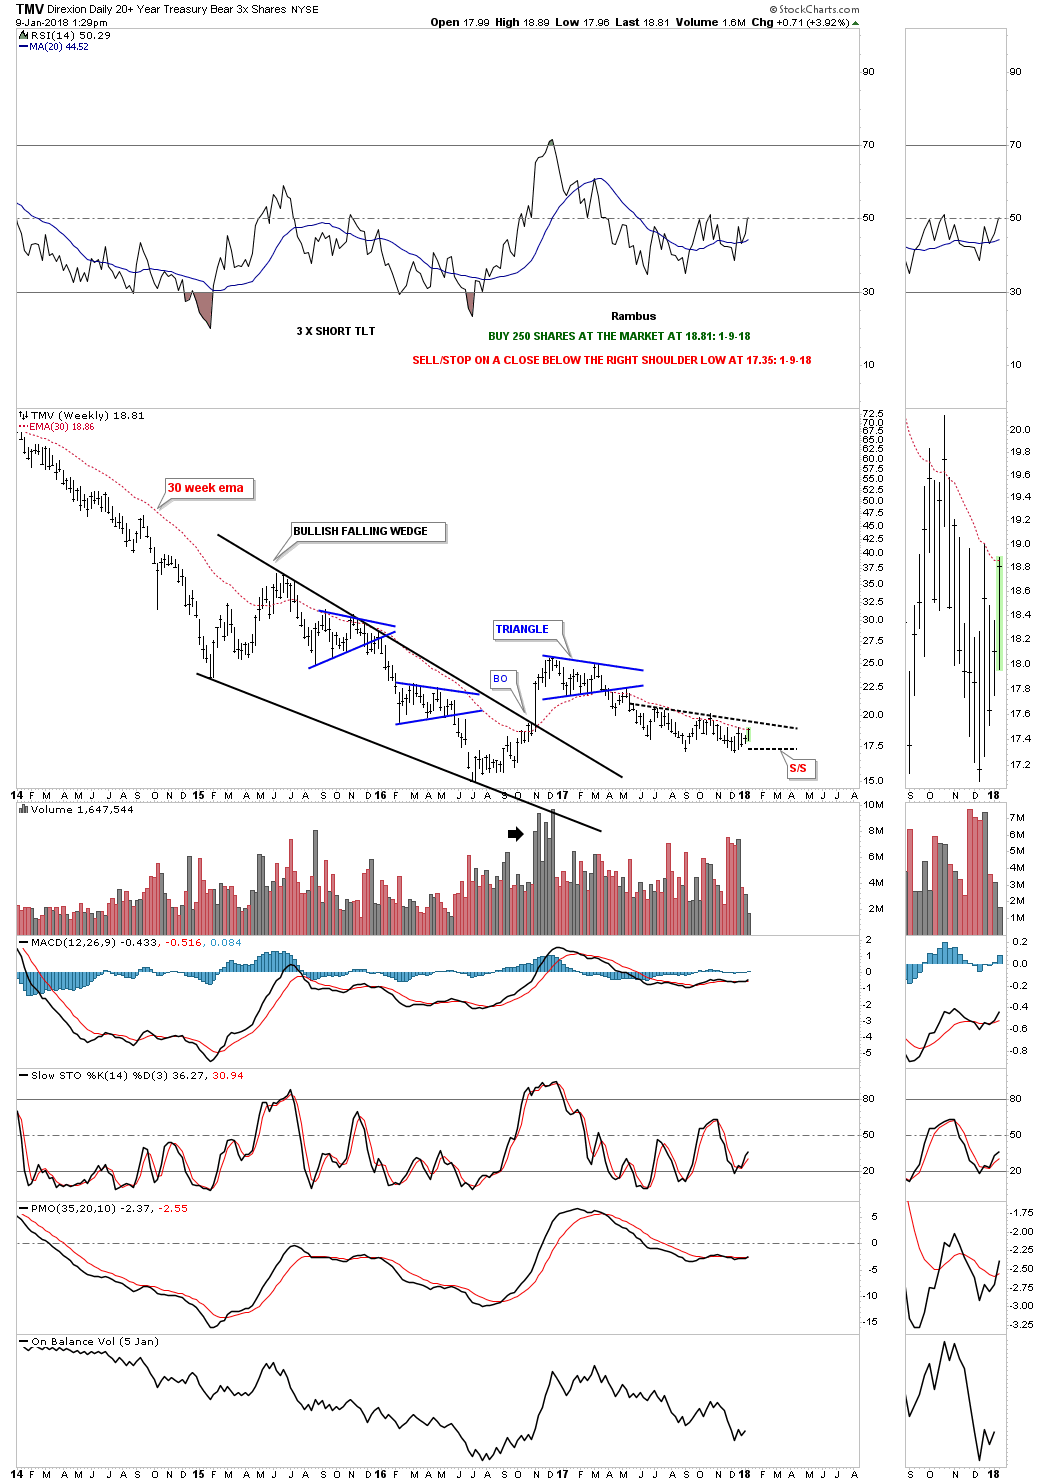
Below is the weekly chart for the TMV. The more conservative members may want to wait for the breakout above the double bottom trendline and the 30 week ema.
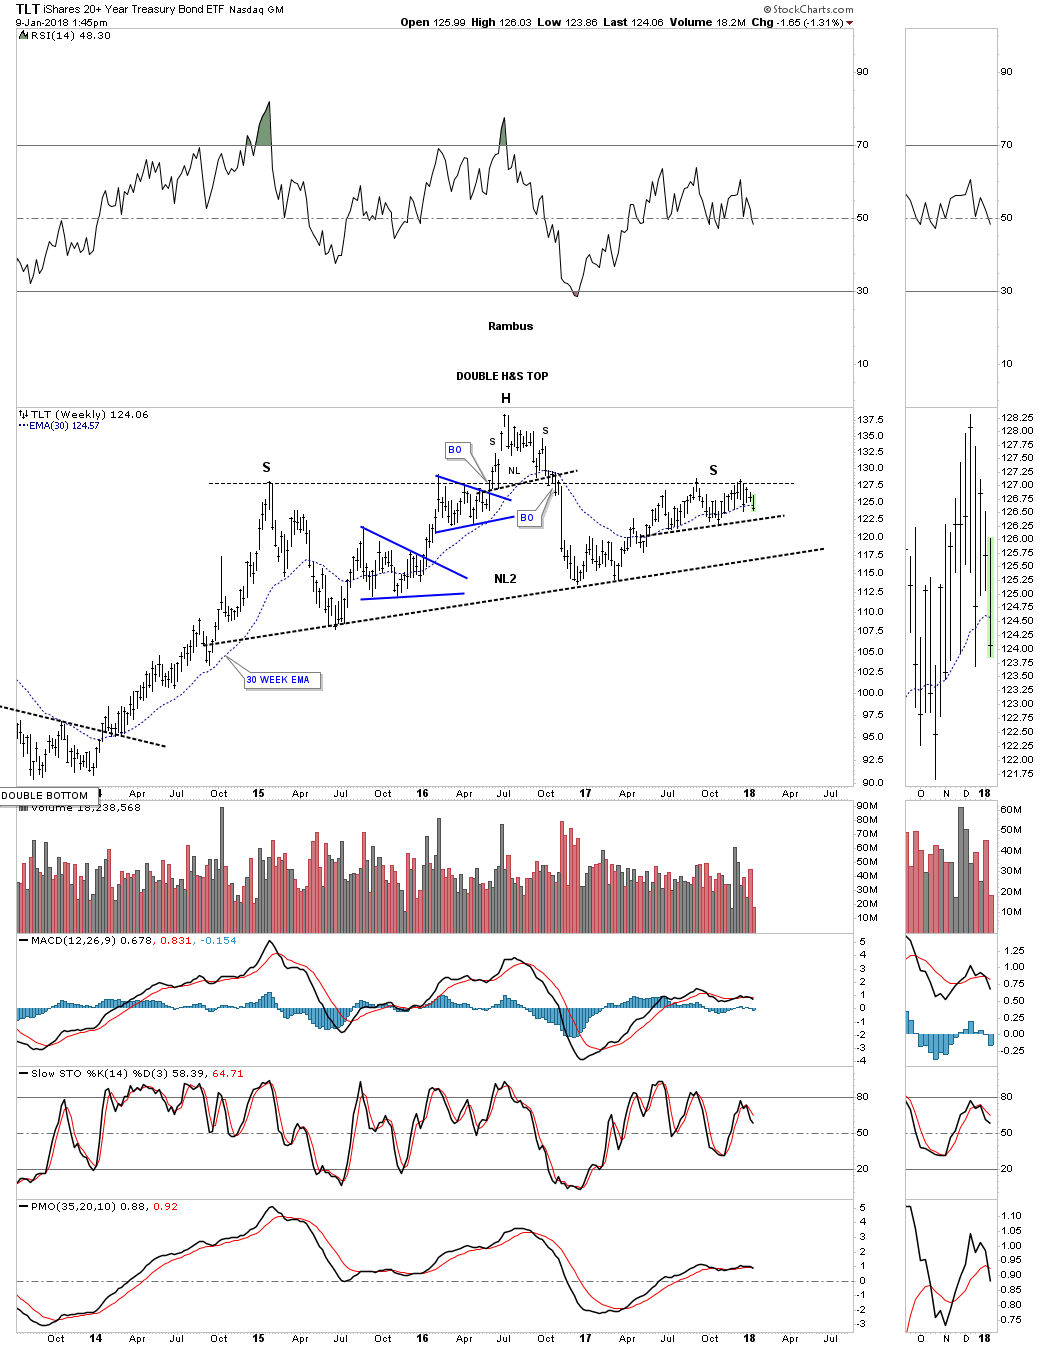
Below is a one year daily chart for the TLT which shows the possible double top right shoulder high that we’ll looked at on the weekly chart. Reverse symmetry may suggest we could see a small bounce off of the neckline as the 200 day ma is also intersecting the neckline.

This next chart is a weekly look at the TLT which puts everything in perspective. There is some nice symmetry forming on this 3 plus year H&S top where both the left and right shoulder highs formed at the same high. This chart also shows you why I’m willing to take an initial position up here toward the possible right shoulder high.
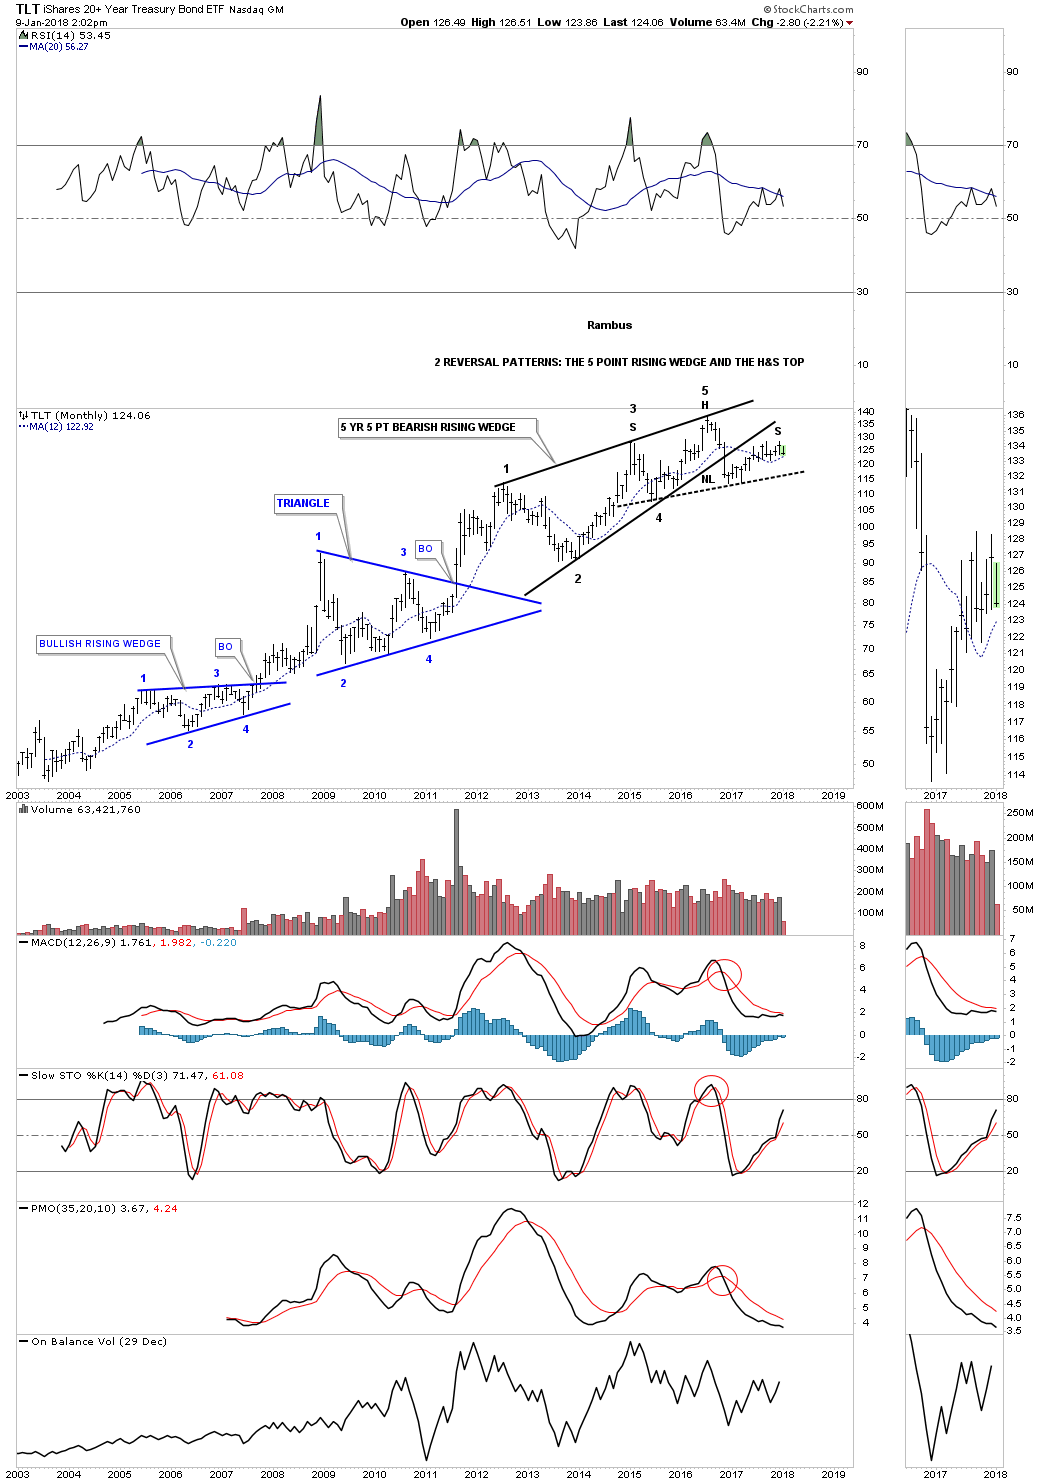
The long term monthly chart for the TLT is showing a possible classic H&S top building out. I’ve shown you many cases that a H&S pattern can buildout with the left shoulder and head forming inside of a wedge pattern, in this case the 5 year 5 point bearish rising wedge with the right shoulder forming on the backtest to the underside of the bottom rail. TLT has fallen just shy of a complete backtest to the bottom rail, but in this case it looks close enough. As you can see my entry point is very early if this very large H&S top plays out. There will be several more good entry points if things start playing as these charts are suggesting. We basically have two separate reversal patterns forming in the same location.

Global Bond Markets to Enter New Phase in 2018
2017 was supposed to be the year that would put an end to modest growth, lukewarm inflation and anemic bond yields. It didn’t live up to the hype. But pressures are building, and that means volatility ahead—as well as opportunity.
Global growth and US growth were solid last year, so the Federal Reserve continued to slowly drain liquidity from the system. The world’s most influential central bank raised official interest rates and began the long process of reversing quantitative easing (QE), which had poured trillions of dollars’ worth of liquidity into the markets after the 2008 global financial crisis.
But counter to expectations and the Fed’s intention, bond yields remained stubbornly low (Display). In the US, long-term Treasury yields fell while shorter-dated ones rose, causing the yield curve to flatten. Prices on equities and high-yield bonds continued to rise, and US and European investment-grade credit spreads tightened as well. Overall, financial conditions were even easier by the end of the year than they had been at the start.

Is the US Economy Heading for a Time Out?
While some investors are concerned about the Fed not making any headway, others have the opposite concern. They’re worried about the flat shape of the US yield curve. That’s because, historically, a flat yield curve has signaled a potential deceleration in economic growth. Could a recession be imminent?
We don’t think it’s time to worry about a looming recession just yet. The curve is still considerably steeper today than it was in the run-up to previous recessions (Display).

So why is the US yield curve so flat? We think it has to do with global QE. In other words, we’re seeing the Fed’s modest tightening activities being offset by the easing still in place by the European Central Bank (ECB) and the Bank of Japan (BOJ).
These central banks are still buying bonds and other financial assets, effectively putting pressure on long-term interest rates—including those in the US. What’s more, there’s still a tremendous amount of liquidity in the US financial system, and it will take time for the Fed to drain it.
Tighter Conditions Ahead—and This Time We Mean It
Over the near term, yields and inflation may remain low and the US curve relatively flat. But with the US economy operating at full capacity, the Fed isn’t going to tolerate these easy conditions for very long. They’ve planned three rate hikes for 2018.
We actually expect them to hike four times to counter global pressures and tap the brakes on the US engine more firmly. Could it take more hikes? Possibly, if the recently passed changes in US tax policy cause growth and inflation to accelerate more than expected. As of now, the Fed does expect growth to increase, but their inflation forecast hasn’t changed after the passing of the GOP tax plan.
At some point, other major central banks will also begin to shift from easing to tightening, which will remove some of these headwinds for the Fed. The reduction of monetary accommodation around the world should play out gradually, however, because central banks move at different speeds.
The next in line is the ECB. With euro-area growth improving, we expect the central bank to finish tapering its monthly bond purchases in the second half of the year and to begin raising official rates in 2019.
And in the not-anytime-soon category: The BOJ is likely to maintain its policy of capping long-term bond yields, since core inflation remains well below target, despite improving growth. And China’s policymakers will focus on the quality of growth and on reining in excessive leverage, especially in the shadow banking system.
Policy variance creates dispersion in global rate markets. And dispersion means opportunity for global bond investors, even as rates begin to rise.
The currency markets will also be an important factor in 2018. The dollar was unusually weak last year, given the opposing monetary directions of the Fed relative to the ECB and BOJ. The weak dollar helped global asset prices in 2017; a change in direction in 2018 might alter that outcome.
How to Behave in the Post-QE Era
With central banks normalizing monetary policy, some investors are tempted to put all their eggs in the credit basket. But corporate bond valuations are stretched, and the US corporate credit cycle is in its late stages, so investors should probably think twice about that. Should bond investors sit on the sidelines instead?
Not at all. By diversifying across multiple sources of income and being very selective, it’s possible to ride out waves of volatility without taking on undue risk. Here’s how:
Invest in a barbell strategy if you’re an investor who wants to maintain a lower risk profile. This approach balances interest-rate risk and credit risk and alters the weightings as valuations and conditions change, continually adjusting the balance as needed. As rates rise, a barbell strategy includes US Treasuries and other government bonds, which provide important diversification to credit exposure no matter the environment.
Over the medium term, more than 90% of US Treasury returns come from the yield. This means that rising rates can dramatically boost income for investors who are not primarily focused on short-term price fluctuations.
What’s more, higher rates will eventually slow growth and put an end to the credit cycle. In these periods, investors can rebalance their portfolios by selling US Treasuries and buying credit assets at discount prices.
Diversify your high-income portfolio, and be selective. When yields are low, valuations are high and dispersion is on the rise, it’s more important than ever to exercise caution. Investors should resist the urge to reach for yield and instead concentrate on maximizing opportunity and reducing risk. A global, multi-sector strategy can provide access to multiple sources of income and return.
We see value in US securitized assets, emerging-market (EM) debt and subordinated European financial bonds. Subordinated European banks offer attractive yields to compensate investors for the risk they’re taking by buying a bond further down the capital structure.
US high yield is in the later stages of the credit cycle. That means investors should be choosy about what they buy. But they shouldn’t avoid this market altogether. High-yield bonds are less sensitive to interest rates than other bonds are. And their steady income can enhance total portfolio returns even as rates rise.
What not to do? Don’t replace your high-income strategy with a portfolio of leveraged bank loans in the hopes that bank loans will protect you against rising rates. Bank loans have failed to meet those expectations.
Allocate to emerging-market debt (EMD). EM bonds delivered strong returns last year. We think the sector has more potential, thanks to improving economic fundamentals, stable or falling inflation, and critical reforms among EM countries—reforms that have reduced their vulnerability to external shocks.
With global economic and geopolitical risks rising, however, investors will have to exercise caution. Fortunately, political risk tends to be country specific. This means investors can limit the volatility that any single country’s political risks might generate by being selective and by diversifying across EM countries.
Indeed, EMD has evolved so much over the past decade that it is now itself a global, multi-sector opportunity set offering the ability to diversify by country, credit and currency. Many developing countries have, in a sense, already emerged and are essential engines of global growth. In our view, a fixed-income portfolio today would be incomplete without them.
Managing Transition
Signs point to 2018 as an important transition year for markets. For nearly ten years following the unfolding of the global financial crisis in 2008 and the subsequent Great Recession, monetary policy has been extremely stimulative. That era has come to an end.
While this change in monetary policy may not be terribly important to global economic growth, we do believe that it could have an impact on asset prices. It will certainly help drive volatility of those asset prices up from the abnormally low levels of 2017.
Investors who are prepared to seize the opportunities and navigate the challenges ahead will find the transition phase easier.
The views expressed herein do not constitute research, investment advice or trade recommendations and do not necessarily represent the views of all AB portfolio-management teams.

US treasuries are seeing action we have not seen for a while: Strong sharp steepening of the yield curve.

The yield curve is said to steepen when the spreads between short-term and long-term rates increases. The yield curve flattens when spreads shrink.
- A bearish steepener occurs when rates are rising and long-term yields are rising more than short-term rates. Spreads widen.
- A bullish steepener occurs when rates are falling and short-term rates are falling faster than long-term rates. Spreads widen.
- A bullish flattener occurs when rates are falling and long-term rates are falling faster than short-term rates. Spreads narrow.
- A bearish flattener occurs when rates are rising and short-term rates are rising faster than long-term rates. Spreads narrow.
The terms bearish and bullish refer to capital gains (bullish) or losses (bearish) if one is invested in government bonds.
Bearish Steepener Meaning
A bearish steepener is generally a sign that market participants believe the economy is getting stronger and the Fed (Central Bank), will be hiking rates faster than previously anticipated or more than anticipated.
What Happened Today?
- The housing market was stronger than expected: Housing Starts Jump More Than Expected: Economy Overheating?
- The current account deficit shrank more than expected: Current Account Deficit Shrinks Due to Hurricanes
June Rate Hike Odds

Synopsis
- The Fed Funds rate is currently 1.25% to 1.50%
- The odds of two quarter point hikes through the June meeting increased from 32.5% yesterday to 38.1% today. This is consistent with the bearish steepening of the yield curve.
I did not believe the Fed would hike as much as expected in 2018, and today does not change my mind.
By Mike “Mish” Shedlock
Bank of Canada governor Stephen Poloz cited numerous worries plaguing the economy during his speech to Toronto’s financial elites yesterday at the prestigious Canadian Club.
However, the title of Poloz’s presentation, “Three things keeping me awake at night” seemed odd, given positive recent Canadian employment, GDP and other data.
Poloz highlighted high personal debts, housing prices, cryptocurrencies and other causes for concern, along with actions that the BoC is taking to alleviate them. His implicit message was (as always) “We have things under control.”
But if that’s all true, then Canada’s central bank governor should be sleeping like a baby. So, what is really keeping Mr. Poloz up at night? Three possibilities come to mind.
The Poloz Bubble
Firstly, far from just a housing bubble, Canada’s economy shows signs of being in the midst of an “everything bubble.” Bitcoin, for example, hovered near CDN $23,000 this week. Stock and bond valuations are not far behind in their relative loftiness.
Worse for Poloz, who took office four years ago, his fingerprints are all over those bubble-like levels.
Canadian stock, bond and house prices were already at dizzying heights when Stephen Harper hired Poloz with the implicit expectation that he would juice up the economy, in preparation for what Canada’s then-Prime Minister knew would be a tough upcoming election.
Poloz didn’t disappoint, promptly delivering a nice Benjamin Strong-styled “coup de whiskey” to asset prices in the form of two interest rate cuts, which brought the BoC’s policy rate down to just 0.50% during the ensuing months.
Although Harper lost the election, loose BoC policy continues to provide the Canadian government with free money to borrow and spend as it wishes.
More broadly, the Poloz BoC’s current policy, like that of the US Federal Reserve, is to boost asset prices even higher in the hope that the resulting wealth effect will trickle down to spur economic activity among ordinary Canadians.

At the household level, the BoC’s low interest rates enticed Canadian families to borrow themselves to the hilt. Businesses haven’t been that far behind.
The upshot is that total government, private sector and personal debts are now in nosebleed territory with Canada’s economy seemingly on a knife’s edge, in danger of crumbling at the first patch of rough road.
Chained to a Ponzi
Another worry is that the Poloz BoC, by broadly mirroring the Federal Reserve’s actions, has firmly lashed Canada to a US economy which could prove to be an even bigger Ponzi than its own.
America’s “everything bubble”, like Canada’s, has been stroked by a central bank that has been pushing credit growth at a rate faster than GDP growth, a textbook Ponzi scenario.

One result, as Grant Williams, co-founder of Real Vision Television, noted in a recent presentation, is that US stock prices are currently far higher than they were during the Internet and housing bubbles. “[Central bankers] keep hoping that this time is different,” Williams warned. “But ladies and gentlemen – it’s never different.”
Refusal to ring fence Canada
Another worry for Poloz to ponder, is that although the BoC has identified financial system interconnectedness as a key concern, the central bank has done little to ring fence Canada’s economy from huge global macro threats on the horizon.
That’s particularly true of the hundreds of trillions of dollars in global derivatives books, many of which are unquantifiable, as they are trading outside of traditional exchanges. This threat is particularly acute, as it was the failure of AIG, a derivatives player, to cover its bets (not the subprime mortgage and Lehman implosions as most assume) that sparked the 2008 financial crisis.
Poloz, had he been ready to condone a recession, could have encouraged broader interest rate hikes to incentivize Canadian governments, businesses and households to pay down debts, build up savings and increase overall system stability.
Similarly, instead of building up Canada’s gold reserves to cushion against potential external shocks, the supposedly-independent BoC (as noted above) gives the money it prints to the big banks and the Canadian government to help it finance raises for politicians and bureaucrats.
Government and academic elites would argue that Poloz’s actions are understandable as he has only limited powers. They cite key constraints on the central bank’s actions.
These range from the BoC’s agreement with the Department of Finance to target 2% inflation, the fact that the government has primary authority over foreign exchange purchases and by realpolitik which dictates that Canada has to follow US policies – or else.
Tied to discredited Keynesian econometrics
Others, such as James Rickards, author of The Road to Ruin, would argue that Poloz is plagued with the same “group think” problem that faces Fed Chairmen.
Almost all the top economists these days, despite obvious brilliance, remain trapped by Keynesian/econometrics educations they endured to get their graduate degrees, which left them with few ideas regarding how to generate growth other than to print more money.
Canada’s top central banker rarely deviates from his talking points. So, it’s almost impossible to know what he really thinks.
However, a base case scenario suggests that Poloz (who has considerable private sector experience from his days at BCA Research) knows full well the treacherous position in which the BoC has placed the Canadian economy.
If that’s true, it’s little wonder that he is having trouble sleeping.
Peter Diekmeyer is a business writer/editor with Sprott Money News, the National Post and Canadian Defence Review. He has studied in MBA, CA and Law programs and filed reports from more than two dozen countries.

Back in May, we first reported that Goldman became the first bank to dare to ask if the Fed has lost control of the market, if in slightly more polite terms of course. This is how Jan Hatzius phrased it: “Despite two rate hikes and indications of impending balance sheet runoff, financial conditions have continued to loosen in recent months. Our financial conditions index is now about 50bp below its November 2016 average and near the easiest levels of the past two years.” Several months later, after the third rate hike, Goldman found that once again, paradoxically, financial conditions eased further, and the market rose even more in direct opposition of what Fed rate hikes are supposed to do!

Fast forward to this weekend, when we reported that that lovely word which describes the new normal so well –“paradox” – made a repeat appearance, this time in the last quarterly report by the Bank of International Settlement, which for the nth time issued an alert on the state of the stock market, an alert which will be summarily ignored by everyone until after the crash, and reminded everyone what happened the last time financial conditions eased instead of tightening when the Fed hiked rates (spoiler alert: biggest crash in modern history). This is what the BIS’ chief economist Claudio Borio said (among other things)”

-
I know Mike is a very solid investor and respect his opinions very much. So if he says pay attention to this or that - I will.
~ Dale G.
-
I've started managing my own investments so view Michael's site as a one-stop shop from which to get information and perspectives.
~ Dave E.
-
Michael offers easy reading, honest, common sense information that anyone can use in a practical manner.
~ der_al.
-
A sane voice in a scrambled investment world.
~ Ed R.
Inside Edge Pro Contributors

Greg Weldon

Josef Schachter

Tyler Bollhorn

Ryan Irvine

Paul Beattie

Martin Straith

Patrick Ceresna

Mark Leibovit

James Thorne

Victor Adair