
Asset protection
 “In the background the wealthiest 1% are paying astounding prices at auction. Last week for the first time in history, a daily auction at Christie’s brought in over $1 billion. Prices for everything from top New York real estate to Picasso masterpieces are going at new record highs. The big money is preparing for record asset prices, suggesting that the purchasing power of currencies is heading south. The battle for the cheapest currency continues, and the big money is preparing for it. Precious metals and stocks are heading north as investors prepare to retain their purchasing power.”
….continue reading Richards comments on Central Banks On Verge Of Losing Gold War As China To Reveal Its Gold Hoard & One Last Thought On The Massive US Debt HERE

Why are governments rushing to eliminate cash?
During previous recoveries following the recessionary declines, the central banks were able to build up their credibility and ammunition so to speak by raising interest rates during the recovery. This time, ever since we began moving toward Transactional Banking with the repeal of Glass Steagall in 1999, banks have looked at profits rather than their role within the economic landscape.
They shifted to structuring products and no longer was there any relationship with the client. This reduced capital formation for it has been followed by rising unemployment among the youth and/or their inability to find jobs within their fields of study. The VELOCITY of money peaked with our Economic Confidence Model 1998.55 turning point from which we warned of the pending crash in Russia.
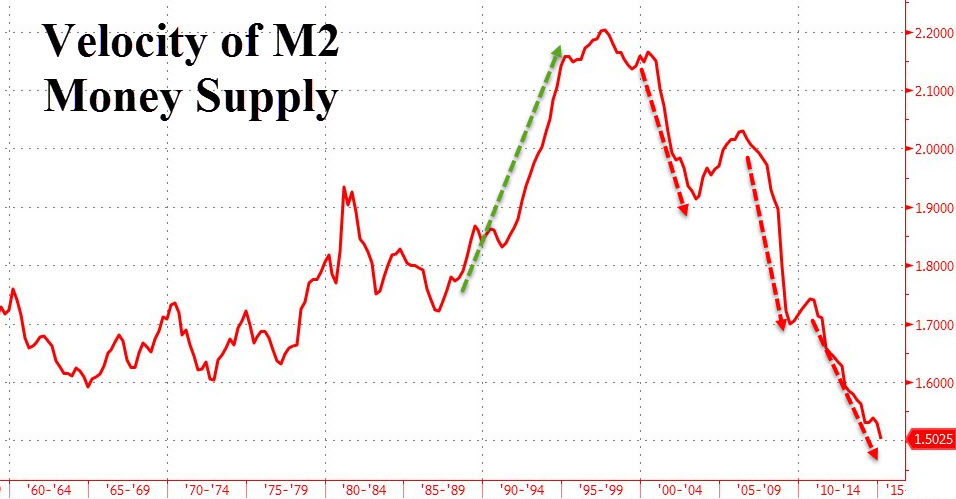
The damage inflicted with the collapse of Russia and the implosion of Long-Term Capital Management in the end of 1998, has demonstrated that the VELOCITY of money has continued to decline.
….read more HERE

Bond Bubble Bursting?
by David Chapman

Larger Image – Source: www.barchart.com
What is going on with bonds? Over the past few weeks, it appears that bonds are having a massive heart
attack. Just a few short weeks ago it appeared that the German Bunds (German bonds are called bunds) were about to plunge under 0%. After all, there was already upwards of $2 to $3 trillion of debt in the Euro zone trading at negative yields. The ECB’s €1 trillion QE program had sparked a huge run into bonds. The market was effectively front running the ECB. That in turn was creating liquidity problems in the bond market. German 10-year yields were pushed to a low of around 0.05%.
It seems that buyers suddenly balked at pursuing bonds. Last week there was a poor French OAT auction (French bonds are called Oats). The ECB wanted yields higher. Oil prices rose sparking some inflation fears. As well, there were faint signs of economic life in the Euro zone. Bonds prices suddenly dropped and in a “heart flash” 10-year German yields backed up to 0.76% (yields move inversely to prices). Overall losses were only €8 Euros or roughly €80,000 on a €1 million bond. It could have been worse.
 Larger Image – Source: www.stockcharts.com
The iShares Barclays 20+ year Treasury Bond Fund (TLT-NYSE) has fallen almost $20 since peaking back in January 2015. That is only about 14% but it has wiped out all of the gains of 2015. 30-year US Treasury bonds have fallen roughly $13 while the 10-year US Treasury note is off roughly $4. Numerous bonds have given intermediate sell signals. It has also caught a number of market participants unexpected.
On a yield basis, the 10-year Treasury note has gone from a low of 1.68% back in January to 2.28% today. The 30-year Treasury bond has gone from 2.25% to 3.07% today in the same period. The rise in yields has seen a rush out of the long end of the yield curve into the short end of the yield curve where US Treasury rates are almost zero for maturities under 3 months and are still only 0.60% out to two years.
Yes, one can get higher yields by buying corporate bonds but consider that credit quality has deteriorated since the crash of 2008. Corporate bond debt issuance in the US today sits at about $1.4 trillion of which $300 billion could be considered junk bonds. Back in 2006/2007, some 28% of corporate debt issuances were B-rated but in the past two years over 70% of debt that has been issued is B-rated. More debt has been issued and standards have fallen.
The world is awash in debt. The McKinsey Global Institute study of 2014 titled “Debt and (not much) Deleveraging” noted that global debt is up 40% since 2007 to almost $200 trillion. Given those numbers were back in 2014 the total could be higher now. Globally debt as percentage of GDP has gone from 269% in 2007 to 286% in 2014. The global debt market is huge compared to the global stock market by a factor of roughly 3X. By comparison, the global gold market is worth roughly only $6.6 trillion at $1,200/ounce.
The global debt problem and the recent drop in bond prices has caught the attention of numerous newspapers and other market pundits. The Globe & Mail, Report on Business has been featuring a series of articles on debt. The latest is found in the May 14, 2015 edition of ROB entitled “A world awash in public debt: The $58 trillion problem”. The Globe is also exploring the dependence on debt for both households and institutions and the looming risks of debt and Canadians addiction to cheap money. This series can be found at http://www.theglobeandmail.com/report-on-business/international-business/sovereign-debt/article24417753/
Trying to find reasons as to why global bond markets have suddenly sold off has left analysts and market pundits flummoxed. After all and especially because of ongoing QE in the Euro zone and Japan weren’t bond yields supposed to go lower and interest rates stay low? The US ended its QE back in October 2014. Bond yields instead of moving higher because of the end of QE in the US, instead moved even lower. Oh yields did wobble and the 10-year Treasury note rose as high as 2.38% in November but by the end of January 2015 the 10-year had fallen to 1.68%.
Given the QE programs, maybe everyone thought that yields would fall forever. Yields had fallen to unheard of levels especially in the Euro zone where it was estimated that over $2 trillion of debt was trading at negative yields. Banks throughout the Euro zone were paying negative interest rates and it was the central banks that were leading the way to push yields below zero. There was a cost to leaving your money in the bank. The downward trend in yields trade became overly crowded. No one it seems thought that yields could rise. Until now that is.
But has the jump in yields been really that drastic? When one puts it into a long-term perspective the current bond drop barely looks like a blip. Bond prices have been falling since a major bottom was seen in October 1981. For 34 years bond prices have been moving relentlessly higher. However, they have been interrupted at times by some vicious bond bears. These bond bears appear to occur roughly every 6 to 7 years. Following the 1981 low important bond lows were seen in 1987, 1994, 2000, 2007 and most recently in late 2013, early 2014. Ray Merriman, a financial forecaster www.mmacycles.com has noted the possibility of a six year bond cycle. The six-year bond cycle is a part of an 18-year bond cycle. Again using the low of October 1981 as the start point there was an important bond low in 2000. The next 18-year cycle low is due sometime into 2019-2021.

Larger Image – Source: www.stockcharts.com
With the 18-year cycle breaking down into three cycles of six years, bonds would appear to be in their third and final six-year cycle based on the last 18 year cycle being in 2000. It is possible that bonds have made their top for the current six-year cycle. The six-year cycle itself breaks down in either two 3-year cycles or three 2-year cycles. It could be that the bonds are falling into a 2-year cycle low that could bottom sometime within 4 months of April 2016 or if a longer 3-year cycle low the low would be seen within six months of April 2017.
It is worthwhile to examine what happened during previous six-year cycle lows.
- The 1987 bond bear got underway in March 1987 and culminated in October 1987 coinciding with the 1987 stock market crash that saw the Dow Jones Industrials (DJI) fall roughly 40% from its August 1987 top. Bonds fell roughly $20 from the top in March 1987 to the October 1987 low.
- The 1994 bond bear got underway in September 1993 and made its final bottom in November 1994. The bond collapse occurred during a period when the US$ Index was falling sharply. The US stock market faltered throughout 1994 but there was no big drop. The DJI fell only 12% from a high in early 1994. Bonds fell $26 from the September 1993 top to the November 1994 low.
- The 1999 bond bear got underway in October 1998 and bottomed in January 2000. 1998 saw a stock market bear sparked by an Asian currency crisis and a Russian default. It culminated in October 1998 when the Fed dropped interest rates sharply and flooded the financial system with liquidity in order to prevent a market meltdown as a result of the collapse of the hedge fund Long Term Capital Management (LTCM). The LTCM collapse almost brought down the financial system at the time. Bond prices topped in October 1998 and rose over the next year or so as a result of a strong economy and the Internet/High Tech stock market bubble. Following the bottom in bond prices, the DJI fell 40% over the next two years.
- Bond prices rose irregularly during the first few years of the new century. The Fed once again flooded the financial system with liquidity and lowered interest rates to combat the High Tech/Internet stock market collapse of 2000-2002. This triggered what was known as the housing bubble that topped in 2006. Bond prices topped in June 2005 and fell irregularly for the next two years making their final low in June 2007. Overall bonds fell $14. The fall in bond prices coupled with the collapse of the housing bubble was behind the 2008 stock market panic that saw the DJI lose 55% from October 2007 to the final low in March 2009.
- Prior to the bond market top of 2015, the previous top was seen in July 2012. Bond prices fell $26 from July 2012 to December 2013 with a secondary low seen in April 2014. To date the stock market has not fallen because of the bond bear of 2013. Instead, the stock market has kept on rising seeming to ignore the bond collapse. All previous six-year cycle lows of 1987, 1994, 2000 and 2007 culminated in bear markets for stocks of some degree. The weakest was 1994 and the worst one was the 2008 financial collapse.
It may be that the stock market is not responding to the any hike in interest rates. Or it may be that the stock market is delaying any reaction to a hike interest rates. Everything that is being written about the global debt situation is correct. Upwards of $200 trillion in global debt is not sustainable. The risk of a sovereign debt collapse is high with the most likely candidates being Ukraine and Greece. But Italy is also experiencing considerable debt problems and Japans total debt to GDP is the world’s highest.
The huge amount of debt for governments, corporations and households is a risk and a drag on the global economy. There is little ability to expand debt further as the global economy and in particular the western economies are not growing at a pace that could sustain more debt. All major countries have a higher debt to GDP than they did in 2007 prior to the 2008 financial crisis. China has added the most debt during that period and it too is vulnerable to a debt collapse particularly in its real estate sector. The current debt reports ignore the estimated $100 trillion in unfunded liabilities for the US.
Any rise in interest rates at this time is expected to be contained. There is little economic data suggesting that global economic growth or inflation are about to take off any time soon. That suggests that interest rates could remain subdued for years. That doesn’t prevent periodic rises in interest rates and a collapse in bond prices. The world’s central banks are trapped in what is known as a liquidity trap. No matter how much money they throw at the economy they can’t really decrease interest rates any further. They are already as low as they can go although as is being seen in the Euro zone interest rates are now negative. Monetary policy appears to have become ineffective.
In order to see the ineffectiveness of monetary policy one needs to look no further than Japan. For the past twenty five years Japan has been locked in low growth, low interest rates and seemingly endless injections of QE. The result is that Japan now has the world’s highest debt to GDP ratio and low savings rates. The Euro zone appears to be headed that way. All the western economies are dependent on welfare programs of some degree to maintain the economy. The western economies are aging economies although the US and even Canada are not aging to the extent that Japan in particular and the Euro zone are. The North American economies have exported their jobs to the developing countries that include countries such as China, India and Mexico. These jobs are most likely not coming back.
The recent drop in bond prices appears to be a liquidity problem. Rather than rising interest rates the real risk is that debt collapse occurs due to a sovereign default that in turn triggers contagion and other defaults. A debt collapse is deflationary. A debt collapse in many respects is far more dangerous than a stock market collapse. The debt collapse in 2007 was due to the collapse of the sub-prime mortgage market. It was a classic case of overleveraging. Since that collapse, the debt situation has only gotten worse and the most likely outcome is another debt collapse followed by a stock market collapse.
While gold reacted negatively in to the financial crisis of 2008 falling with the stock market, gold was also the first one “out of the chute” in 2009. From 2009 to the top in 2011 gold prices rose 180%. Despite a three-year bear market correction, gold prices remain up 78% from the 2008 low.
It has been interesting watching the prices fetched by art and other collectables over the past few months. The most recent was the sale of Picasso’s Women of Algiers that sold for a record $179.4 million. Art and collectables have been a hot market. Real estate has also been hot in some countries particularly Canada. The rush appears to be into tangibles as a place to “stash cash”. Art, collectables and real estate have a long history as a store of value despite ups and downs over the years. Both gold and silver also have a long history as a store of value. Could gold and silver experience the kind of price rise that is occurring in the art, collectable and real estate markets?
Bond prices have been falling. But the odds of a major bond collapse is most likely low. The western economies are just too weak to see any huge rise in interest rates. The real risk is more likely a debt default. There have already been a number of corporate debt defaults in China’s overheated real estate market. A sovereign default of either Greece or Ukraine is a real risk. Ukraine is an economic basket case. The global economy is more likely caught in a liquidity trap. In a liquidity trap debt default is a higher risk than for a sharp drop for bond prices.
 The largest and worst sovereign debt crisis, ever, is rapidly approaching.
Greece is now at its tipping point. As I pen this issue, the government of Greece is desperately trying to stave off default on a 750 million euro repayment ($835.7 million) to the International Monetary Fund (IMF).
Whether Greece gets concessions or not, won’t matter. Because come June, Greece faces another 2.6 billion euro repayment (US $2.9 billion).
And come July and August, it will face a whopping 8.7 billion euro ($9.69 billion) repayment — 7 billion ($7.8 billion) of which is owed to the European Central Bank (ECB).
 There is simply no way Greece can pay off that debt. It doesn’t have the money. Just to make a minor 200 million euro payment last week, the Greek government had to call in all excess cash from regional banks, leaving government employees and pensioners waiting for their checks.
Nor can Greece rollover the debt without paying excessive interest rates — near 12 percent for 10-year money — bankrupting the country even further.
Meanwhile, the IMF and the ECB are ramming more and more austerity measures down the throats of the Greek people — all in the name of making sure bondholders and authorities get repaid.
I ask you, is this what the world has come to? Sacrificing the lives of ordinary people to make sure creditors get repaid?
Already in Greece, a recent study shows that the suicide rate has soared 36 percent during the crisis. Not surprising considering the stress the Greek people are under which, in turn, has forced unemployment to 25.4 percent and youth unemployment stands at a whopping 50.1 percent.
If you think Greece is to blame, think again. Sure, like any country, Greece has its tax cheats and black market economy.
But in 2001, Greece was essentially held at gunpoint to join the euro, through forced financings at attractive low interest rates.
And now that it has having trouble repaying that debt, Greece is being held at gunpoint again.
Thing is, it’s not just Greece that is about to reach the tipping point. all of Europe is about to go under. You can see the most indebted of them — compared to their GDP — in this chart here.
While Greece is certainly the worst, Italy isn’t far behind, or is Portugal.
And of those European countries that have debt levels just above or below the 100 percent of GDP level, don’t let anyone kid you. Not one of these countries is capable of servicing its debt, not even France.
Lest you think a sovereign debt crisis is confined to Europe, think again. Europe’s sovereign debt crisis is merely the starting point.
Japan’s debt stands at more than 24 percent of GDP, nearly $12 trillion.
And worst of all is, yes, none other than the United States, where Washington is in hock — not for just its $18 trillion national debt — but for more than $215 trillion — the worst and biggest debt in the history of civilization at nearly 12 times our GDP.
Put another way, if you took every penny of what our country produces in a single year, it would take 12 years to pay off that debt.
Put yet another way, it would require each and every American to give up their earnings and production, essentially go bankrupt, for 12 straight years.
And that’s not even counting the interest expense on the debt, which is sure to rise in the months and years ahead.
A sovereign debt crisis of unprecedented proportions? You bet it is. We all knew it was lurking out there, and now, it’s here. Greece is merely the starting, tipping point.
One of the most important aspects of this sovereign debt crisis as it unfolds over the next several years will be how they impact the financial markets.
Understand that, and you will survive.
Thing is, very few indeed will understand what will really happen. So let me summarize it now.
First, and most obvious, government bond markets are headed into the abyss. Don’t touch sovereign debt with a 100-foot pole. Do so and you might as well commit financial suicide.
Second, and far less obvious, gold and commodities generally: At the beginning stage of the crisis, now, commodities, including precious metals, will remain caught in deflation.
Why? It’s actually rather simple. In the beginning phase of a sovereign debt crisis, investors of all sorts seek the safe haven of hoarding cash. And since the U.S. dollar is still the world’s reserve currency, that’s bullish for the dollar, and bearish for commodities.
But later in the crisis, that thinking will invert, and …
Third, once commodities reach their lows in a panic sell off, they will take flight to the upside, in a massive new bull market, one which will ultimately see gold hit better than $5,000 an ounce.
Why? Because later in the crisis it will become apparent that it is not just the government of Europe that is going under, but also the governments of Japan and the United States.
And when that recognition comes, it will reignite a bull market in commodities and all sorts of tangible assets. In addition …
Fourth, most will expect U.S. equity markets to crash. But that’s dead wrong. The history of sovereign debt crises is that stock markets perform exceptionally well — when government, the public sector, not the private sector, is going bust.
Why? Because no one would dare lend money to government. Because the U.S. stock markets represent the safest, deepest, most liquid bastion of capitalism on the planet. And because our biggest companies, very simply put, will outlast our government.
So get ready. The worst sovereign debt crisis, ever, is right around the corner.
Best wishes, as always …
Larry

 Today King World News is pleased to share a fantastic piece which give readers a stunning look at the war in the gold and U.S. dollar markest. This piece also includes three key illustrations that all readers around the world must see.
The chart below shows that there has been a great deal of short covering in gold recently by the commercials, which is a bullish medium-term indicator for gold.
….view 3 charts & commentary HERE

-
I know Mike is a very solid investor and respect his opinions very much. So if he says pay attention to this or that - I will.
~ Dale G.
-
I've started managing my own investments so view Michael's site as a one-stop shop from which to get information and perspectives.
~ Dave E.
-
Michael offers easy reading, honest, common sense information that anyone can use in a practical manner.
~ der_al.
-
A sane voice in a scrambled investment world.
~ Ed R.
Inside Edge Pro Contributors

Greg Weldon

Josef Schachter

Tyler Bollhorn

Ryan Irvine

Paul Beattie

Martin Straith

Patrick Ceresna

Mark Leibovit

James Thorne

Victor Adair