
Asset protection
 “Writes John Williams, “inflation adjusted June retail sales declined by .6%, weakening annual growth signaled an intensified recession.” The Fed cannot face the idea that they’ve pumped trillions in new money and the US economy is sinking into recession. If the Fed finally concedes that we’re in a recession, it will open the spigots wide, producing something which I think will be close to hyperinflation.
The dollar is rising to new highs. If the recession story is true, the dollar should crash and gold should regain its bull market. In the meantime, turning to Greece, it is testing the patience of the euro nations. My guess is that Greece will end up on its own, and not as a partner in the great euro experiment.” – Richard Russell
The above is an excerpt from the 90 year old Richard Russell’s Dow Theory Letters, a letter that has been coming to subscribers every 3 weeks since 1958. Richard also posts daily updates to his subscibers to his newsletter., a service that began with the advent of the internet. Richard is also responsible for a proprietary indicator call the PTI. Click HERE to subscribe to this valuable service

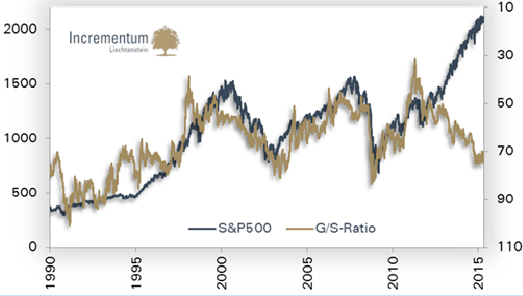
Compelling article and video interview with David Morgan, a big-picture macroeconomist. Morgan, in the video preaches patience, as well as assembles and presents the facts and information that allows him to have conviction in his recommendations and investment holdings.
One of the points he covers is revealed in the dramatic divergence seen in this chart below. Morgan interprets it as Silver being a significantly “better buy than Gold” and that this chart also reveals something else important. To find out quickly what that important fact is go HERE. In the video Morgan explains why Silver is the best inflation edge, not the best deflation hedge, and that Gold is the best deflation hedge. – Money Talks Editor
…..to read the article and view the 32 minute video go HERE
If you want to skip the article summary, the 32 min video is below:
 As people continue to digest breaking news out of Greece and around the world, the Godfather of newsletter writers, 90-year-old Richard Russell, warned that panic will set in if we get confirmation that economist John William’s dire prediction is now unfolding.
….continue reading about John Williams prediction and RR’s opinion HERE

The S&P 500 Index has hit numerous new highs in the past three years. Note the log-scale graph below and the broken support lines from 2000 and 2007. The current support line, depending on where it is drawn, is on the verge of breaking.
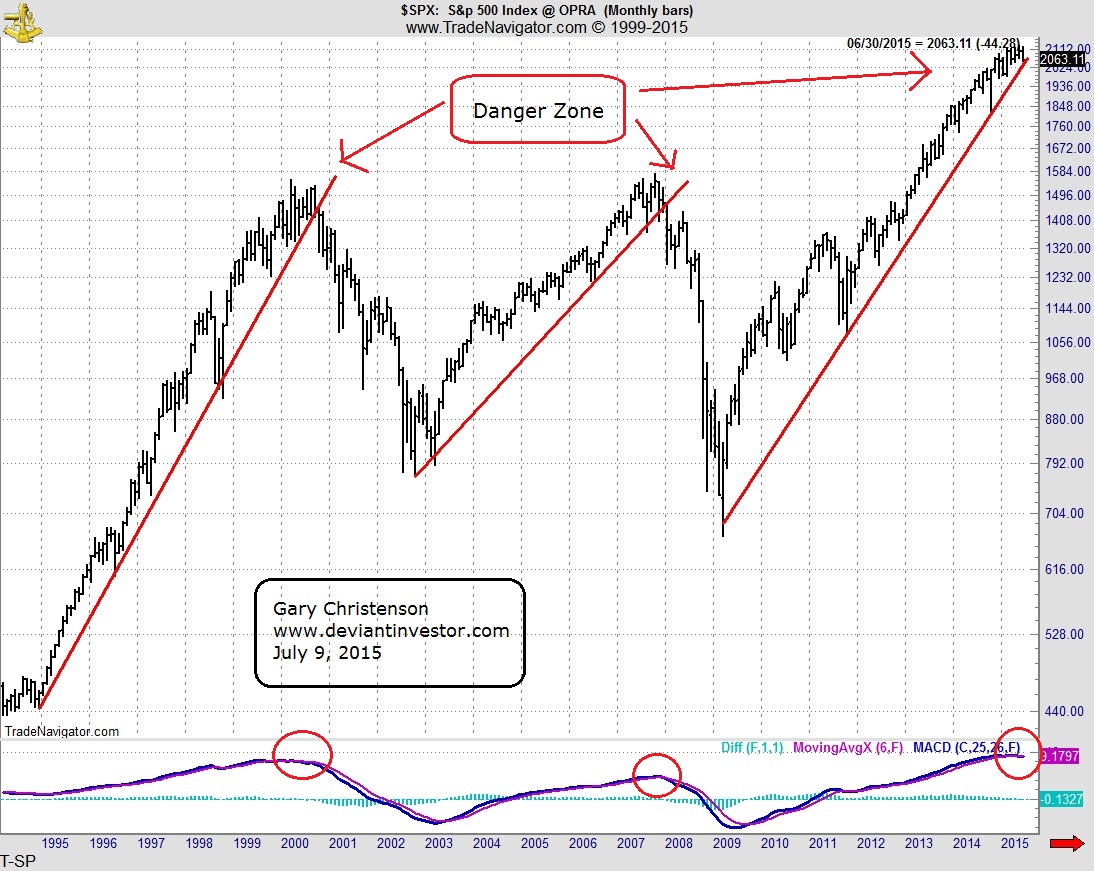
Further, Paul Mylcheerst says the modified monthly MACD has given a sell signal on the S&P. The same indicator gave sell signals close to the peaks in 2000 and 2007.
There is significant risk in the S&P 500 Index in spite of the fact that central banks and governments have successfully levitated the stock and bond markets.
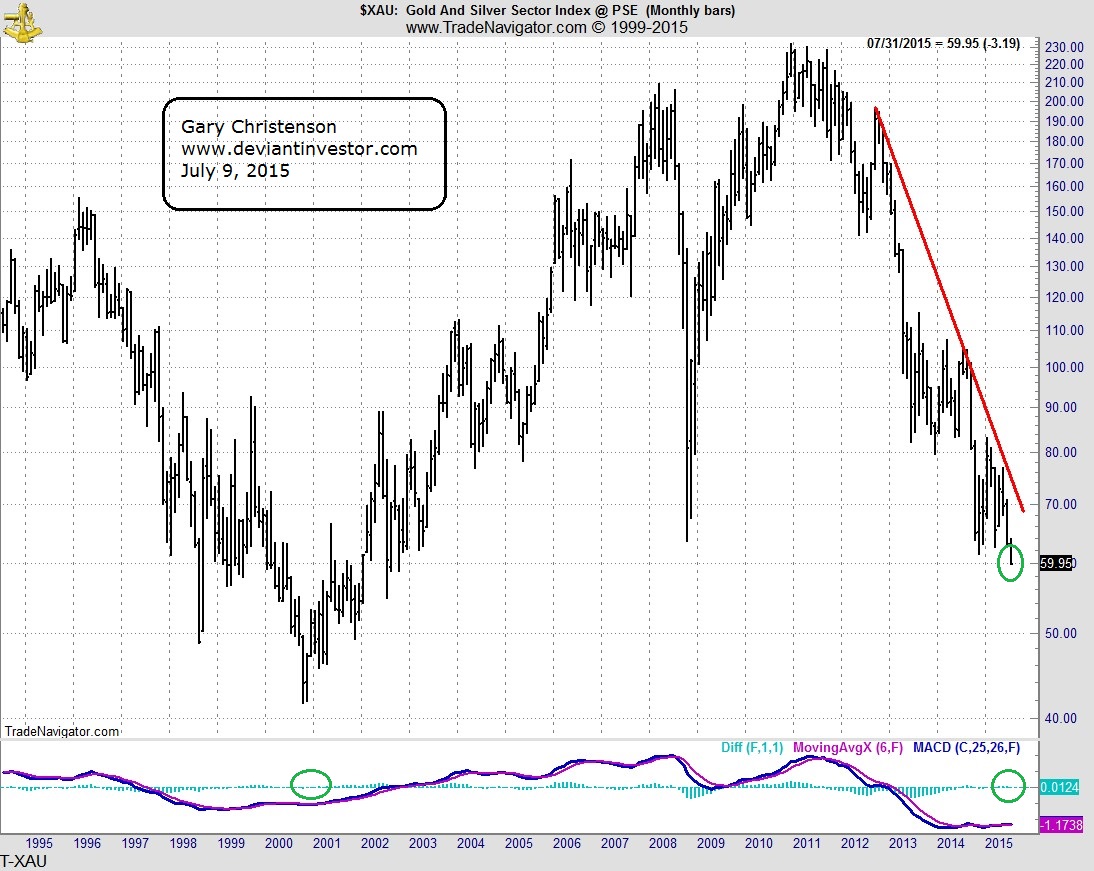
By contrast, the XAU, an index of gold stocks, has fallen to a 13 year low, and the monthly MACD indicator that gave the sell signal on the S&P has tentatively indicated a buy signal on the XAU.
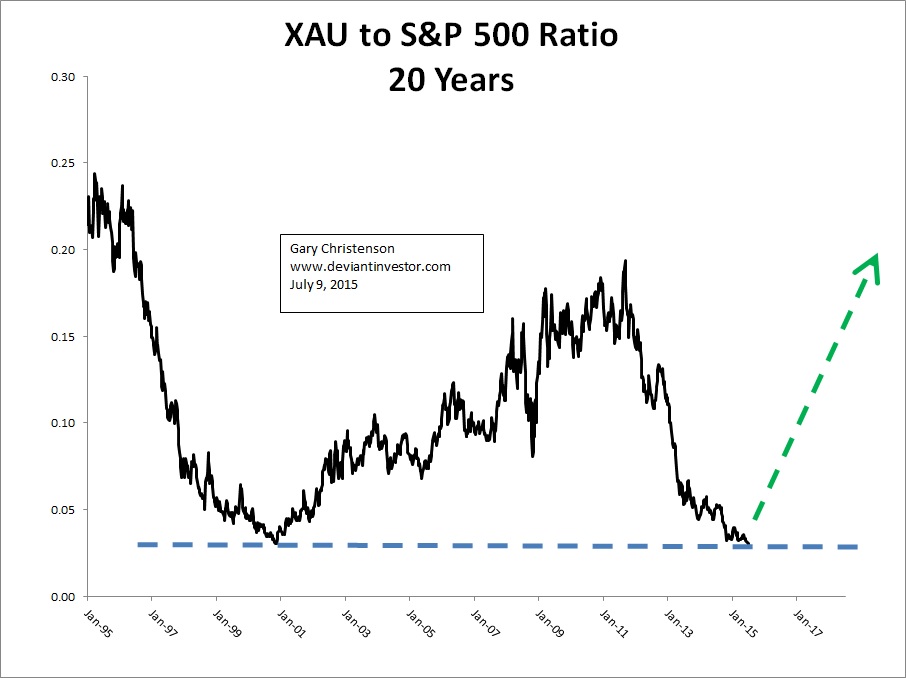
What about the ratios?
Consider the ratio of the XAU to the S&P 500 Index. The ratio is at the low end of the 20 year range and at a 14 year low because the XAU stocks have been crushed and the S&P has been levitated.
The S&P up and XAU down trends appear ready to reverse. The charts show extremes in prices and in the ratio.
The low risk trade is to sell S&P related stocks and to buy gold, silver, and gold and silver stocks. Sell high and buy low!
CONCLUSIONS:
- The S&P 500 Index hit an all-time high in May 2015.
- The XAU index of gold stocks hit a 13 year low this month – July.
- The XAU to S&P ratio shows that gold stocks have been weak for several years and appear ready to reverse higher.
- Gold prices have been crushed since August 2011 while paper bonds and stocks have been “strongly encouraged” by global central banks.
- The MACD (modified by Paul Mylcheerst) has given a monthly sell signal on the S&P 500 Index (don’t discount this), a buy signal on the XAU, and is close to a monthly buy signal on gold.
-
Take the low risk road. At this time the S&P looks like a high risk path while gold, silver and the XAU look like a low risk road.
Gary Christenson
The Deviant Investor

The sheer size and importance of China’s equity markets cannot be overstated. Second in size only to the New York Stock Exchange, the combined value of the Asian country’s stock markets is $14 trillion and change. Or at least it was, before they fell 30 percent, wiping away nearly $2 trillion in value. To put this in perspective, the gross domestic product (GDP) of debt-troubled Greece is around $200 billion.
So how did this happen? The answer has a lot to do with the quantity and quality of investors.
In most major economies, stock markets trading is dominated by professional money managers. But in China, between 80 and 90 percent of the domestic A-share market is made up of retail investors, many of them novices who sought to participate in the yearlong bull run. An eye-popping 40 million new brokerage accounts were created in the one-year period ended in May. The Communist Party, by comparison, gained only a little over one million new members in the same period. At the peak, accounts were being added at a rate of over three million per week.
For many of these first-time or relatively inexperienced investors, the price of entry was margin lending. Cosmic amounts of it. Near the end of June, 2.08 trillion yuan ($335 billion) worth of borrowed funds flooded the Shanghai and Shenzhen markets. Margin lending as a percentage of total market cap rose to as high as 20 percent. In the U.S., it’s about 2.5 percent.
This combination—millions of new accounts mixed with unprecedented leveraging—greatly contributed to the selloff. As you can see above, this leverage is now unraveling as investors are forced to sell in order to meet margin calls.
Beijing has responded with a host of measures to prevent the market from sliding any further, one of the most significant being a ban on huge institutional shareholders from selling until the Shanghai Composite rises above 4500. As of this writing, it’s just above 3800 after breaking a three-day rally.
The good news is that some analysts believe the worst might be behind us. Financial services firm UBS takes the position that, as massive as the correction was, it shouldn’t have a “major” economic impact.
In the meantime, we have raised the cash level in our China Region Fund (USCOX) and are ready to deploy it when the right opportunity arises.
Please consider carefully a fund’s investment objectives, risks, charges and expenses. For this and other important information, obtain a fund prospectus by visiting www.usfunds.com or by calling 1-800-US-FUNDS (1-800-873-8637). Read it carefully before investing. Distributed by U.S. Global Brokerage, Inc.
Foreign and emerging market investing involves special risks such as currency fluctuation and less public disclosure, as well as economic and political risk. By investing in a specific geographic region, a regional fund’s returns and share price may be more volatile than those of a less concentrated portfolio.
The Shanghai Composite Index (SSE) is an index of all stocks that trade on the Shanghai Stock Exchange. The CSI 300 is a capitalization-weighted stock market index designed to replicate the performance of 300 A-share stocks traded in the Shanghai and Shenzhen stock exchanges.
All opinions expressed and data provided are subject to change without notice. Some of these opinions may not be appropriate to every investor.

-
I know Mike is a very solid investor and respect his opinions very much. So if he says pay attention to this or that - I will.
~ Dale G.
-
I've started managing my own investments so view Michael's site as a one-stop shop from which to get information and perspectives.
~ Dave E.
-
Michael offers easy reading, honest, common sense information that anyone can use in a practical manner.
~ der_al.
-
A sane voice in a scrambled investment world.
~ Ed R.
Inside Edge Pro Contributors

Greg Weldon

Josef Schachter

Tyler Bollhorn

Ryan Irvine

Paul Beattie

Martin Straith

Patrick Ceresna

Mark Leibovit

James Thorne

Victor Adair