
Daily Updates
Since there’s no holy grail to analyze financial markets, the best approach is an eclectic one. So I incorporate as many tools as possible in my analysis, including: Fundamental valuations, macroeconomic models, monetary and fiscal policies, interest rate developments, sentiment and momentum indicators, and chart analysis.
Major market turning points are usually characterized by many of these tools. That was clearly the case in 2007 when everything fell neatly into place to call the end of a bull market that had started in 2003.
To a somewhat lesser degree that has also been the case starting this June, signaling a medium-term up trend. And that’s why I still expect it to continue during the coming months.
But even the strongest bull markets aren’t one-way affairs. They’re often interrupted by short-term corrections typically lasting six to eight weeks with prices falling 10 percent to 15 percent. And right now I think such a correction has just begun.
Here’s why …
All Major U.S. Stock Market Indexes Are
Bumping Against Important Resistance
These technical resistance points are important enough to warrant the beginning of the first large correction since this medium-term rally began in March 2009.
Let’s start with the S&P 500 …
As you can see on my first chart, this index hit the resistance line going back all the way to its October 2007 high.
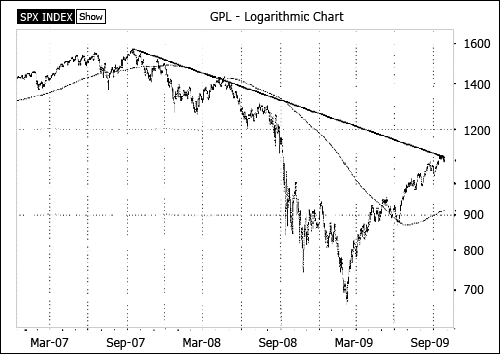
Source: Bloomberg
This trend line is very significant, because it defines the bear market of 2007 to 2009 when the S&P 500 lost 57 percent. And I think it’s highly unlikely that this resistance line will be broken through on the very first try.
It’s much more likely that the market — which is already tired after the huge runup of the past months — will have to retreat from here to gather enough strength to overcome this technical hurdle.
Next, have a look at chart below of the Dow Jones Industrial Average …
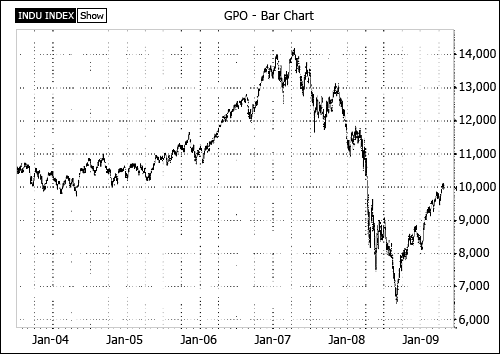
On a first glance you may think there isn’t any resistance below 11,000, especially if you only look back two or three years. But if you go back a bit further, to 2005 and 2004, you can see the massive resistance around the 10,000 area. This marks the lower boundary of a very massive trading range.
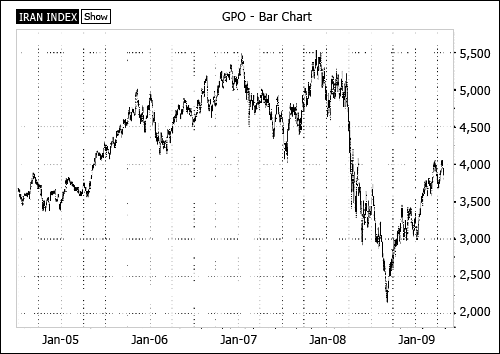
Next, the Nasdaq Composite …
The Nasdaq has already reached the equivalent of 1,200 in the S&P or 11,000 in the Dow … the short-term bottom of 2008, before all hell broke loose. This is a very obvious resistance point.

Now, take a look at the Dow Jones Transportation Average …
The Transports are showing a huge topping formation that began to form at the end of 2005 and lasted until fall 2008. When it broke to the down side, a crash wave ensued.
As you can see on the chart below, this index is now back to the lower boundary of that huge formation, a classic resistance area that’s not easily broken.
Finally, let’s examine the Dow Jones Utility Average …
The Utilities have been relatively weak since their March low. But they, too, are bumping against resistance now. This index formed a very nice topping formation from 2006 to 2008, thus a bit shorter than its cousin, the Transportation Average. But the result when it was broken was the same: A market crash in 2008.
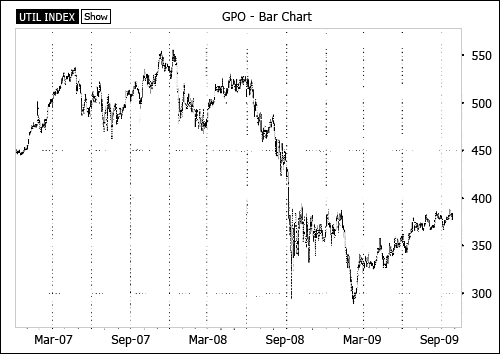
Even though this index has risen much less than the others, it has still entered a massive resistance area stemming from its trading range last fall.
Five Different Resistance Patterns
So here you have it. Five indexes showing very different chart patterns. But they’re all hitting major technical resistance areas at the same time! This makes for a very strong picture of a market that’ll have difficulties rising any further without a correction first.
In Fact, Other Technical Indicators Are Equally Weak …
The whole technical picture has become very fragile during the past weeks:
1. Volumes have been dismal: Declining when the market rose and rising when it retreated.
2. Momentum indicators show multiple negative divergences: They did not rise to new relative highs during the past three up-waves in the market.
3. Market breadth shows a similar picture: The ratio of advancing to declining stocks was lower at each of the past up-moves in the market.
4. Put-call-ratios were back to frothy levels: The equity only put-call-ratio fell to 0.52 a few days ago, a level often associated with short-term exhaustion.
All in all I get the impression that the first big correction of this medium-term up trend is already underway. I expect it to last until late November and bring prices back 10 percent to 15 percent.
However, I don’t expect this correction to herald a major trend change. Hence, I suggest you consider using it as a buying opportunity.
Best wishes,
Claus
Claus Vogt is the editor of Sicheres Geld, the first and largest-circulation contrarian investment letter in Europe. Although the publication is based on Martin Weiss’ Safe Money, Mr. Vogt has provided new, independent insights and amazingly accurate forecasts that, in turn, have contributed great value to Safe Money itself.
Mr. Vogt is the co-author of the German bestseller, Das Greenspan Dossier, where he predicted, well ahead of time, the sequence of events that have unfolded since, including the U.S. housing bust, the U.S. recession, the demise of Fannie Mae and Freddie Mac, as well as the financial system crisis.
He is also the editor of the German edition of Weiss Research’s International ETF Trader, which has delivered overall gains (including losers) in the high double digits even while the U.S. stock market suffered its worst year since 1932.
His analysis and insights will be appearing regularly in Money and Markets.
This investment news is brought to you by Money and Markets. Money and Markets is a free daily investment newsletter from Martin D. Weiss and Weiss Research analysts offering the latest investing news and financial insights for the stock market, including tips and advice on investing in gold, energy and oil. Dr. Weiss is a leader in the fields of investing, interest rates, financial safety and economic forecasting. To view archives or subscribe, visit http://www.moneyandmarkets.com.
Key News & Views
– Bill Gross tells CNBC the dollar index will make a new low. Editor Note: That’s a shock!
– Mark Faber tells Bloomberg the US dollar will eventually go to zero. Editor Note: Mark, by then your great, great, great, great, great, great, great, great, great, great, great, great, great, great, great, great, great grandchildren won’t remember your ponytail once the world is on aTurkish lira based monetary system.
Quotable
For Missing the Unmissable
Bernanke, the most passionate cheerleader of Greenspan’s follies, is picked as his replacement, partly, it seems, for his belief that U.S. house prices would never decline and that at their peak in late 2005 they largely just reflected the unusual strength of the U.S. economy. As well as missing on his very own this 3-sigma (100-year) event in housing, he was completely clueless as to the potential disastrous interactions among lower house prices, new opaque financial instruments, heroically increased mortgages, lower lending standards, and internationally networked distribution……
….read more HERE.
Midnight Candles
A cold wind from the future blows into my nighttime bedroom, more often than not during those midnight hours when fear dominates and hope retreats to a netherworld. This wind is a spectre, an oracle of darkness and eventual death, not easily dismissed. Once merely a whisper, its decibels intensify with the advancing years. It will be heard, this reaper – this grim reaper, yet in the nights when it howls the loudest I fight back, silently screaming for it to get out, to leave me alone, to let it all be a bad dream. It never is. Shakespeare’s Macbeth expressed it more subtly: “Out, out, brief candle!” Yet the finer words provide no solace; the final act is always the same.
Those of you in your sixties and older know of what I speak; even during daylight hours you read the obits and notice that contemporaries have passed into the beyond. Those of you much younger must wonder what has come over me, yet I was young once too. I remember as a teenager camping out under the stars with friends wondering aloud at the mystery of it all, knowing the reaper was far off in the distance, so far away that death was more a philosophical discussion point than an impending reality. In my thirties, I recall standing in front of a mirror in my physical prime and instructing my image that I would never grow old, that I somehow would live forever, that I, the me, the ego, would be eternal. Now when I face the glass my eyes avoid the unmistakable conclusion: I am everyman – everyone that ever was and ever will be. This world will outlast me.
What to do? Enjoy these senior years and take advantage of the gifts I have been given – a healthy 65-year-old body, an amazing job where I can still make a vital contribution, a wonderful wife who shines brightly and muffles the sound of my nighttime intruder. Still there is no acceptance of Macbeth’s or any of our “dusty deaths.” At midnight there is only fear and rage – rage against this night whose wind will one day take us all.
An investment segue is a tough one this month: markets whistling past the graveyard? A vampire economy? A ghostly correction ahead? Pretty lame, so I’ll jump straight into a discussion of why in a New Normal economy (1) almost all assets appear to be overvalued on a long-term basis, and, therefore, (2) policymakers need to maintain artificially low interest rates and supportive easing measures in order to keep economies on the “right side of the grass.”
Let me start out by summarizing a long-standing PIMCO thesis: The U.S. and most other G-7 economies have been significantly and artificially influenced by asset price appreciation for decades. Stock and home prices went up – then consumers liquefied and spent the capital gains either by borrowing against them or selling outright. Growth, in other words, was influenced on the upside by leverage, securitization, and the belief that wealth creation was a function of asset appreciation as opposed to the production of goods and services. American and other similarly addicted global citizens long ago learned to focus on markets as opposed to the economic foundation behind them. How many TV shots have you seen of people on the Times Square Jumbotron applauding the announcement of the latest GDP growth numbers or job creation? None, of course, but we see daily opening and closing market crescendos of jubilant capitalists on the NYSE and NASDAQ cheering the movement of markets – either up or down. My point: Asset prices are embedded not only in our psyche, but the actual growth rate of our economy. If they don’t go up – economies don’t do well, and when they go down, the economy can be horrid.
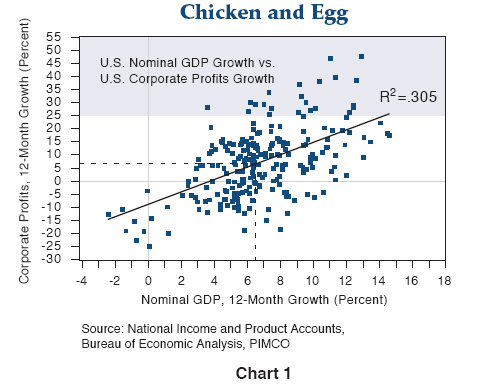
To some this might seem like a chicken and egg conundrum because they naturally move together. For the most part they do – and should. As pointed out in a recent New York Times article titled “Dow Bubble?,” stocks and nominal GDP growth should be correlated because profits and nominal GDP are correlated as well. Witness the PIMCO Chart 1, researched by Saumil Parikh, which covers a time period of 50 years. Granted the R2 correlation is only .305, but that is to be expected – profits are also a function of the respective entities that feed at the GDP growth trough – corporations, labor, government and other countries – and when corporations and their profits are ascendant they do well; when not, they fall below the best fit line appearing in the chart. Notice as well that in a normally functioning economy growing at 6-7% nominal GDP, that profits grow at the same rate. (At growth distribution tails there are substantial distortions.) And if long term profits match nominal GDP growth then theoretically stock prices should too.
Not so. What has happened is that our “paper asset” economy has driven not only stock prices, but all asset prices higher than the economic growth required to justify them. Granted, one must be careful of beginning and ending data points in any theoretical “proof.” Such is the fallacy of Jeremy Siegel’s Stocks for the Long Run approach which begins at very low PEs and ends most long-term time periods with much higher ones, justifying a 6.5% “Siegel constant” real rate of return for U.S. equities over the past 75 years or so. It may also be a weakness of the New York Times “Dow Bubble” article where the authors claim that since the Dow Jones average was at 4,000 in 1995, that a 100% step-for-step correlation with nominal GDP growth since then would produce a reasonable valuation of 7,800 – not the current 10,000.
Having said that, let me introduce Chart 2 a PIMCO long-term (half-century) chart comparing the annual percentage growth rate of a much broader category of assets than stocks alone relative to nominal GDP. Let’s not just make this a stock market roast, let’s extend it to bonds, commercial real estate, and anything that has a price tag on it to see if those price stickers are justified by historical growth in the economy.
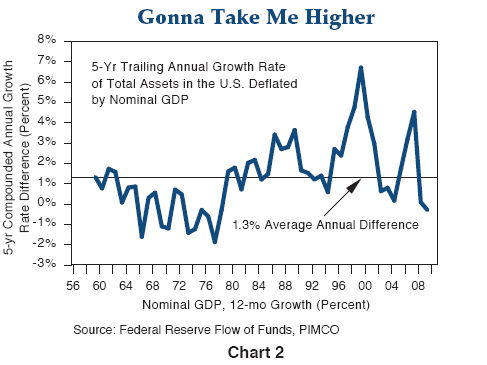
This comparison uses a different format with a smoothing five-year trailing valuation growth rate for all U.S. assets since 1956 vs. corresponding economic growth. Several interesting points. First of all, assets didn’t always appreciate faster than GDP. For the first several decades of this history, economic growth, not paper wealth, was king. We were getting richer by making things, not paper. Beginning in the 1980s, however, the cult of the markets, which included the development of financial derivatives and the increasing use of leverage, began to dominate. A long history marred only by negative givebacks during recessions in the early 1990s, 2001–2002, and 2008–2009, produced a persistent increase in asset prices vs. nominal GDP that led to an average overall 50-year appreciation advantage of 1.3% annually. That’s another way of saying you would have been far better off investing in paper than factories or machinery or the requisite components of an educated workforce. We, in effect, were hollowing out our productive future at the expense of worthless paper such as subprimes, dotcoms, or in part, blue chip stocks and investment grade/government bonds. Putting a compounding computer to this 1.3% annual outperformance for 50 years, produces a double, and leads to the conclusion that the return from all assets was 100% (or 15 trillion – one year’s GDP) higher than what it theoretically should have been. Financial leverage, in other words, drove the prices of stocks, bonds, homes, and shopping malls to extraordinary valuation levels – at least compared to 1956 – and there could be payback ahead as the leveraging turns into delevering and nominal GDP growth regains the winner’s platform.
This 100% overvaluation from recent price peaks of course is crude, simplistic, and unrealistically pessimistic. It implies that stocks should be at – gasp – Dow 7,000 – and that home prices – gasp – should be cut in half from 2007 levels, and that commercial real estate (Las Vegas hotels, big city office buildings that are 20% empty) should likewise face the delevering guillotine. Some of these price adjustments have already taken place, and to be fair, corporate and high yield bonds as well, should be thrown into this overpriced vortex more resemblant of a black hole than American-style paper wealth capitalism. This is where it gets tricky, however, because policymakers, (The Fed, the Treasury, the FDIC) recognize the predicament, maybe not with the same model or in the same magnitude, but they recognize that asset prices must be supported in order to generate positive future nominal GDP growth somewhere close to historical norms. The virus has infected far too many parts of the economy’s body, for far too long, to go cold turkey. The Japanese example over the past 15 years is an excellent historical reference point. Their quantitative easing and near-0% short-term interest rates eventually arrested equity and property market deflation but at much greater percentage losses, which produced an economy barely above the grass as opposed to buried six feet under. The current objective of global policymakers is to do likewise – keep the capitalistic patient alive through asset price support, but at an “old normal” pace if possible, six feet or 6% in U.S. nominal GDP terms above the grass.
That support, of course, comes in numerous ways. Financial system guarantees, TARP recapitalization of banks, TAFs, TALFs, PPIFs – and in Europe and the UK, low interest rate term financing, semi-bank nationalizations, and asset purchase programs similar to the United States. In the case of the U.S., the amount of the implicit and explicit financial support given by policymakers totals perhaps as much as $5 trillion, which goes part way to support the $15 trillion overvaluation of assets theoretically calculated in the PIMCO model (100% of nominal GDP). China, interestingly, is taking another approach, throwing equivalent trillions into their real economy to make things as opposed to support paper, if only because exports are at the heart of their economic growth and they haven’t caught the American virus or suffered, I suppose, a “paper cut.”
At the center of U.S. policy support, however, rests the “extraordinarily low” or 0% policy rate. How long the Fed remains there is dependent on the pace of the recovery of nominal GDP as well as the mix of that nominal rate between real growth and inflation. My sense is that nominal GDP must show realistic signs of stabilizing near 4% before the Fed would be willing to risk raising rates. The current embedded cost of U.S. debt markets is close to 6% and nominal GDP must grow within reach of that level if policymakers are to avoid continuing debt deflation in corporate and household balance sheets. While the U.S. economy will likely approach 4% nominal growth in 2009’s second half, the ability to sustain those levels once inventory rebalancing and fiscal pump-priming effects wear off is debatable. The Fed will likely require 12–18 months of 4%+ nominal growth before abandoning the 0% benchmark.
Here is another way to analyze it. It seems commonsensical that because of asset market value losses over the past 18 months, the Fed must keep future real and nominal interest rates extremely low. Because
401(k)s have migrated to 201(k)s, and now 301(k)s, the negative wealth effect must be stabilized in order to reintegrate the private sector into the current economy. Renormalizing risk spreads – stock, investment grade, and high yield bonds among them – is another way to describe this hoped for foundation for future growth. PIMCO estimates that this process is perhaps 80–85% complete, which provides the potential for a sunny-side, right-side of the grass outcome, although still with New Normal implications. Still, investors must admit that without the policy guarantees of the Fed, Treasury, and FDIC, as well as the continuation of punitive 0% short-term rates that force investors to buy something, anything, with their cash, that risk spreads may widen again, not stabilize.
This somewhat detailed analysis on Fed funds policy rates should return us to my beginning thesis as to why they need to stay low: Asset appreciation in U.S. and other G-7 economies has been artificially elevated for years. In order to prevent prices sinking even lower than recent downtrends averaging 30% for stocks, homes, commercial real estate, and certain high yield bonds, central banks must keep policy rates historically low for an extended period of time. If policy rates are artificially low then bond investors should recognize that artificial buyers of notes and bonds (quantitative easing programs and Chinese currency fixing) have compressed almost all interest rates. But while this may support asset prices – including Treasury paper across the front end and belly of the curve, at the same time it provides little reward in terms of future income. Investors, of course, notice this inevitable conclusion by referencing Treasury Bills at .15%, two-year Notes at less than 1%, and 10-year maturities at a paltry 3.40%. Absent deflationary momentum, this is all a Treasury investor can expect. What you see in the bond market is often what you get. Broadening the concept to the U.S. bond market as a whole (mortgages + investment grade corporates), the total bond market yields only 3.5%. To get more than that, high yield, distressed mortgages, and stocks beckon the investor increasingly beguiled by hopes of a V-shaped recovery and “old normal” market standards. Not likely, and the risks outweigh the rewards at this point. Investors must recognize that if assets appreciate with nominal GDP, a 4–5% return is about all they can expect even with abnormally low policy rates. Rage, rage, against this conclusion if you wish, but the six-month rally in risk assets – while still continuously supported by Fed and Treasury policymakers – is likely at its pinnacle. Out, out, brief candle.
William H. Gross
Managing Director
About PIMCO
“PIMCO’s Mission is to Preserve and Enrich Client Assets and Provide the Highest Quality Investment Management Service.”
Who We Are
We are PIMCO, a leading global investment management firm with more than 1,200 employees in offices in Newport Beach, New York, Amsterdam, Singapore, Tokyo, London, Sydney, Munich, Toronto and Hong Kong.
We manage investments for an array of clients, including retirement and other assets that reach more than 8 million people in the U.S. and millions more around the world. Our clients include state, municipal and union pension and retirement plans whose beneficiaries come from all walks of life, from educators to healthcare workers to public safety employees. We are also advisors and asset managers to central banks, corporations, universities, foundations and endowments.
We are dedicated to our clients. From our founding in 1971, PIMCO’s global team of investment professionals has been dedicated to client service, allowing our portfolio managers to focus on returns. We serve individual investors through pooled and mutual funds in the U.S. and Europe and offer institutional clients mutual funds as well as privately managed separate accounts
We are committed to being the best provider of global investment solutions in the world. Our thought leadership, talent, technology and long-term investment approach drive our abilities around the globe. We offer a continually evolving set of solutions across all asset classes in an effort to provide investors with consistent returns, superior risk management and topflight client service.
We are a trendsetter in the asset management industry, and have been throughout our 38-year history. We remain at the forefront today, pioneering the use of innovative solutions for our clients, including portable alpha and absolute return strategies. Our investment process and operational structure drive our ability to anticipate client needs and respond quickly to ever-changing economic, market and policy environments.
I am in Argentina today, but still have found time to read a rather provocative speech by David Einhorn, who is President of Greenlight Capital, a “long-short value-oriented hedge fund”, which he began in 1996. Einhorn has long been a critic of the current investment banking business, and today he discusses the problems with not only the proposed new government regulations (or lack thereof), but also the problems with the US debt and our currency valuations. It is a most thought-provoking and fun speech.
It is especially poignant as I sit in a country that has seen the ravages of hyper-inflation, talking with business leaders and investors who experienced the problems first hand and how they deal with it today. I will be writing about what I am learning this Friday I think. But now I have to run and give my third speech today. Have a good week!
Your very surprised to find Argentinean beef as good as that of Texas analyst,
John Mauldin, Editor
Outside the Box
Liquor before Beer – In the Clear
Value Investing Congress – David Einhorn, Greenlight Capital
One of the nice aspects of trying to solve investment puzzles is recognizing that even though I am not always going to be right, I don’t have to be. Decent portfolio management allows for some bad luck and some bad decisions. When something does go wrong, I like to think about the bad decisions and learn from them so that hopefully I don’t repeat the same mistakes. This leaves me plenty of room to make fresh mistakes going forward. I’d like to start today by reviewing a bad decision I made and share with you what I’ve learned from that error and how I am attempting to apply the lessons to improve our funds’ prospects.
At the May 2005 Ira Sohn Investment Research Conference in New York, I recommended MDC Holdings, a homebuilder, at $67 per share. Two months later MDC reached $89 a share, a nice quick return if you timed your sale perfectly. Then the stock collapsed with the rest of the sector. Some of my MDC analysis was correct: it was less risky than its peers and would hold-up better in a down cycle because it had less leverage and held less land. But this just meant that almost half a decade later, anyone who listened to me would have lost about forty percent of his investment, instead of the seventy percent that the homebuilding sector lost.
I want to revisit this because the loss was not bad luck; it was bad analysis. I down played the importance of what was then an ongoing housing bubble. On the very same day, at the very same conference, a more experienced and wiser investor, Stanley Druckenmiller, explained in gory detail the big picture problem the country faced from a growing housing bubble fueled by a growing debt bubble. At the time, I wondered whether even if he were correct, would it be possible to convert such big picture macro-thinking into successful portfolio management? I thought this was particularly tricky since getting both the timing of big macro changes as well as the market’s recognition of them correct has proven at best a difficult proposition. Smart investors had been complaining about the housing bubble since at least 2001. I ignored Stan, rationalizing that even if he were right, there was no way to know when he would be right. This was an expensive error.
The lesson that I have learned is that it isn’t reasonable to be agnostic about the big picture. For years I had believed that I didn’t need to take a view on the market or the economy because I considered myself to be a “bottom up” investor. Having my eyes open to the big picture doesn’t mean abandoning stock picking, but it does mean managing the long-short exposure ratio more actively, worrying about what may be brewing in certain industries, and when appropriate, buying some just-in-case insurance for foreseeable macro risks even if they are hard to time. In a few minutes, I will tell you what Greenlight has done along these lines.
But first, I’d like to explain what I see as the macro risks we face. To do that I need to digress into some political science. Please humor me since my mom and dad spent a lot of money so I could be a government major, the usefulness of which has not been apparent for some time.
Winston Churchill said that, “Democracy is the worst form of government except for all the others that have been tried from time to time.”
As I see it, there are two basic problems in how we have designed our government. The first is that officials favor policies with short-term impact over those in our long-term interest because they need to be popular while they are in office and they want to be re-elected. In recent times, opinion tracking polls, the immediate reactions of focus groups, the 24/7 news cycle, the constant campaign, and the moment-to-moment obsession with the Dow Jones Industrial Average have magnified the political pressures to favor short-term solutions. Earlier this year, the political topic du jour was to debate whether the stimulus was working, before it had even been spent.
Paul Volcker was an unusual public official because he was willing to make unpopular decisions in the early ’80s and was disliked at the time. History, though, judges him kindly for the era of prosperity that followed.
Presently, Ben Bernanke and Tim Geithner have become the quintessential short-term decision makers. They explicitly “do whatever it takes” to “solve one problem at a time” and deal with the unintended consequences later. It is too soon for history to evaluate their work, because there hasn’t been time for the unintended consequences of the “do whatever it takes” decision-making to materialize.
The second weakness in our government is “concentrated benefit versus diffuse harm” also known as the problem of special interests. Decision makers help small groups who care about narrow issues and whose “special interests” invest substantial resources to be better heard through lobbying, public relations and campaign support. The special interests benefit while the associated costs and consequences are spread broadly through the rest of the population. With individuals bearing a comparatively small extra burden, they are less motivated or able to fight in Washington.
In the context of the recent economic crisis, a highly motivated and organized banking lobby has demonstrated enormous influence. Bankers advance ideas like, “without banks, we would have no economy.” Of course, there was a public interest in protecting the guts of the system, but the ATMs could have continued working, even with forced debt-to-equity conversions that would not have required any public funds. Instead, our leaders responded by handing over hundreds of billions of taxpayer dollars to protect the speculative investments of bank shareholders and creditors. This has been particularly remarkable, considering that most agree that these same banks had an enormous role in creating this mess which has thrown millions out of their homes and jobs.
Like teenagers with their parents away, financial institutions threw a wild party that eventually tore-up the neighborhood. With their charge arrested and put in jail to detoxify, the supervisors were faced with a decision: Do we let the party goers learn a tough lesson or do we bail them out? Different parents with different philosophies might come to different decisions on this point. As you know our regulators went the bail-out route.
But then the question becomes, once you bail them out, what do you do to discipline the misbehavior? Our authorities have taken the response that kids will be kids. “What? You drank beer and then vodka. Are you kidding? Didn’t I teach you, beer before liquor, never sicker, liquor before beer, in the clear! Now, get back out there and have a good time.” And for the last few months we have seen the beginning of another party, which plays nicely toward government preferences for short-term favorable news-flow while satisfying the banking special interest. It has not done much to repair the damage to the neighborhood.
And the neighbors are angry, because at some level, Americans understand that the Washington-Wall Street relationship has rewarded the least deserving people and institutions at the expense of the prudent. They don’t know the particulars or how to argue against the “without banks, we have no economy” demagogues. So, they fight healthcare reform, where they have enough personal experience to equip them to argue with Congressmen at town hall meetings. As I see it, the revolt over healthcare isn’t really about healthcare, but represents a broader upset at Washington. The lack of trust over the inability to deal seriously with the party goers feeds the lack of trust over healthcare.
On the anniversary of Lehman’s failure, President Obama gave a terrific speech. He said, “Those on Wall Street cannot resume taking risks without regard for the consequences, and expect that next time, American taxpayers will be there to break the fall.” Later he advocated an end of “too big to fail.” Then he added, “For a market to function, those who invest and lend in that market must believe that their money is actually at risk.” These are good points that he should run by his policy team, because Secretary Geithner’s reform proposal does exactly the opposite.
The financial reform on the table is analogous to our response to airline terrorism by frisking grandma and taking away everyone’s shampoo, in that it gives the appearance of officially “doing something” and adds to our bureaucracy without really making anything safer.
With the ensuing government bailout, we have now institutionalized the idea of too-big-to-fail and insulated investors from risk.
The proper way to deal with too-big-to-fail, or too inter-connected to fail, is to make sure that no institution is too big or inter-connected to fail. The test ought to be that no institution should ever be of individual importance such that if we were faced with its demise the government would be forced to intervene. The real solution is to break up anything that fails that test.
The lesson of Lehman should not be that the government should have prevented its failure. The lesson of Lehman should be that Lehman should not have existed at a scale that allowed it to jeopardize the financial system. And the same logic applies to AIG, Fannie, Freddie, Bear Stearns, Citigroup and a couple dozen others.
Twenty-five years ago the government dismantled AT&T. Its break-up set forth decades of unbelievable progress in that industry. We can do that again here in the financial sector and we would achieve very positive social benefit with no cost that anyone can seem to explain.
The proposed reform takes us in the polar opposite direction. The cop-out response from Washington is that it isn’t “practical.” Our leaders are so influenced by the banking special interests that they would rather declare it “impractical” than roll up their sleeves and figure out how to get the job done.
The bailouts have installed a great deal of moral hazard, which in the absence of radical change will be reinforced and thereby grant every big institution a permanent “implicit” government backstop. This creates an enormous ongoing subsidy for the too-bigto-fails, as well as making it much harder for the non-too-big-to-fails to compete. In effect, we all continue to subsidize the big banks even though we keep hearing the worst of the crisis is behind us.
In addition, the now larger too-big-to-fails are beginning to take advantage of developing oligopolies. Even as the government spends trillions to subsidize mortgage rates, the resulting discount is not being passed to homeowners but is being kept by mortgage originators who are earning record profits per mortgage originated. Recently, Goldman upgraded Wells Fargo partly based on its ability to earn long-term oligopolistic mortgage origination spreads.
The proposed reform does not deal with the serious risks that the recent crisis exposed. Credit Default Swaps, which create large, correlated and asymmetric risks, scared the authorities into spending hundreds of billions of taxpayer money to prevent the speculators who made bad bets from having to pay.
CDS are also highly anti-social. Bondholders who also hold CDS make a bigger return when the issuing firms fail. As a result, holders of so-called “basis packages” – a bond and a CDS – have an incentive to use their position as bondholders to force bankruptcy triggering payment on their CDS, rather than negotiate traditional out of court restructurings or covenant amendments with troubled creditors. Press accounts have noted that this dynamic has contributed to the recent bankruptcies of Abitibi-Bowater, General Growth Properties, Six Flags and even General Motors. They are a pending problem in CIT’s efforts to avoid bankruptcy.
The reform proposal to create a CDS clearing house does nothing more than maintain private profits and socialized risks by moving the counter-party risk from the private sector to a newly created too-big-to-fail entity. I think that trying to make safer CDS is like trying to make safer asbestos. How many real businesses have to fail before policy makers decide to simply ban them?
Similarly, the money markets were exposed as creating systemic risk during the crisis. Apparently, investors in these pools of lending assets that carry no reserve for loss expect to be shielded from losing money while earning a higher return than bank deposits or T-bills. Mr. Bernanke decided they needed to be bailed out to save the system. It is hard to imagine why this structure shouldn’t be fixed, either by adding them to the FDIC insurance program and subjecting them to bank regulation, or at least forcing them to stop using $1 net-asset values, which gives their customers the impression that they can’t fall in value.
The most constructive aspect of the Geithner reform plan is to separate banking from commerce. This would have the effect of forcing industrial companies to divest big finance subsidiaries, which would have to be regulated as banks. During the bubble, companies like GMAC, AIG Financial Products and GE Capital, with cheap funding supported by inaccurate credit ratings, took enormous unregulated risks. When the crisis hit, GMAC and AIG needed huge federal bailouts. The Federal Reserve set up the Commercial Paper Funding Facility to backstop GE Capital among others, and GE became the largest borrower under the FDIC’s Temporary Liquidity Guarantee Program, even though prior to the crisis it wasn’t even in the FDIC.
In response to the Geithner proposal, GE immediately let it be known that it had “talked to a number of people in Congress” and it should not have to separate its finance subsidiary because it disingenuously asserted that it hadn’t contributed to the crisis. We will see whether the GE special interest is able to stave-off this constructive reform proposal.
Rather than deal with these simple problems with simple, obvious solutions, the official reform plans are complicated, convoluted and designed to only have the veneer of reform while mostly serving the special interests. The complications serve to reduce transparency, preventing the public at large from really seeing the overwhelming influence of the banks in shaping the new regulation.
In dealing with the continued weak economy, our leaders are so determined not to repeat the perceived mistakes of the 1930s that they are risking policies with possibly far worse consequences designed by the same people at the Fed who ran policy with the short-term view that asset bubbles don’t matter because the fallout can be managed after they pop. That view created a disaster that required unprecedented intervention for which our leaders congratulated themselves for doing whatever it took to solve. With a sense of mission accomplished, the G-20 proclaimed “it worked.”
We are now being told that the most important thing is to not remove the fiscal and monetary support too soon. Christine Romer, a top advisor to the President, argues that we made a great mistake by withdrawing stimulus in 1937.
Just to review, in 1934 GDP grew 17.0%, in 1935 it grew another 11.1%, and in 1936 it grew another 14.3%. Over the period unemployment fell by 30%. That is three years of progress. Apparently, even this would not have been enough to achieve what Larry Summers has called “exit velocity.”
Imagine, in our modern market, where we now get economic data on practically a daily basis, living through three years of favorable economic reports and deciding that it would be “premature” to withdraw the stimulus.
An alternative lesson from the double dip the economy took in 1938 is that the GDP created by massive fiscal stimulus is artificial. So whenever it is eventually removed, there will be significant economic fall out. Our choice may be either to maintain large annual deficits until our creditors refuse to finance them or tolerate another leg down in our economy by accepting some measure of fiscal discipline.
This brings me to our present fiscal situation and the current investment puzzle.
Over the next decade the welfare states will come to face severe demographic problems. Baby Boomers have driven the U.S. economy since they were born. It is no coincidence that we experienced an economic boom between 1980 and 2000, as the Boomers reached their peak productive years. The Boomers are now reaching retirement. The Social Security and Medicare commitments to them are astronomical.
When the government calculates its debt and deficit it does so on a cash basis. This means that deficit accounting does not take into account the cost of future promises until the money goes out the door. According to shadowstats.com, if the federal government counted the cost of its future promises, the 2008 deficit was over $5 trillion and total obligations are over $60 trillion. And that was before the crisis.
Over the last couple of years we have adopted a policy of private profits and socialized risks. We are transferring many private obligations onto the national ledger. Although our leaders ought to make some serious choices, they appear too trapped in short-termism and special interests to make them. Taking no action is an action.
In the nearer-term the deficit on a cash basis is about $1.6 trillion or 11% of GDP. President Obama forecasts $1.4 trillion next year, and with an optimistic economic outlook, $9 trillion over the next decade. The American Enterprise Institute for Public Policy Research recently published a study that indicated that “by all relevant debt indicators, the U.S. fiscal scenario will soon approximate the economic scenario for countries on the verge of a sovereign debt default.”
As we sit here today, the Federal Reserve is propping up the bond market, buying long-dated assets with printed money. It cannot turn around and sell what it has just bought.
There is a basic rule of liquidity. It isn’t the same for everyone. If you own 10,000 shares of Greenlight Re, you have a liquid investment. However, if I own 5 million shares it is not liquid to me, because of both the size of the position and the signal my selling would send to the market. For this reason, the Fed cannot sell its Treasuries or Agencies without destroying the market. This means that it will be challenged to shrink the monetary base if inflation actually turns up.
Further, the Federal Open Market Committee members may not recognize inflation when they see it, as looking at inflation solely through the prices of goods and services, while ignoring asset inflation, can lead to a repeat of the last policy error of holding rates too low for too long.
At the same time, the Treasury has dramatically shortened the duration of the government debt. As a result, higher rates become a fiscal issue, not just a monetary one. The Fed could reach the point where it perceives doing whatever it takes requires it to become the buyer of Treasuries of first and last resort.
Japan appears even more vulnerable, because it is even more indebted and its poor demographics are a decade ahead of ours. Japan may already be past the point of no return. When a country cannot reduce its ratio of debt to GDP over any time horizon, it means it can only refinance, but can never repay its debts. Japan has about 190% debt-to-GDP financed at an average cost of less than 2%. Even with the benefit of cheap financing the Japanese deficit is expected to be 10% of GDP this year. At some point, as American homeowners with teaser interest rates have learned, when the market refuses to refinance at cheap rates, problems quickly emerge. Imagine the fiscal impact of the market resetting Japanese borrowing costs to 5%.
Over the last few years, Japanese savers have been willing to finance their government deficit. However, with Japan’s population aging, it’s likely that the domestic savers will begin using those savings to fund their retirements. The newly elected DPJ party that favors domestic consumption might speed up this development. Should the market re-price Japanese credit risk, it is hard to see how Japan could avoid a government default or hyperinflationary currency death spiral.
The failure of Lehman meant that barring extraordinary measures, Merrill Lynch, Morgan Stanley and Goldman Sachs would have failed as the credit market realized that if the government were willing to permit failures, then the cost of financing such institutions needed to be re-priced so as to invalidate their business models.
I believe there is a real possibility that the collapse of any of the major currencies could have a similar domino effect on re-assessing the credit risk of the other fiat currencies run by countries with structural deficits and large, unfunded commitments to aging populations.
I believe that the conventional view that government bonds should be “risk free” and tied to nominal GDP is at risk of changing. Periodically, high quality corporate bonds have traded at lower yields than sovereign debt. That could happen again.
And, of course, these structural risks are exacerbated by the continued presence of credit rating agencies that inspire false confidence with potentially catastrophic results by over-rating the sovereign debt of the largest countries. There is no reason to believe that the rating agencies will do a better job on sovereign risk than they have done on corporate or structured finance risks.
My firm recently met with a Moody’s sovereign risk team covering twenty countries in Asia and the Middle East. They have only four professionals covering the entire region. Moody’s does not have a long-term quantitative model that incorporates changes in the population, incomes, expected tax rates, and so forth. They use a short-term outlook – only 12-18 months – to analyze data to assess countries’ abilities to finance themselves. Moody’s makes five-year medium-term qualitative assessments for each country, but does not appear to do any long-term quantitative or critical work.
Their main role, again, appears to be to tell everyone that things are fine, until a real crisis emerges at which point they will pile-on credit downgrades at the least opportune moment, making a difficult situation even more difficult for the authorities to manage.
I can just envision a future Congressional Hearing so elected officials can blame the rating agencies for blowing it, as the rating agencies respond by blaming Congress.
Now, the question for us as investors is how to manage some of these possible risks. Four years ago I spoke at this conference and said that I favored my Grandma Cookie’s investment style of investing in stocks like Nike, IBM, McDonalds and Walgreens over my Grandpa Ben’s style of buying gold bullion and gold stocks. He feared the economic ruin of our country through a paper money and deficit driven hyper inflation. I explained how Grandma Cookie had been right for the last thirty years and would probably be right for the next thirty as well. I subscribed to Warren Buffett’s old criticism that gold just sits there with no yield and viewed gold’s long-term value as difficult to assess.
However, the recent crisis has changed my view. The question can be flipped: how does one know what the dollar is worth given that dollars can be created out of thin air or dropped from helicopters? Just because something hasn’t happened, doesn’t mean it won’t. Yes, we should continue to buy stocks in great companies, but there is room for Grandpa Ben’s view as well.
I have seen many people debate whether gold is a bet on inflation or deflation. As I see it, it is neither. Gold does well when monetary and fiscal policies are poor and does poorly when they appear sensible. Gold did very well during the Great Depression when FDR debased the currency. It did well again in the money printing 1970s, but collapsed in response to Paul Volcker’s austerity. It ultimately made a bottom around 2001 when the excitement about our future budget surpluses peaked.
Prospectively, gold should do fine unless our leaders implement much greater fiscal and monetary restraint than appears likely. Of course, gold should do very well if there is a sovereign debt default or currency crisis.
A few weeks ago, the Office of Inspector General called out the Treasury Department for misrepresenting the position of the banks last fall. The Treasury’s response was an unapologetic expression that amounted to saying that at that point “doing whatever it takes” meant pulling a Colonel Jessup: “YOU CAN’T HANDLE THE TRUTH!” At least we know what we are dealing with.
When I watch Chairman Bernanke, Secretary Geithner and Mr. Summers on TV, read speeches written by the Fed Governors, observe the “stimulus” black hole, and think about our short-termism and lack of fiscal discipline and political will, my instinct is to want to short the dollar. But then I look at the other major currencies. The Euro, the Yen, and the British Pound might be worse. So, I conclude that picking one these currencies is like choosing my favorite dental procedure. And I decide holding gold is better than holding cash, especially now, where both earn no yield.
Along these same lines, we have bought long-dated options on much higher U.S. and Japanese interest rates. The options in Japan are particularly cheap because the historical volatility is so low. I prefer options to simply shorting government bonds, because there remains a possibility of a further government bond rally in response to the economy rolling over again. With options, I can clearly limit how much I am willing to lose, while creating a lot of leverage to a possible rate spiral.
For years, the discussion has been that our deficit spending will pass the costs onto “our grandchildren.” I believe that this is no longer the case and that the consequences will be seen during the lifetime of the leaders who have pursued short-term popularity over our solvency. The recent economic crisis and our response has brought forward the eventual reconciliation into a window that is near enough that it makes sense for investors to buy some insurance to protect themselves from a possible systemic event. To slightly modify Alexis de Tocqueville: Events can move from the impossible to the inevitable without ever stopping at the probable.
As investors, we can’t change the course of events, but we can attempt to protect capital in the face of foreseeable risks.
Of course, just like MDC, there remains the possibility that I am completely wrong. And, personally, I hope I am. I wonder what Stan Druckenmiller thinks.

John F. Mauldin
johnmauldin@investorsinsight.com
Two weeks ago, I told you whya quick look at Colgate’s chart led me to believe that its run was going to continue through the early fall. And I also said that I had a few reasons to be wary of the stock’s ability to continue rising going forward.
If you’re a Dividend Superstars subscriber, you should have closed out that position based on my recommendation in the issue that just went to press. I’m tracking a gain of 32.7 percent. Great!
Now today I want to talk about a couple of the other things I look at on charts … and how they apply to some of the other investments that I’ve mentioned before here in Money and Markets.
Let’s start with …
The Importance of Support and Resistance:
Understanding Investors’ “Lines in the Sand”
Investors have a tendency to get hung up on certain numbers … quite often round ones. You know, like Dow 10,000.
I’m not a psychologist, so I’m not going to hypothesize on why it happens. But from many years of following the markets, I can tell you that it does happen with alarming regularity.
This is precisely why I pay close attention to clear levels of support and resistance whenever I look at any investment’s chart.
Let me explain with a real-world example …
Here’s a chart from Vanguard’s Inflation-Protected Securities fund (VIPSX), a good stand-in for the TIPS and I-Bond inflation hedges I’ve been regularly suggesting here and in Dividend Superstars …

In my past discussions of this particular fund, I pointed out that the low $12 level seemed very important psychologically to this particular investment. That’s because — as my trendline demonstrates — the fund had repeatedly bumped against this level before the credit crisis began … and again after the market rally started in 2009.
As you can see, once it recently broke through that level, it swiftly moved up another 4 percent. While that move might not sound huge, you have to remember that this is a mutual fund based on government bonds!
Are there fundamental reasons behind the move? Absolutely. Worries over a falling dollar and renewed inflation are obvious catalysts spurring investors to move into these hedging investments.
But that’s the point: These charts reflect the market’s collective thoughts and opinions. When events are enough to push an investment through a level that previously presented resistance … it means a certain critical mass has been achieved … and momentum quite often takes over from there.
Obviously the opposite is also true. When a level has previously held on countless downdrafts — forming a strong area of support — you better look out below the first time that level is seriously broken!
Now I’ll be the first to say that you never know when an important level is going to hold or not. However, simply being aware of critical breaking points — along with the fundamental reasons moving a market or an individual investment — will help you make more educated (and hopefully more profitable) decisions.
Of course, it never hurts to layer on one more relatively simple technical indicator that also measures levels of support and resistance …
Moving Averages: Another
Favorite Technical Analysis Tool
During my last analysis of Colgate in this column, I pointed to trendlines as a way to get a sense of an investment’s general direction.
Well, moving averages take trendlines to the next level because rather than being constructed somewhat arbitrarily (i.e. “pick a couple points that look important to you”), they are computed automatically based on a preset series of data. Specifically, a moving average is a line based on the arithmetic average of the prices it’s drawn against.
What’s the benefit? This way smoothes out all the little movements and creates a line that you can compare them to. Common moving average periods include 200-day, 90-day, and 60-day periods.
I like moving averages as another way to gauge general uptrends and downtrends, and to spot major market reversal points.
Speaking of which, here’s a chart of the S&P 500 with a 60-day moving average thrown in for good measure …

As you can see, the market is well above its moving average, and thus remains in an uptrend. Only a drop below the 1040 level would signal a change in that trend.
And perhaps the best part about technical analysis tools like moving averages is that they are no longer only available to professional investors with thousands of dollars in trading software. In fact, most online chart providers — including free websites like Yahoo Finance — now allow you to overlay these tools to whatever investment you’re viewing.
If you don’t already use these indicators, I encourage you to play around with them … they can give you another interesting way of viewing your investments.
Best wishes,
Nilus
P.S. In addition to that Colgate sell order, my latest Dividend Superstars issue also contained a brand-new dividend stock to buy (in the tech sector no less!). If you’re not yet a subscriber, and you’d like to get that hot-off-the-press recommendation, consider taking a risk-free subscription to my service for just $69 a year.
This investment news is brought to you by Money and Markets. Money and Markets is a free daily investment newsletter from Martin D. Weiss and Weiss Research analysts offering the latest investing news and financial insights for the stock market, including tips and advice on investing in gold, energy and oil. Dr. Weiss is a leader in the fields of investing, interest rates, financial safety and economic forecasting. To view archives or subscribe, visit http://www.moneyandmarkets.com.
-
I know Mike is a very solid investor and respect his opinions very much. So if he says pay attention to this or that - I will.
~ Dale G.
-
I've started managing my own investments so view Michael's site as a one-stop shop from which to get information and perspectives.
~ Dave E.
-
Michael offers easy reading, honest, common sense information that anyone can use in a practical manner.
~ der_al.
-
A sane voice in a scrambled investment world.
~ Ed R.
Inside Edge Pro Contributors

Greg Weldon

Josef Schachter

Tyler Bollhorn

Ryan Irvine

Paul Beattie

Martin Straith

Patrick Ceresna

Mark Leibovit

James Thorne

Victor Adair