
Daily Updates
Ed Note: Below is a small excerpt from Mark Leibovit’s Daily VR Trader. Be sure to check out The VR Gold Letter which is published WEEKLY
Canadian TSE, TSE Venture and Canadian Dollar Commentary for our Canadian clients updated for Thursday, October 29.
TSE:
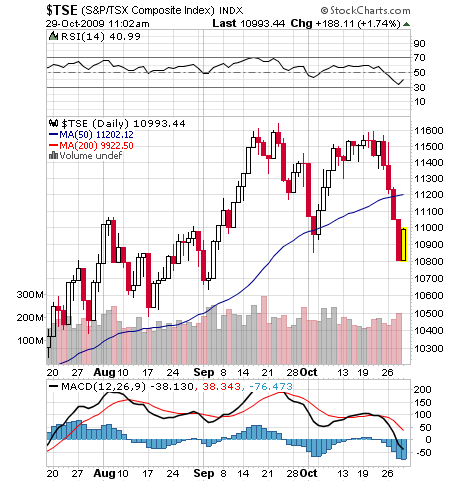
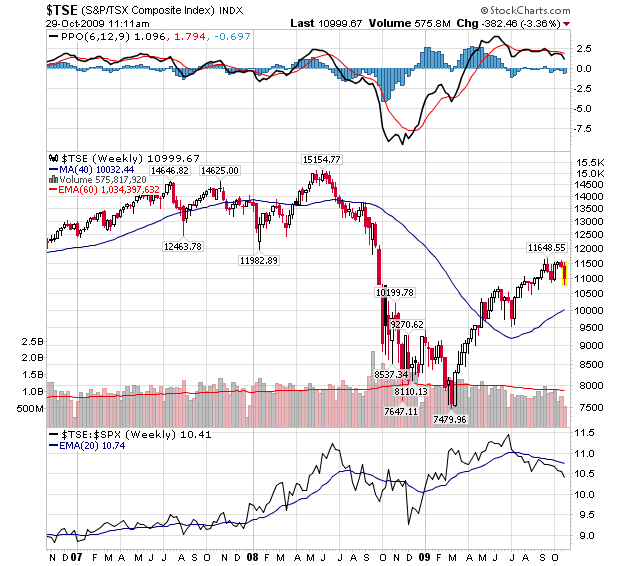
Across the board weakness, with a special emphasis on Energy and Materials, knocked the TSE for an oversized loss yesterday, ending the day at a two-month low. The TSE decline 248.21 or 2.25% to 10,805.33, a level it last saw on September 3.
Two days ago I wrote that cyclical weakness could carry the TSE down to 10,600. I mentioned that this would happen “in coming weeks,” but we’ve fallen 430 points in the two days since I wrote that.
Energy 133.28 -4.30
Financials 164.66 -0.76
Health Care 33.70 -0.60
Industrials 83.46 -2.21
Information Technology 26.33 -0.97
Metals & Mining 869.45 -59.28
Telecommunications 74.36 -0.59
Utilities 176.72 -1.76
TSE Venture:
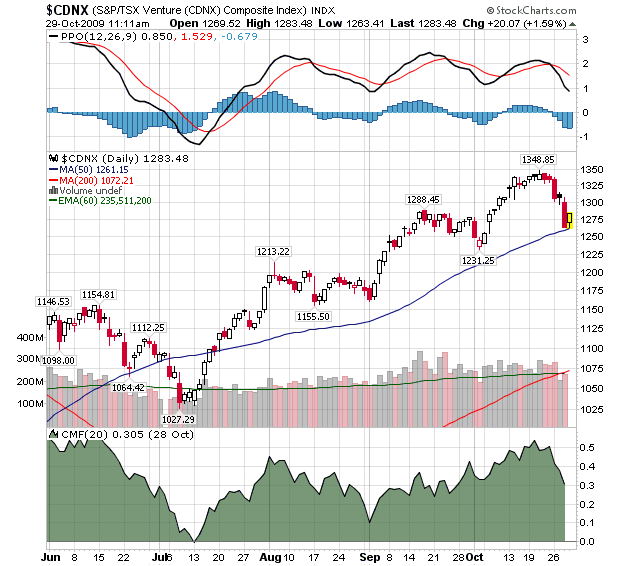
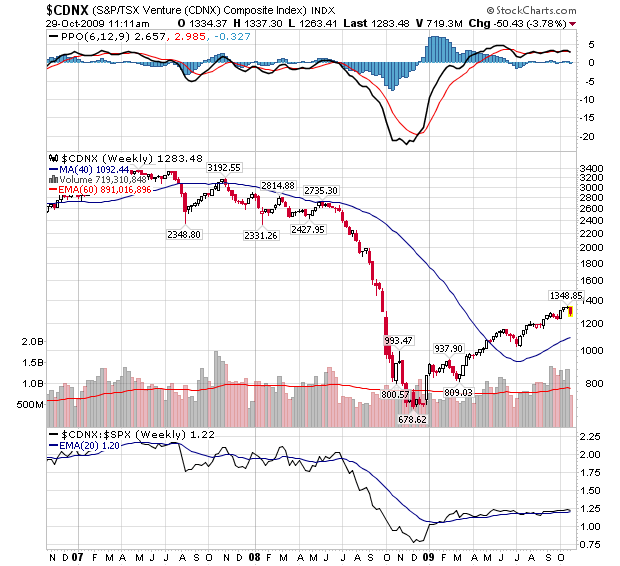
Falling precious metal prices hit the Venture extra hard yesterday, closing with a loss of 43.05 or 3.30% at 1263.41.
Look for support at the 1231.25 low of October 2.
THE CANADIAN DOLLAR (using the FXC Exchange Traded Fund):
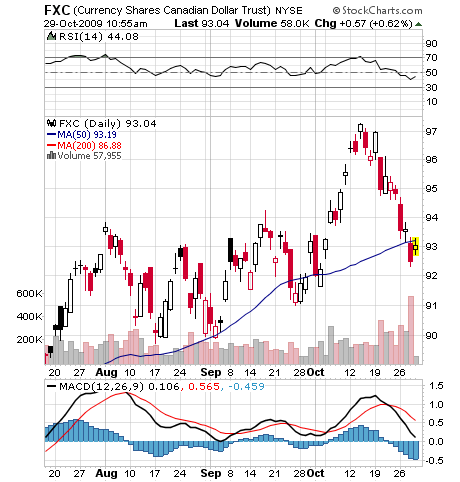
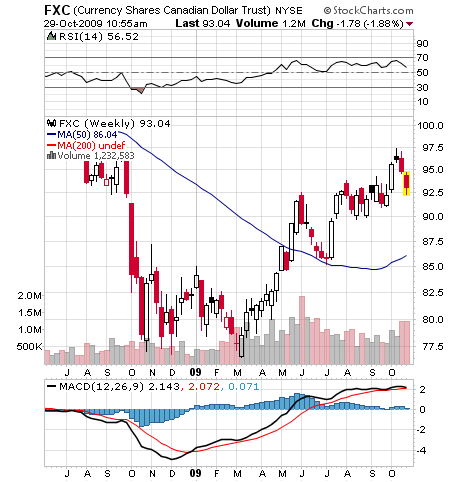
The rally in the US Dollar and steep declines in commodities, regardless of which currency you price them in, hit the Canadian currency hard yesterday. FXC fell 1.11 to 92.47.
With several Negative Volume Reversals ™ confirming a trading top in FXC beginning October 15 and the face we have broken below the 50 day moving average, we could be looking at a break into the high 80s. For the moment we have to be cautious until upside volume reappears and the current correction runs its course. Look to support at 91.00 from the September 25 low and then 89.75-89.91 from the August 17 and September 2 lows.
Globe and Mail reports now that Nouriel Roubini has dispensed with the current slump, it’s time to move on to the next global calamity. The New York University professor, nicknamed Dr. Doom for his famously grim but accurate prediction of the financial meltdown that flattened economies around the world, said Thursday the U.S. recession appears to be over. But he warned that a new asset bubble fuelled by rock-bottom interest rates and a falling U.S. dollar could trigger another financial disaster. “This asset bubble is totally inconsistent with a weaker recovery of economic and financial fundamentals,” Dr. Roubini told a conference in Cape Town, South Africa, by satellite, reported by Bloomberg News. “The risk is that we are planting the seeds of the next financial crisis.” The culprit: Investors around the world borrowing cheap U.S dollars and using them to snap up equities, corporate bonds, commodities and other assets, driving up prices far beyond what could be justified by economics.
Nouriel Roubini’s article:
Nouriel Roubini warns of bubble
Now that Nouriel Roubini has dispensed with the current slump, it’s time to move on to the next global calamity.
The New York University professor, nicknamed Dr. Doom for his famously grim but accurate prediction of the financial meltdown that flattened economies around the world, said Thursday the U.S. recession appears to be over. But he warned that a new asset bubble fuelled by rock-bottom interest rates and a falling U.S. dollar could trigger another financial disaster.
“This asset bubble is totally inconsistent with a weaker recovery of economic and financial fundamentals,” Dr. Roubini told a conference in Cape Town, South Africa, by satellite, reported by Bloomberg News.
“The risk is that we are planting the seeds of the next financial crisis.”
The culprit: Investors around the world borrowing cheap U.S dollars and using them to snap up equities, corporate bonds, commodities and other assets, driving up prices far beyond what could be justified by economic fundamentals or growth prospects.
….read more of Roubini’s articl HERE.

Marks VRTrader Silver Newletter covers Stock, TSE Stocks, Bonds, Gold, Base Metals, Uranium, Oil and the US Dollar.
More kudos – Mark Leibovit was named the #1 Intermediate Market Timer for the 10 year period ending in 2007; the #1 Intermediate Market Timer for the 3 year period ending in 2007; the #1 Intermediate Market Timer for the 8 year period ending in 2007; and the #8 Intermediate Market Timer for the 5 year period ending in 2007. NO OTHER ANALYST SURVEYED APPEARED IN ALL FOUR CATEGORIES FOR INTERMEDIATE MARKET TIMING AS PUBLISHED IN TIMER DIGEST JANUARY 28, 2008!
For a trial Subscription of The VR Silver Newsletter covering Stocks, Bonds, Gold, US Dollar, Oil CLICK HERE
The VR Gold Letter is available to Platinum subscribers for only an additional $20 per month, while for Silver subscribers the price is only an additional $70.00 per month. Prices are going up very shortl, so act now! Separately, the VR Gold Letter retails for $1500 a year! The VR Gold Letter is published WEEKLY. It is 10 to 16 pages jam-packed with commentary and charts. Please call or email us right away. Tel: 928-282-1275. Email: mark.vrtrader@gmail.com .
Commodities & Stocks Ready to Bounce or Rally?
Commodities and stocks almost look ready for a rally or at least a relief bounce. The market is down over 5% and the normal pullback this year has been 4%. Using technical analysis and inter-market analysis we can see that the market is reaching extreme lows and this usually means we are only a couple days away from a rally.
I work with several market technicians as we all analyze the market a different way and share our work with each other to gain maximum insight on the broad market moves. We analyze momentum cycles, magnetic cycles, volatility levels, support & resistance levels, volume analysis and inter-market analysis.
Each of us has found a formula which works for our individual style of trading. And by combining our work we have found that we can collectively produce some very exciting trading signals for the broad market. We focus on leveraged index funds in order to take advantage of our insights. While nothing in trading is ever perfect, the analysis for timing the broad market is very exciting.
Here are some quick charts on where the market is trading.
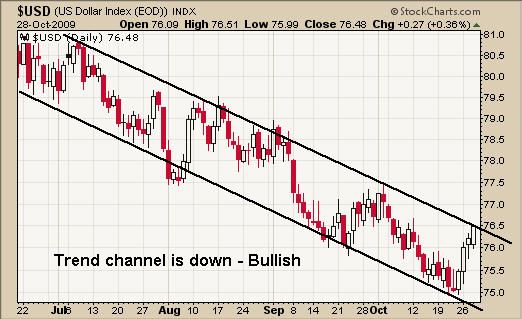
US Dollar – Daily Dollar Price Chart
This chart is a no brainer. The trend is down and trading at resistance. If the US dollar reverses back down we will see stocks and commodities move higher.
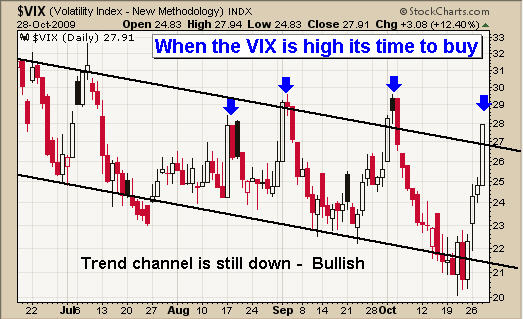
VIX – Daily Volatility Index
Again, overall the trend is down and trading at resistance. As the saying goes “When the VIX is high its time to buy”. Just to be clear, the VIX is low compared to the previous highs set back in 2008 which was around the 80 level. But, if we want to keep things simple for the current trend then the VIX is high for our current market condition. The VIX moves in the opposite direction of the equities market.
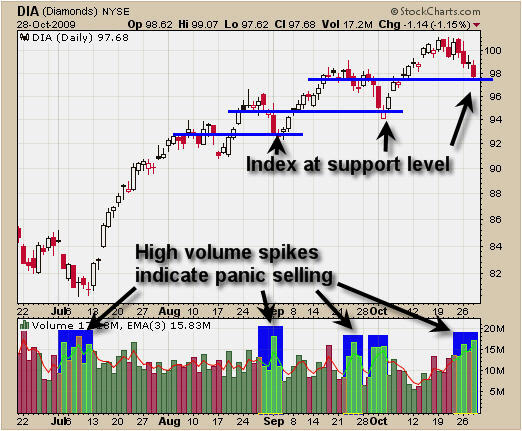
DIA – Dow Jones Industrial Average ETF Fund
Here is the Dow Jones index fund and it clearly shows that when investors are selling out of their positions and getting scared of a market collapse, volume rockets higher. When we see the price pullback to possible support levels and volume increases that is a time when we should be looking to scale into a long position for a bounce, such as now.
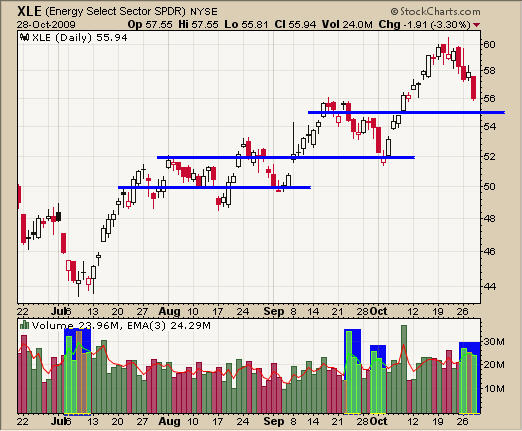
XLE – Energy Sector ETF
You can see that the energy sector is very close to a support level and volume is high. With the US dollar about to reverse back down it will help boost this sector as it is tied in with commodity prices which rise with a falling dollar. I expect we will see a price gap lower and fill this area before moving higher.
GLD – Gold ETF Fund & Silver
This chart has not changed much from last weeks report. We are getting the drop as expected this week. We could see the gap fill from early October before gold stabilizes.

Silver is in the same situation. Gold and silver move in tandem so we are waiting for a bottom before looking for a low risk entry point.
Commodity & Stocks Trading Conclusion:
To keep things short and to the point, I am seeing momentum cycle lows as of today, magnetic wave lows today, and most commodities and indexes trading at support. These observations, coupled with the US dollar at a possible resistance level and market volatility spiking to an extreme high, lead me think a bounce is in the cards.
The market has had an amazing rally so far this year and I feel that we will have a solid year end rally going into Christmas. That being said, the recent sharp correction could form an ABC retrace pattern which means we get a bounce in the next week or so, then one more multi day sell off which will scare even more bulls out of the market. I am going to be scaling out of this oversold play quickly to lock in some gains while allowing a smaller position to ride for larger gains.
For my FREE trading reports join my newsletter HERE (middle centre of the page)
About TheGoldAndOilGuy.com. Chris Vermeulen’s personal stock trading strategy is simple and effective for trading stocks, funds, futures and index’s. Its EASY TO LEARN STOCK TRADING. Subscribers of the service are given premium trading signals for the energy, gold & silver etf funds. My average annual return for the past 4 years is 36%. I do not use margin to boost our returns like many other investing websites. I now also provide signals for the 200% leveraged gold funds so you can double your returns for both long and short signals.
(for a larger image of the chart and Peter’s full comment go HERE.)
As noted over the weekend, option expiration in the gold market led to weakness. What a surprise-lol! While risk remains to $1,015 – $1,025, and even as low as either side of $1,000 if the U.S. Dollar can get above 78 on the U.S. Dollar Index, don’t lose sight of the bigger technical picture. Richard Russell of The Dow Theory Newsletter has correctly noted how gold has once again broken out from a bullish triangle formation. We remain in a secular bull market that’s been stealth-like and dominated in the news by bears (who have been wrong over and over again) and weak-kneed bulls who missed the latest up move and desperately need a bigger pullback to get back in so not to lose face.
Special Alert
Continental Minerals (KMK-TSX-V $1.50) is my largest personal holding of which I added to aggressively this morning. While I don’t work for the company, I do work for other companies managed by KMK’s management group, Hunter-Dickinson.
I’ve been speculating that KMK is a takeover target. The recent entry of a Chinese mining company as the second large Chinese company to hold a significant stake in KMK, IMHO has set off a ticking clock for either them or another party or parties to make a bid for KMK. This news today was the tip off as far as I’m concern. I believe they’re posturing to make a bid. The original large shareholder can not afford IMHO to wait and must be preemptive.
I’m raising the buy limit on KMK to $1.55. Please remember, one must be prepared to lose part or all their capital when speculating/gambling.
More market reading suggested by Peter:
Crack In The U.S. Stock Market?
To HERE Peter speak and others speak on Trading go HERE: 
On Major Moves, Grandich has been very right and not only saved many investors fortunes, but expanded them dramatically. On November 3, 2007 at the MoneyTalks Survival Conference, Peter Grandich of the Grandich Letter warned that “an unprecedented economic tsunami will hit American beginning in 2008”. Peter advised publicly to short the US market two days from the top in October, 2007 and stayed short until the last week of October, 2008. He began to buy stocks in March 7th, 2009. He also bought oil and oil related investments near the lows after the dive from $147.
….go to visit Peter’s Website.
IT’s the comfortably off middle-classes who get destroyed by hyperinflation. They tend to continue trusting the institutions they have trusted all their lives, and by the time they grasp what is happening it is too late.
It may look odd to start a review of this risk with a discussion of gold. But starting with the basics is the best way to get the hyperinflation process understood. Understanding gold as a store of value Many people ask “Why is gold valuable when it is so useless?” It’s a reasonable question and there is a reasonable answer.
….read more HERE.
-
I know Mike is a very solid investor and respect his opinions very much. So if he says pay attention to this or that - I will.
~ Dale G.
-
I've started managing my own investments so view Michael's site as a one-stop shop from which to get information and perspectives.
~ Dave E.
-
Michael offers easy reading, honest, common sense information that anyone can use in a practical manner.
~ der_al.
-
A sane voice in a scrambled investment world.
~ Ed R.
Inside Edge Pro Contributors

Greg Weldon

Josef Schachter

Tyler Bollhorn

Ryan Irvine

Paul Beattie

Martin Straith

Patrick Ceresna

Mark Leibovit

James Thorne

Victor Adair