
Daily Updates
U.S. Stock Market – The U.S. stock market is in the eye of an economic, social, political and spiritual hurricane that first hit its shores in 2008. Eventually, what has been seen in Europe shall be but an “opening act” to what shall play out here in America. In the meantime, yours truly took out a “temporary” membership card in the “Don’t Worry, Be Happy” crowd, but know it shall likely expire once Santa is safely back and resting at the North Pole.

Gold – “Mother” of all gold bull markets continues. The gold perma-bears and weak-kneed bulls shall once again find only coal in their Christmas stockings.

U.S. Bonds – Avoid just like one should avoid buying any pictures of Roberto Luongo hoisting the Stanley Cup – they’re both pipedreams.

U.S. Dollar – A faint blip up in the U.S. economy and the Euro mess has allowed the terminally ill Uncle Sam currency to stay in a fairly tight trading range. I’m looking for new lows for the dollar in 2012 and beyond.

Oil and Natural Gas – I’ve moved up my bottom range for oil from $75 to $85 and continue to believe we shall see $100+ before the ball falls in Times Square. The more natural gas is under $4 the more I like it.


Grandich Publications Clients
Abacus Mining & Exploration Corp – In a quiet period that hopefully shall end before too long.
Alderon Iron Ore – If you think 2011 was good, 2012 IMHO can be even better.
Argus Metals Corp – Some flashes of greatness but still has a lot of work ahead of it to end up the exception to the rule.
Cap-Ex Ventures – The stars seem to be lining up for it. Stay tuned.
Crosshair – The Company is doing much better South of the Border. I suspect it shall become a U.S. story in 2012 and beyond.
Crescent Resources – Back near square one and awaiting word from the Company on it plans on moving off the square.
Donner Metals – It’s so close to becoming one of the small minority of juniors who make it all the way to production, one can taste it. Here’s to David Patterson’s tireless efforts bearing full fruit.
Donnybrook Energy – I’ve no special insight but I think come this time next year the company may no longer be independent.
Enertopia Corp – Please read this.
Excelsior Mining – One should always be aware of my potential conflicts of interest and biases: my 2.5 million shares ownership of MIN shares (that can change at any time) and my extreme fondness for Mark Morabito and the Exploration Group must be fully understood when taking into account anything I say. Having said that, I’m anticipating a banner year for MIN in 2012, and its long base-building around $.60 is setting the stage for the share price to move to much higher levels if the sizzle can turn into steak.
Garibaldi Resources – Not much info out in 2011. I hope to see management while I’m in Vancouver.
Heatherdale Resources – Better days in 2012 are the plan. Fingers and toes crossed.
Northcliff Resources – It remained rather quiet in 2011, but I have a good feeling that can change in 2012.
Northern Dynasty Minerals – It has been my albatross… but if it’s everything we had hoped for (but have been disappointed or sidetracked for what now feels like an eternity), it should start to bare fruit in 2012 (hoping it’s not just sour grapes)
Oromin Explorations – Another client I think that, come this time next year, may no longer be independent.
Rathdowney Explorations – Like its sister company Northcliff, I’m optimistic it can awaken in 2012.
Ridgemont Iron Ore – Please read.
Silver Quest Resources – I will be meeting with CEO Randy Turner while in Vancouver.
Spanish Mountain Gold – I had a good chat with Chairman Ian Watson and the future appears bright at SPA.
Sunridge Gold – In all my years speculating/gambling in juniors, no one company’s share price has ever seemingly been more separated from company fundamentals than SGC. Here’s to them coming much more aligned in 2012.
Timmins Gold – Trading in the U.S. should only help this emerging gold producer.
Please Note
Curis Resources – My working relationship with Curis Resources ends shortly and while I’m still overall positive on them, my personal holdings and working relationship with Excelsior Mining has come to a point where I can’t fairly service CUV. I wish them well.
Formation Metals– After first working for Formation Metals back in the 90s, and on and off since then, I no longer have the appropriate confidence one needs to effectively do the job and have resigned effective at months-end.
Tracking List
I’m comfortable holding most of the major mining producers on my list as I’m looking for gold and silver to continue working their way higher for the balance on 2011 and into 2012.
Uranium stocks are clearly contrarian plays as the vast majority of experts who not too-long ago saw $150 or even $200+ uranium prices now can’t see prices getting out of their way for as far as the eye can see. This suits me fine.
Confessions of a Wall Street Whiz Kid

I will be discussing what I am doing now in my own trading and how I was able to earn a 25% return on capital this past week at the Money Talks Insiders Conference in Vancouver on November 19th. For information on this conference, click here. If you wish to buy tickets to attend the conference, use the promotion code SOBC2011 and receive $25 off plus $50 of your ticket price will be donated to the Special Olympics. Even if you can’t make it to Vancouver, it is possible to watch the conference on video, the information page has more details.
As a trader, how you judge success will have an effect on how you approach the market. Define success incorrectly and you may doom yourself to failure before you ever make a trade. I think unrealistic expectations are a major reason why most people cannot make it as traders. I want to help by showing you how to judge performance and what your expectations should be.
Conventional wisdom leads most to judge success using percentage gain over a time period. This seems to make a lot of sense but it has problems over time. Anyone can get lucky in the relative short term, making them think that they are smart because the market hands them some nice returns. However, the market cycles and if you fail to catch one of the strong up cycles that lets everyone be a winner, you will probably lose it all.
Risk management needs to be part of your criteria for judging success.
It is also important to recognize that the stock market is extremely hard to beat and it is nearly impossible to know what one individual stock will do. With good strategy testing, you can judge what a set of rules will achieve over a large number of trades and use that as your gauge.
Therefore, it is dangerous to judge success over a small number of trades.
A strategy’s potential is measured by its expected value. A strategy that is wrong 90% of the time can still be a great money maker if it makes a lot when it is right. With the same logic, there are strategies that are almost always right but which still lose money because the gainers are outweighed by the losers.
So, do not judge success the way you judge performance on a test, it is about how much you make when you are right versus how much you lose when you are wrong.
Each trade does not have an equal weighting in the measure of overall success. In my trading, I find that I have lots of small winners and small losers that tend to balance each other out. However, it is the occasional big winners that serve as the source of most of the profits.
You have to be patient to let the big winners happen.
Let’s know go through an example of how a trading strategy might work.
Suppose you have a set of rules which, after exhaustive testing, has the following characteristics:
How would unrealistic expectations destroy the potential of this strategy?
What would happen if the trader expected to never be wrong and, as a result, hung on to his losers until they became winners? Since some trades will never be winners, this would mean he would have much larger losers than the disciplined trader who used stop loss points and planned his losses. Instead of having an average reward for risk of two to one, it might be one to two.
What would happen if the trader judged her performance one trade at a time? With each win – elation. With each loss – despair. This emotional rollercoaster would affect their ability to make the right trading decisions and eventually the trading rules would be broken. The trader would fall apart.
What would happen to the trader who did not understand the expected value of their trading strategy? They would likely fail to limit downside and maximize upside. They would think it was good to make a certain amount of money on a trade rather than judge their success by how much reward they earned for the risk that they took. In time, they would be broke.
Finally, what would happen to the trader who failed to let the big trades happen? Since the majority of their profits come from a minority of their trades, the strategy that they tested and found to be profitable would fail to be so in real trading. The emotional desire to lock in fast profits rather than let the winners run would turn them in to traders with a high success rate but not a lot of profits.
Change how you judge success so that you can approach the market with the mindset of the winning trader. This may contribute more to your success than your ability to pick the right stocks.

The stock markets continue to be gripped by uncertainty causing prices to move up and down with very short term swings and no long term trend. That makes it a challenging environment to be a longer term trader
One sector that may start to heat up is Energy. Oil prices have been moving higher for the past six weeks and are now near $100 a barrel. That can have a negative effect on the economy but will be positive for Oil stocks. This week, I looked the charts of the most active Canadian stocks with a focus on the Energy sector. Here are a few stocks to watch:=

1. T.BNK
T.BNK is building a Bottom Fishing pattern. It broke its downward trend in October and is now building a rising bottom consolidation. A breakout through $5.75 with good volume support is the third step that I look for to identify good turnaround candidates, watch for that.

2. T.IMO
T.IMO is another chart in this same Bottom Fishing Pattern. Watch it for a break through $43.

3. T.PWT
T.PWT is the third stock that I like because it too is building this pattern. It is best to wait for the break through resistance before considering it as the breakout increases the probability of success. Resistance at $19.

Disclaimer
This is not an investment advisory, and should not be used to make investment decisions. Information in Stockscores Perspectives is often opinionated and should be considered for information purposes only. No stock exchange anywhere has approved or disapproved of the information contained herein. There is no express or implied solicitation to buy or sell securities. The writers and editors of Perspectives may have positions in the stocks discussed above and may trade in the stocks mentioned. Don’t consider buying or selling any stock without conducting your own due diligence.
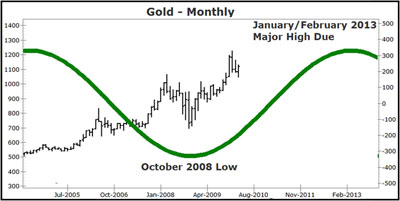
Gold has just entered its strongest time of the year, embarking on a major seasonal rally. Naturally this is very bullish for not only this metal, but the companies that wrest it from the bowels of the Earth. Gold’s well-established seasonality is important for speculators and investors to understand, as it offers many great insights to help fine-tune the timing of precious-metals-related trades.
Technical, fundamental and seasonal influences point to another volatile period for equity markets around the world this week. Economically sensitive sectors are following their seasonal patterns. However, most sectors remain short term overbought after huge moves since October 4th. Preferred strategy is to accumulate economically sensitive equities and related ETFs on short term weakness, particularly if they benefit from favourable seasonal influences.
Ed Note: A sample of the 45 charts Don analyses and comments he posts:
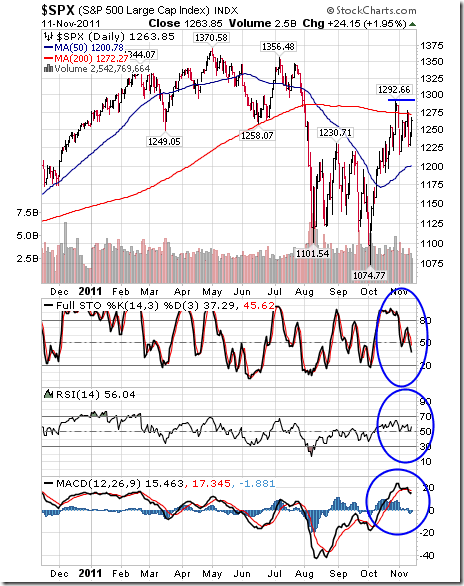
The S&P 500 Index gained 10.62 points (0.85%) including 24.15 points on Friday. Intermediate trend is neutral. Resistance is forming at 1,292.66 and near its 200 day moving average at 1,272.27. Short term momentum indicators have rolled over from overbought levels and are trending down. Short term downside risk is to its 50 day moving average at 1,200.78.
The TSX Composite Index fell 131.40 points (1.06%) last week despite a gain of 167.98 points on Friday. Intermediate trend is down. Resistance is forming at 12,541.84. Short term momentum indicators have rolled over and are trending down. Strength relative to the S&P 500 Index remains negative. The Index bounced from near its 50 day moving average currently at 12,078.56.

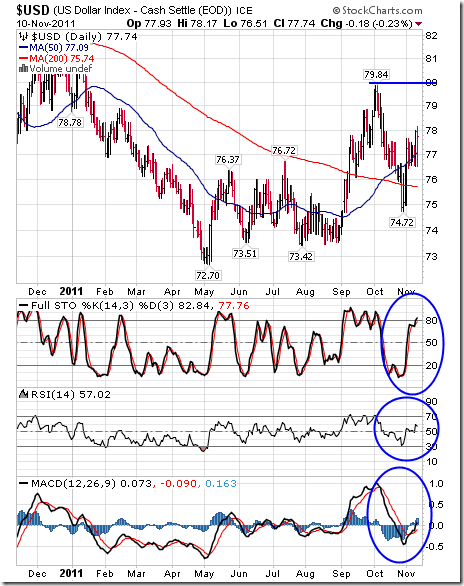
The U.S. Dollar Index gained 0.78 last week. Intermediate trend is up. The Index remains above its 50 and 200 day moving averages. Resistance is at 79.84. Short term momentum indicators are overbought, but have yet to show signs of peaking.
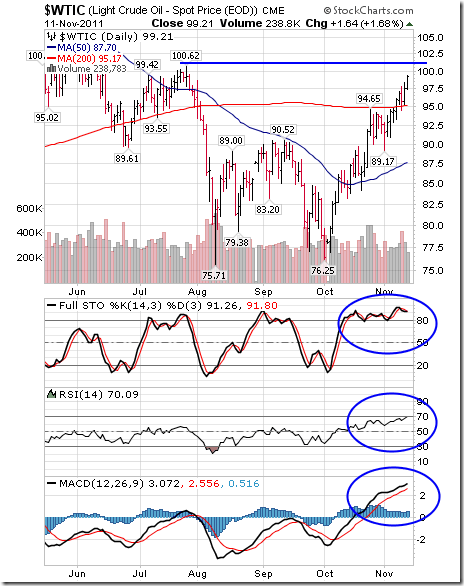
Crude Oil gained $4.79 per barrel (5.07%) last week on growing concerns about a disruption in crude oil production in Iran. Intermediate trend is up. Crude moved above its 50 day moving average last week and is approaching resistance at $100.62. Short term momentum indicators are overbought, but have yet to show signs of peaking.
Gold gained $33.10 per ounce (1.88%) last week despite strength in the U.S. Dollar (an encouraging technical event). Nice bounce from near its 50 day moving average currently at $1,726.65. Short term momentum indicators are overbought, but have yet to show signs of peaking.

…..more than 45 Charts analysed HERE
Well, we’re certainly seeing plenty of action, aren’t we? Of course, the big news behind all the markets right now is still Europe. The crisis is rapidly worsening, with there now being a very high probability, as I’ve said all along, that Greece will default and exit the euro to bring back its currency.
In addition, the contagion is now hitting Italy, whose bond market is collapsing, despite the firewalls that were agreed to just a couple of weeks ago by European leaders. So the euro is now taking a shellacking again.
Mark my words: The European debt crisis is still in its infancy! In the weeks and months ahead, here’s what you can expect …
- Further market losses in the sovereign bonds of Italy, Spain, Portugal and even France.
- Further losses in the value of the euro currency.
- More crisis summits by European leaders that basically end up with nothing more than they’ve generated all along: A lot of hot air, no details, and a very stubborn attitude toward keeping the euro in place, at virtually all costs, even at the cost of a widespread depression in Europe, and rebellions.
Also, expect Greece to default and take back its currency, and new resounding calls for Italy, and perhaps even Spain, to start considering the same.
But also mark my words on this: AS BAD AS THE CRISIS IN EUROPE IS GETTING, IT IS GOING TO PALE IN COMPARISON TO THE U.S. DEBT CRISIS WHEN IT GOES FULL TILT, PROBABLY LATER NEXT YEAR.
AND AS I’VE SAID ALL ALONG, ALL THIS WILL ULTIMATELY SPELL NOT JUST THE DEATH OF THE EURO CURRENCY, BUT OF THE DOLLAR AS WELL, AND EVENTUALLY, THE NEED FOR AN ENTIELY NEW GLOBAL MONETARY SYSTEM.
Right now, we must also keep in mind that no matter how short-term bullish many markets may sometimes appear, we are in crisis mode, and the big surprises will be to the DOWNSIDE.
We’ve just seen it in stock markets, which despite their rallies over the last two weeks are now turning down sharply. The same thing is now starting to hit again in the commodity markets, where gold, silver and many other commodities are beginning to also roll over again.
So let’s now go right to the charts. FIRST UP, none other than GOLD.
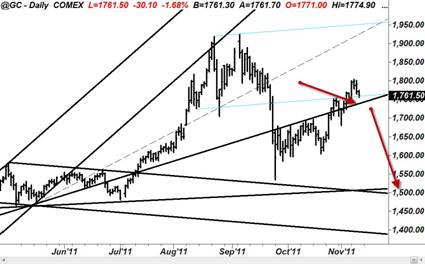
As you can see from the chart of gold below, gold did indeed manage to rally back to the $1,800 level, just as I expected. However, given all the bad news, wouldn’t you think gold should be trading much higher, near or even at record highs?
Well, it’s not and the reason is fundamentally the European crisis is causing savvy investment money to go to cash for safety, even to the U.S. dollar, rather than any investing at this time.
So the pressure is still on gold, and once you see it fall back below this uptrend line here with the red arrow, I believe you’re going to start seeing gold slide to at least the $1,500 level and very possibly, much lower. The bottom line is you should hold long-term gold, but refrain from adding any new positions or trading the long side on a short-term basis.
Next, silver. Let me preface my comments on silver with full disclosure. I am personally SHORT the silver market AGAIN, as I believe another devastating crash in silver is about to begin. And this time, it could prove to be even worse, with a plunge from the $34 level down to the $25 level and lower in the cards.
Fundamentally, there is simply no way, in my opinion, that silver is headed much higher when most big money is moving to cash and when the industrial uses of silver are certainly hitting some speed bumps as Europe and U.S. economies slump heading into this crisis.
In addition, all of my cycles and technicals on silver are BEARISH. Here’s the latest chart. You can clearly see that silver did not even rally as much as gold did over the last couple of weeks and now, it’s already turning back down. Notice how silver remains well below the two downtrend lines, noted by the blue arrows, and even below a more minor downtrend line.
Also notice where the bottom of the current channel is, down below $25. That’s the path I soon expect silver to head into, and a very sharp decline, which can begin at almost any minute.
Silver Preparing For Another Crash

Now, let’s go to the U.S. dollar. Naturally, as cash leaves Europe and heads down a rabbit hole for safety, it’s going to cash, and since the dollar is still the world’s reserve currency, that means the dollar’s value is rising. You can see it in the chart of the Dollar Index.
After testing extreme support, the dollar started a sharp rally that just recently broke through the upper side of the declining trend channel. While the dollar will suffer some pullbacks, everything I monitor tells me that the dollar is going to rally more now, probably up to the 81 to 82 level in the Dollar Index. Now, keep in mind, this is a short- to intermediate-term move in the dollar. The long-term trend for the dollar is still MUCH lower. That has not changed.
While Euro Gets Sucked Under
Now let’s go right to the Dow Industrials. Yes, the bounce in the Dow back up to the 12,187 level surprised even me but resistance has held strong at that 12,200 level and now the Dow is squarely back on track for lower prices. I still fully expect we will eventually see the Dow 9,000 level in the weeks and months ahead, but keep in mind the stock markets now are going to swing as wildly as commodities or currencies do.
Take a look now at the chart of the Dow Industrials. You can see the latest rally and how it stopped dead at the lower end of my system resistance channel, which spans from 12,200 up to 12,800. That’s a massive roof of overhead resistance, and I believe that the test of that roof is now complete.
Now, the market is turning back down, and quite frankly, there isn’t much in the way of system or technical support until the Dow gets back down the 10,400 level which is a critical level, as I’ve noted for you previously. Once that level gives way — and I DO expect it to give way — then the Dow will be on a path that will bring it down the 9,000 level.
So right now is NOT the time to be heavily invested in stocks. Instead, I recommend sticking with my recent recommendations for speculative positions using inverse stock ETFs.
That’s it for today. As always, please stay tuned to any of my specialized publications you subscribe to for more frequent and detailed analysis and recommendations!
-
I know Mike is a very solid investor and respect his opinions very much. So if he says pay attention to this or that - I will.
~ Dale G.
-
I've started managing my own investments so view Michael's site as a one-stop shop from which to get information and perspectives.
~ Dave E.
-
Michael offers easy reading, honest, common sense information that anyone can use in a practical manner.
~ der_al.
-
A sane voice in a scrambled investment world.
~ Ed R.
Inside Edge Pro Contributors

Greg Weldon

Josef Schachter

Tyler Bollhorn

Ryan Irvine

Paul Beattie

Martin Straith

Patrick Ceresna

Mark Leibovit

James Thorne

Victor Adair