
Daily Updates
Today I am sitting listening to Ralph Merkle lecture on nanotechnology, part of a 9-day-long series of lectures on how accelerating change in technologies of all types will affect our world. 15-hour days and intense discussions are stretching my brain, but I still have to make sure you get your Outside the Box. Fortunately, I came across today’s OTB last week from my friends at GaveKal, who offer a way to think about the Greek crisis and what it means for all European bonds.
There are a lot of allegations about manipulation of European bonds. It’s those nasty traders. GaveKal shows us data that bond yields are actually quite logical, given the debt of various countries. But they also warn us, as part of their conclusions:
“As of today, there seems to be no additional risk premium related to the possible dislocation of the Eurozone. Clearly, this possibility would have such devastating effect on world financial markets that investors cannot even think of it (even if many talk about it).”
I suggest you read at least the beginning and then the end of this piece, even if the data makes your eyes glaze over. (I must admit the data made me feel all warm and fuzzy, but then I am somewhat of a wonk.)
Have a great week. I am getting overwhelmed here in California, learning about the future. It is going to be amazing, even if our bonds drop in price. We will live in what may be the most interesting and exciting period of human history. What a contrast between the financial markets and what the scientists continue to amaze us with. It is one of the reasons I think we Muddle Through, in spite of our rather negative economic environment.
John Mauldin, Editor
Outside the Box
An Attempt to Think Through the Greek Crisis
GaveKal Ad-Hoc Comment
Asset Allocation & Economic Research
http://www.gavekal.com
When covering a news-event such as a train-wreck, journalists will typically take one of two angles: the descriptive narrative, full of gory details and hair-rising tidbits; or the human angle, with stories inviting reactions such as anger, admiration, pity, sadness, etc. from their readers. Which brings us to the latest financial train-wreck, namely Greece and the possibility that some of Southern Europe’s weakest states will face difficulties in rolling over ever larger amounts of debt issued in a currency they cannot print.
Unfortunately, the looming crisis in Europe has typically led journalists scurrying to file either ‘descriptive stories’ on how a country like Greece could find itself in its current predicament, or ‘human interest’ stories on who has made, or lost, money out of recent events. But such stories clearly miss the forest for the trees. Surely the more interesting and important question is what the current unraveling in Europe means for economies going forward? Of course, figuring out what will happen next in Europe is as easy to grasp as a soapy eel. But this should not stop us from drawing some already very obvious conclusions. Moreover, one can probably assume that the panic-like situation currently prevailing in the markets must be generating some opportunities. But how can we identify those? Answering these questions is the aim of this paper.
1- A Review of Recent History
…..read more HERE
1. Lesson in Discovery
2. Uranium in Virginia
1. LESSONS IN DISCOVERY INVESTING
Several years ago I met with and discussed a business arrangement with a South African family. That family went on to develop Petra Diamonds, a South African mining company, in 2000. This AM I noted that Petra sold a single diamond it, discovered in South Africa for $35.3 million. This is the highest price ever recorded for the sale of a single rough diamond breaking a record. The 507 carat stone was gem quality.

….read more HERE
Ed Note: a small selection of the 47 Charts Analysed on Don Vialoux’s Tuesday Morning comment HERE
The Bottom Line
The recovery in equity markets since February 5th is the start of an intermediate move by North American equity markets that is expected to last until May. However, equity markets have become short term overbought. Preferred strategy is to purchase equities and Exchange Traded Funds on weakness in sectors with favourable seasonality including silver, platinum, mines & metals, oil services, energy and materials.
Miners set for a great spring
The Canadian mining sector benefits from a series of encouraging news events during the next three months. Seasonal influences also favour the sector until May.
….read more of Don Vialoux article in the National Post HERE.
A selection of the 47 Charts in Don’s Monday report HERE.
The S&P 500 Index slipped 4.68 points (0.42%) last week. Intermediate trend remains up. Resistance is at 1,150.45. Support is at 1,044.50. The Index is just below its 50 day moving average. MACD and RSI continue to recover from a short term oversold level. Stochastics remain short term overbought. Seasonal influences remain positive. Current intermediate upside potential is to resistance at 1,150. 45.
The TSX Composite Index eased 79.66 points (0.68%) last week. Intermediate trend remains up. The Index trades just above its 50 day moving average. MACD and RSI continue to recover from oversold levels. Stochastics remain short term overbought. Support is at 10,990.41. Resistance is at 12,070.20. Seasonal influences remain positive. Strength relative to the S&P 500 Index is positive and historically remains positive until at least mid March. Current intermediate upside potential is to resistance at 12,070.20.
The Shanghai Composite Index added 23.55 points (0.78%) last week. Intermediate trend is down. The Index moved above its 200 day moving average last week. MACD and RSI are recovering from a short term oversold level. Stochastics already are short term overbought, but continues to trend higher. Support is at 2,890.02. Resistance is at 3,306.75 and 3,334.01. Strength relative to the S&P 500 Index remains negative, but is close to changing trend.

The U.S. Dollar unsuccessfully tested resistance at 81.47 and is showing early technical signs of rolling over. Last week it slipped 0.21. MACD is short term overbought and moved lower on Friday. RSI has declined from above the 70% level. Stochastics fell below the 80% level late last week. Current intermediate downside risk is to the top of its previous trading range at 78.45 and to its 200 day moving average at 78.10.
The U.S. Dollar has a history of peaking at the beginning of March and trending lower from March to December. Conversely, the Euro has a history of bottoming near the end of February and moving higher until the end of May.
….read more and view the 47 Charts in Don’s Monday report HERE.
Don Vialoux has 37 years of experience in the Investment Industry. He is a past president of the Canadian Society of Technical Analysts (www.csta.org) and a former technical analyst at RBC Investments. Don earned his Chartered Market Technician (CMT) designation from the Market Technician Association in 1995. His CMT paper entitled “Seasonality in Canadian Equity Markets” was published in the Spring-Summer 1996 edition of the MTA Journal. Don also has extensive experience with Exchange Traded Funds (also know as Index Participation Units) as well as conservative option strategies. In 1990 he wrote a report that was released in the International Federation of Technical Analyst Journal entitled “Profiting from a Combination of Technical and Fundamental Analysis”. The report introduced ” The Eight Phases of the Stock Market Cycle”, an investment concept that continues to identify profitable entry and exit points for North American equity markets. He is currently a member of the Toronto Society of Fundamental Analyst’s Derivatives Committee. Now he is the author of a daily letter on equity markets available free on the internet. The reports can be accessed daily right here at www.dvtechtalk.com.
China is now the world’s economic engine, taking the place of the US. I look at this chart of the “China 25,”which I liken to the Chinese Dow, and I don’t like the looks of the chart. FXI has rolled over and broken below both its 50-day and 200-day MAs. It this big money moving out of China’s best stocks? I’m afraid that’s what might be happening. If China crumbles, then what?

Soros “Very Cautious” on China’s Economy
02/27/10 Stockholm, Sweden – With over 10 trillion yuan in Chinese bank loans disbursed in 2009, and more trillions on the way, George Soros, chairman of Soros Fund Management, remains concerned China’s economy is overheated. In a recent Hong Kong interview he explains how a hard landing could be in the making.
From MarketWatch:
“Caixin: What is your attitude toward China now? Positive or negative?
“Soros: I’m very cautious, until the economy cools off a little. When it does, I will be more optimistic again.
“Caixin: In 2009, Chinese banks issued 10 trillion yuan in new loans. The government has said there will be another 7.5 trillion yuan in loans this year, although banks loaned more than 1 trillion yuan in January alone. Do you think this unprecedented credit growth will eventually lead to overheating, inflation and harsher policy tightening? Do you worry about the potential risk of non-performing loans in the medium- to long-term?
“Soros: The overheating, the inflation, the harsh policy tightening is happening right now and it will continue to happen until the economy cools off. And with this explosion of credit, there are bound to be non-performing loans in due course. The extent depends on whether it is a hard landing or soft landing.”
We’ve seen the consequences of a credit bubble here in the US, and now we may see just how ugly a Chinese version may look. Soros goes into more detail on the bubble aspects of the Chinese economy, as well as how China’s currency revaluation may end up panning out, in MarketWatch’s coverage of froth in China’s economy.
Weekend Gold, Silver, Oil & Index Charts
Three weeks ago on February 5th, we saw an extremely high level of fear in the market with selling vs. buying volume at a 9:1 ratio. We note that in 2009 this extreme level of fear occurred at the bottom of each significant pullback.
Since this panic selling low in February 2010 we have seen stocks and commodities work their way higher, which we expected. Overall the broad market looks as though it’s trying to make a move higher.
Below are some ETF charts of gold, silver, oil and the indexes.
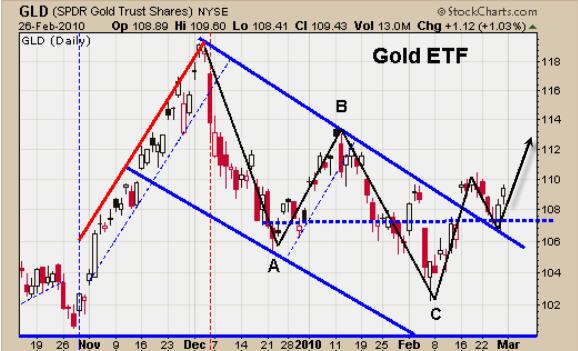
Gold lead the market higher in 2009 and also lead the market lower in December of 2009. It looks as though gold could be starting a new trend higher.
You can see the clean breakout of the down channel and then a test of the channel at support. This type of price action also forms an inverse head and shoulders pattern for those who like trading patterns. This is very bullish price action.
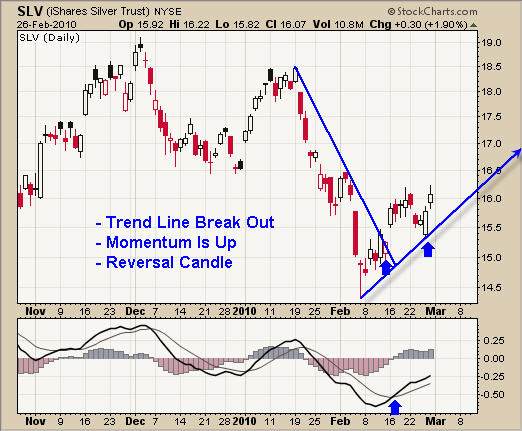
SLV Silver ETF – Daily Trading Chart
Silver has much of the same chart features as gold, but is slightly skewed. This is not particularly surprising though, as silver virtually always behaves with less defined chart patterns due to its characteristically funky price action.
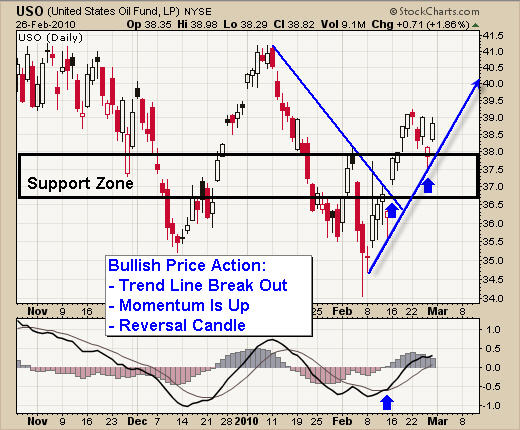
USO Oil Fund – Daily Trading Chart
As with gold and silver, oil’s trading chart has formed a pivot low also, but the trend line is much steeper than what I am looking for. I prefer a flatter trend line as price growth is more sustainable.
As you can see in on the USO chart, back in December price rallied at almost the same angle as is currently the case, and then notice what happened. Once the momentum died out the price dropped straight back down. I call steep trends like this a Parabolic Rally.
Scroll up and look at the first chart (GLD) and observe the parabolic rally going into December. It too suffered a sharp drop straight back down when momentum died out.
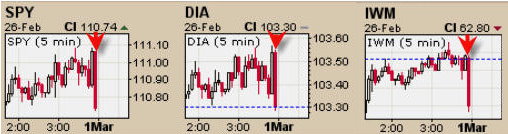
Stock Indexes – SP500, Dow Jones, Russell 2000
Last week the market sold down the first half of the week, then bounced back up forming a possible pivot low. The daily chart for these indexes look virtually the same as the GLD, SLV and USO charts above for the past 5 trading sessions.
But, one little thing has me concerned….
When looking at the 5 minute intraday charts (posted below) you can see at the very last minute before the market closed HUGE selling volume flooded the ETFs. The market ended up losing all of its gain for the day.
With any luck this was just end-of-the-month hedge, mutual fund, etc. portfolio rebalancing. But I am somewhat concerned that more of this selling could step back into the market Monday or Tuesday.
Weekend Trading Conclusion:
Overall, last week started on a negative note but ended strong after forming a reversal pattern.
It looks as though stocks and commodities have formed an ABC retrace pattern and are now ready to move higher.
How much higher you ask?
Well, I believe 2010 is going to be a traders market. I envision an 8-12 month sideways consolidation (large bull flag) forming. If this materializes then buying on over sold dips, as we did on Feb 5th, and scaling out on strength at resistance levels will be our goal in the coming months.
A bunch of 4-8% trades is what I’m figuring, but with leveraged etfs we can double and triple those type of returns. Now that is something to anticipate with delighted optimism!
If you would like to receive my free weekly trading reports please visit TheGoldAndOilGuy at: www.TheTechnicalTraders.com
Chris Vermeulen
My goal is to provide you with an unparalleled trading newsletter complete with charts, trading alerts, trading education and email support. Unlike other investing newsletters, I’m a one man show. That’s because I don’t want some hired hand giving you advice while I take it easy on a beach somewhere. You ALWAYS get precise, valuable information DIRECTLY from ME.
I truly believe this is the perfect trading service for active traders who want a conservative yet highly profitable trading strategy. The GLD Gold exchange traded fund allows for very accurate signals when used along with the price of gold, HUI, USD, bullish percent charts and gold stocks. I also focus on Oil, Silver, Index & Sector ETFs when opportunities present them selves. When these different investments are used in conjunction with technical analysis and my proven trading strategy, trades become very CLEAR and SIMPLE to execute. My trading strategy eliminates your emotions and makes trading extremely accurate with very little
-
I know Mike is a very solid investor and respect his opinions very much. So if he says pay attention to this or that - I will.
~ Dale G.
-
I've started managing my own investments so view Michael's site as a one-stop shop from which to get information and perspectives.
~ Dave E.
-
Michael offers easy reading, honest, common sense information that anyone can use in a practical manner.
~ der_al.
-
A sane voice in a scrambled investment world.
~ Ed R.
Inside Edge Pro Contributors

Greg Weldon

Josef Schachter

Tyler Bollhorn

Ryan Irvine

Paul Beattie

Martin Straith

Patrick Ceresna

Mark Leibovit

James Thorne

Victor Adair