
Daily Updates
Match the Strategy to the Market
Stockscores.com Perspectives for the week ending March 14, 2010
In this week’s issue:
Weekly Commentary
Strategy of the Week
Stocks That Meet The Featured Strategy
![]()
Investors all seem to be searching for that magic formula that will pick out the next winning trade. This quest can seem futile; something that works great one day can lead to total failure on another. Is it the rules that are the problem or is it how they are applied?
Some have a set of rules that they apply when market conditions are right and they find great success. But, when market conditions change and the trend is no longer in their favor, the winners stop coming and they give back all of their gains. In this way, the trader makes a false correlation between their rules and the results. Throwing darts at a board works well in a bull market but when the trend reverses, even the smartest of buyers can lose money.


Others will back test a set of rules and find their winning formula, only to lose money when they apply the rules on actual trades. They struggle to understand how a set of trading rules that worked so well during their testing period fails when they put money on the line.
Although the stock market is located in the same place every day and opens and closes at the same time, smart traders realize that the market can be completely different from one day to the next. This means that it is always smart to start your analysis with an understanding of market conditions. The strategies you choose should evolve out of this understanding and, in keeping with the top down analytical approach, the stocks you finally pick to trade will fall out of the appropriate strategies.
Here is how I approach each trade that I make.
First, I work to understand the market in general. You have to trade the market you have, not the one you wish you could have. I first look at the charts of the Dow, Nasdaq, TSX and TSX venture and ask a simple question, “Who is in control of the market?” I then ask, “Is control likely to change soon?”
Looking at the trend will answer the first question quite easily. If the chart shows falling tops, then the sellers are in control. The buyers are in control if there are rising bottoms. The second question requires a bit more charting knowledge, but it still not that difficult. Trends tend to reverse at major areas of support and resistance. So, a market that is rallying in to a multi year high will probably find some selling pressure soon, and therefore, the trend is likely to reverse. A market that has run away from its trend line is trading with emotion that will likely be rationalized eventually, and we can expect the market to pull back to the trend line. A market that is breaking a trend line may also be setting up for a reversal.
Once I get an understanding of the overall market, I then look to the industry sector groups to see where the money is flowing. I prefer to look at the industry ETFs as they are something that I can buy or sell easily and the charts tend to be better to read than the index charts
With this analysis done, I will now have a good understanding of what is driving the market and where the opportunities are likely to be found. I can now pick filtering strategies that are appropriate for the market conditions.
A market that the buyers have been in control of for some time but is coming in to long term resistance is likely to top out soon. Applying the Reversal of Fortune Strategy is a good way to look for short opportunities in this situation.
If the market is in buyer control but appears to have lots of upside potential still, the Stockscores Simple will find good trading opportunities.
A market that has been falling sharply will bounce around support, so as the market nears support, considering the Hitting Floors strategy is smart.
The Strategy Timing chapter in the StockSchool Pro course goes in to this in more detail.
I have seen many traders make money over a few months and then give it all back when conditions change. They failed to realize that you have to trade the market you have, and that means adjusting your strategy for market conditions. Trading is simple when you have the right strategy, but remember that the right strategy is always changing. So too, must you.
![]()
The markets have been very strong for the past five weeks and are due for a round of profit taking. I expect that this profit taking may begin next week, particularly in Financial and Retail stocks which have gone up very quickly in a short period of time. However, we should consider a pull back in the market an opportunity to enter in anticipation of a longer term upward trend.
The strength in Financial and Retail stocks is a good indication that the economy is getting better. The banking system problems are what started this recession and that hurt consumers. Improving bank stocks means the root cause of economic weakness are improving and if consumers are starting to spend again then the psychology is improving.
I went through a lot of the sector ETFs using the Stockscores Trading Desk. You can do this too as I have saved these groups of ETFs for everyone to look at. To do so, log in at http://tradingdesk.stockscores.com and go to the Chart Watch section. The list of Sectors that I have created is in the right sidebar.
If you are a conservative, long term investor, a few ETFs that I think are worth considering are shown below. Ideally, you will enter in the next few weeks on a pull back if one occurs but it is alright to begin building these positions now. These picks are based mainly on the long term weekly charts which are improving
![]()
1. XLF
XLF gave a strong sign that it will start a pull back early next week but the long term chart is very good. Swing traders may want to play it from the short side next week but after some profit taking I expect that the longer term upward trend will resume so buyers should look at a pull back as an opportunity to buy this sector at a better price. Long term support on this chart$14.30, I think a pull back to $15 is quite possible.
2. XHB
The home building stocks are improving and the XHB ETF is trading through resistance that has held up since September of 2009. The rising bottoms on the chart are a sign of optimism, I consider this ETF good so long as it can stay above $15.25.
Click HERE if you want to learn from some of the timeless advice from some of worlds best traders including the very successful Tyler Bollhorn.

References
Get the Stockscore on any of over 20,000 North American stocks.
Background on the theories used by Stockscores.
Strategies that can help you find new opportunities.
Scan the market using extensive filter criteria.
Build a portfolio of stocks and view a slide show of their charts.
See which sectors are leading the market, and their components.
Tyler Bollhorn started trading the stock market with $3,000 in capital, some borrowed from his credit card, when he was just 19 years old. As he worked through the Business program at the University of Calgary, he constantly followed the market and traded stocks. Upon graduation, he could not shake his addiction to the market, and so he continued to trade and study the market by day, while working as a DJ at night. From his 600 square foot basement suite that he shared with his brother, Mr. Bollhorn pursued his dream of making his living buying and selling stocks.
Slowly, he began to learn how the market works, and more importantly, how to consistently make money from it. He realized that the stock market is not fair, and that a small group of people make most of the money while the general public suffers. Eventually, he found some of the key ingredients to success, and turned $30,000 in to half a million dollars in only 3 months. His career as a stock trader had finally flourished.
Much of Mr Bollhorn’s work was pioneering, so he had to create his own tools to identify opportunities. With a vision of making the research process simpler and more effective, he created the Stockscores Approach to trading, and partnered with Stockgroup in the creation of the Stockscores.com web site. He found that he enjoyed teaching others how the market works almost as much as trading it, and he has since taught hundreds of traders how to apply the Stockscores Approach to the market.
Disclaimer
This is not an investment advisory, and should not be used to make investment decisions. Information in Stockscores Perspectives is often opinionated and should be considered for information purposes only. No stock exchange anywhere has approved or disapproved of the information contained herein. There is no express or implied solicitation to buy or sell securities. The writers and editors of Perspectives may have positions in the stocks discussed above and may trade in the stocks mentioned. Don’t consider buying or selling any stock without conducting your own due diligence.
Technical View of What’s Next for Precious Metals, Stocks & the Dollar
March 14, 2010
Last weeks price action unfolded just as we expected. Money poured into stocks with the focus being on small cap, banks and technology stocks. The fact that these sectors are showing strength while utilities, health care and consumer staples lag is a good sign that investors are once again taking risks in the market.
Because investors and traders are bullish on the stock market again the money flow into the safe havens like Gold and Silver decrease. I believe this is the reason stocks moved up last week while precious metals drifted lower.
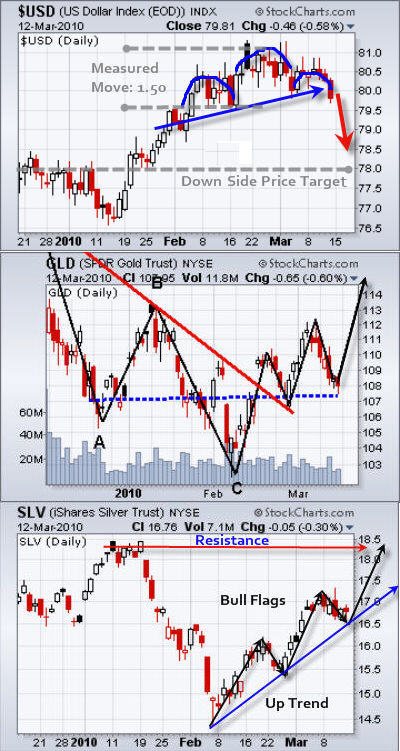
Below are three charts (Dollar, Gold and Silver) showing what I think is most likely to happen in the coming week or two.
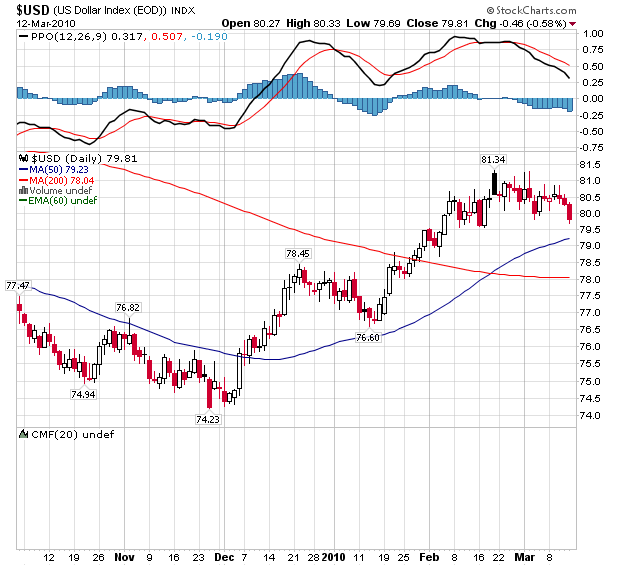
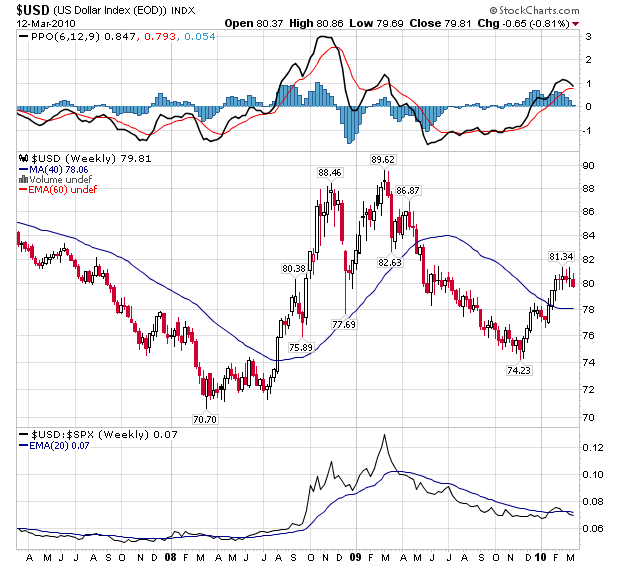
US Dollar Index – Daily Chart
The US Dollar has put in a very nice bounce/rally since the low in November 2009. Last month the dollar finally reached a key resistance level of 81. I have been talking about this major resistance level since January as the Dollar would find it difficult to break above this level.
Take a look at the daily chart below. You can see a head & shoulders pattern and a neckline which appears to have broken late Friday afternoon. There is a strong chance we could see 78 reached which is the measured move down. If we get follow through selling this week then I would expect 78 to be touched within 5-10 days.
GLD & SLV ETF Trading Charts
Precious metals have been moving very well for us recently. From looking at the charts using technical analysis we were able to catch the Feb. 5th low and also the Feb. 25th low on a several ETF’s.
As you can see from the GLD and SLV charts, both metals are not in an uptrend showing bullish chart patterns and trading at support. If we see the US Dollar break down next week then be ready to go long gold, silver and stocks.
Precious Metals, Stocks and the Dollar Trading Conclusion:
As a technical analyst the above charts are pointing to higher prices in the coming day’s which is exciting for us all. BUT when things are this perfect looking we must be very cautious as the market has way to suck people into setups like this and spit them out a couple days later for a nasty loss.
Understanding how the market moves is crucial for avoiding and/or minimizing losses when trades go against us. That is why I continue to wait for my signature low risk setup before putting any money to work.
My focus is to take the least amount of trades possible each year, only focusing on the best of the best setups. My low risk setups require downside risk to be under 3% for the investment of choice when the broad market shows signs of strength, as well. I use several different types of analysis to confirm if a setup has a high probability of winning and those which do are the trades I take along with my subscribers.
It is very important to wait for the market to confirm a move higher before taking a position with this type of setup. The market could go either way quickly and jumping the gun is not a safe bet.
Get My Precious Metals and Index ETF Trading Alerts: www.TheGoldAndOilGuy.com
Chris Vermeulen
Sign up for Chris’s free Technical Trading Charts HERE (email entry down on the lower right)
Chris Vermeulen is the founder of TheGoldAndOilGuy newsletter. “My goal is to provide you with an unparalleled trading newsletter complete with charts, trading alerts, trading education and email support. Unlike other investing newsletters, I’m a one man show. That’s because I don’t want some hired hand giving you advice while I take it easy on a beach somewhere. You ALWAYS get precise, valuable information DIRECTLY from ME.”
Since last November, the dollar has climbed steadily against a basket of currencies — most notably against the euro. And based on my analysis, I think it’s just the early stages of this trend.
In fact, for many of the reasons I’ve discussed in past Money and Markets columns, the weight of evidence suggests that we’ve likely seen the bottom in the dollar, with a multi-year bull market ahead.
That’s a high level view. But how are things shaping up on a shorter term outlook for the buck?
Let’s take a look at the four stages of this prospective dollar bull market and the immediate catalysts that should underpin its continued strength …
Stage 1:
Marking the Bottom
My analysis of the seven-year cycles in the dollar index suggests a cyclical bottom was marked when the dollar rallied sharply off of its all-time lows in 2008 driven by the uncertainty surrounding a growing financial and economic crisis.
Back then, capital fled all areas of the world in search of safety. And the dollar represented a safe parking place.
Stage 2:
Retracement Period
Then we had the deep retracement of 2009. The global economy was showing signs of stabilization that encouraged global investors to start dipping their toes back in the water … i.e. taking risk again. That’s when capital was reversed out of the dollar in search of higher risk, higher return assets.
And just when sentiment was about as negative toward the dollar as it could possibly get, we were introduced to the first sign of collateral damage from the financial/economic crisis and the unprecedented government responses: Crumbling government finances.
The first wobbling sovereign nation, Dubai, quickly splashed water on the face of an increasingly optimistic global investment community. All of the sudden the theories of a V-shaped recovery became fractured by the realization that the widespread economic crisis could run deeper — a scenario that many had conveniently and complacently dismissed.
Stage 3:
More Fear; More Risk Aversion
In recent months much of the dollar strength has been driven by fears of a sovereign debt crisis. And much of that strength has come at the expense of the euro and the British pound.
We’ve seen the dominos of a potential sovereign debt crisis line up, as I detailed in last week’s column. The tremors that started in Dubai, quickly turned scrutiny toward Greece and the other weak spots in the euro zone (Portugal, Italy, Ireland and Spain). And it appears increasingly likely to soon weigh on the UK economy and the British pound.
As we know, currencies don’t operate in a vacuum. They’re valued relative to the value of another currency. So, given the recent concerns about the future of the euro and the increasing spotlight on the next sovereign debt domino, the UK, the dollar is benefiting primarily because of the weakness of other major currencies.
And there’s another developing situation that should offer more fuel for the dollar …
Stage 4:
A Falling Yen
The euro, the British pound and the Japanese yen make up 83 percent of the dollar index, the often quoted proxy for the economic firepower of the U.S. dollar on a global level.
While the pound and the euro have been under assault in recent weeks, the yen has been pushed and pulled in a tug of war: Strengthening as capital flows out of risky euro/yen and pound/yen positions, and weakening on the basis of fundamental divergences between the recovering U.S. economy and the deflation-burdened Japanese economy.
But the fundamental evidence has been clearly favoring the dollar relative to the yen for some time. What’s been lacking is a catalyst to send it higher.
Well, over the past two weeks we’ve finally gotten a clear catalyst to sell the yen against the dollar.
Catalyst for Yen Weakness
Back in August 2009, it became cheaper to borrow dollars (compared to borrowing yen) for the first time in sixteen years. In the chart below, you can see when the short-term interbank borrowing rate for dollars (Dollar Libor, the blue line) crossed below the equivalent interbank borrowing rate for yen (Yen Libor, the red line).

What looks like a minor rate differential can have a major impact on market perception. Since that cross occurred, the dollar lost as much as 13 percent against the yen as global investors began favoring dollars, as opposed to yen, to fund carry trades … i.e. selling dollars to fund the purchase of high yielding currencies.
But as of last week, this differential has crossed back, once again making the Japanese yen the cheapest currency in the world to borrow. And based on the diverging policy paths of the U.S. and Japanese central banks, this differential should continue to widen in favor of U.S. rates and dollar strength relative to the yen.
So given the ongoing crisis surrounding the euro, the vulnerability of the British pound from a continued spread of sovereign debt concerns AND the catalyst for a weakening yen, I’m expecting the dollar to continue its upward path against major currencies both in the short-term and longer-term.
Regards,
Bryan
This investment news is brought to you by Money and Markets. Money and Markets is a free daily investment newsletter from Martin D. Weiss and Weiss Research analysts offering the latest investing news and financial insights for the stock market, including tips and advice on investing in gold, energy and oil. Dr. Weiss is a leader in the fields of investing, interest rates, financial safety and economic forecasting. To view archives or subscribe, visit http://www.moneyandmarkets.com.
Market Buzz – Neo” Materials Has Been “The One”
While Toronto’s main index really did little more than tread water on the week, its 34.12 point gain on Friday helped it close above the 12,000 mark for the first time in about a year. In fact, the last time the S&P/TSX Composite index closed above 12,000 was September 26, 2008, at time when stock markets the world over were tumbling as the financial crisis moved into high gear.
All told, the TSX ended up a meager 38 points on the week, as investors digested what was a sharp 3 per cent gain in the preceding week powered by stronger commodity pricing and better-than-expected earnings from the big banks.
In contrast to the U.S., there was some decent news on the Canadian job front this past week as Statistics Canada said 21,000 jobs were created last month, better than the 15,000 that had been expected by many economists, while the unemployment rate fell by one percentage point to 8.2 per cent from 8.3 per cent.
This past week, Neo Material Technologies Inc. (NEM:TSX), a company we recommended 15-months ago in December of 2008, reported solid turn-around results for 2009. The stock, which was then trading in the $1.30 range, has had a meteoric rise and closed this past Friday at $4.50, up over 245 per cent.
Neo Material is a producer, processor, and developer of neodymium-iron-boron magnetic powders, rare earths, and zirconium based engineered materials and applications, and other high value niche metals and their compounds. Rare earth and zirconium applications include catalytic converters, computers, television display panels, optical lenses, mobile phones, and electronic chips. Products from the company’s newly acquired Recapture Metals Limited are primarily used in the wireless, LED, flat panel, solar, and catalyst industries.
For the year ended Dec. 31, 2009, the company reported revenues of $187.5-million and net income of $19.7-million, or $0.17 per share on a basic and fully diluted basis. EBITDA for the year was $35.1-million. This compares with 2008 revenues of $266.6-million, net income of $23.3-million, or $0.22 per share on a basic and fully diluted basis, and EBITDA of $48.8-million. The decrease in the full-year revenues, EBITDA and net earnings is due primarily to a slowdown in demand for the company’s products in light of the global economic contraction, which commenced in the fourth quarter of 2008 and lasted well into 2009.
At Dec. 31, 2009, the company had a record $57.3-million in cash. Long-term debt was nil as at Dec. 31, 2009, and Dec. 31, 2008.
Looniversity – What’s in a Beta?
How much volatility can you expect from a given stock? That’s well worth knowing if you want to avoid being shocked into panic selling after buying it – which, particularly in the volatile small-cap segment, is a good thing. Some stocks trend upward with all the consistency of a firefly. Others are much steadier. Beta is what academics call the calculation used to quantify that volatility.
The beta figure compares the stock’s volatility to that of the S&P 500 index using the returns over the past five years. If a stock has a beta of 1, for instance, it means that over the past 60 months its price has gained 10% every time the S&P 500 has moved up 10%. It has also declined 10% on average when the S&P declines the same amount. In other words, the price tends to move in synch with the S&P and it is considered a relatively steady stock.
The more risky a stock is, the more its beta moves upward. A figure of 2.5 means a gain or loss of 25 per cent every time the S&P gains or losses just 10 per cent. Likewise, a beta of 0.7 means the stock moves just 7 per cent when the index moves in either direction. A low-beta stock will protect you in a general downturn; a high Beta means the potential for outsize rewards in an upturn.
Of course, that’s how it’s supposed to work in theory. In practice, unfortunately, past behaviour offers no guarantees about the future. If a company’s prospects change for better or worse, then its beta is likely to change too. So, use the figure as a guide to a stock’s tendencies, not as your own personal “Kreskin.”
Put it to Us?
Q. I own shares in a company that recently sent me a package with an offer to purchase more shares through a private placement. The new shares come with warrants attached. What are warrants?
– Yazmine Erikson; Toronto, Ontario
A. While most of the “warrants” associated with the stock market of late have called for an immediate arrest, we are happy to inform you that does not apply in your case. Strictly defined, a warrant is a security entitling the holder to buy a proportionate amount of stock at some specified future date at a specified price, usually one higher than current market price. In the market, warrants are traded as securities whose price reflects the value of the underlying stock.
Corporations often bundle warrants with another class of security (i.e. free trading stock) to “sweeten” or enhance the marketability of the other class. Essentially, warrants are like call options; however, warrants are issued and guaranteed by the company, whereas options are exchange instruments and not issued by the company. Also, the lifetime of a warrant is often measured in years, while the lifetime of a typical option is months.
KeyStone’s Latest Reports Section
- IP Company Post Solid Q3, Solid Fundamentals, Strong Cash Position & Yields 4.17%, But 50% Share Gains Prompt Near-Term Rating Change (Flash Update)
- Canadian Infrastructure Stock Posts Strong 2009, Shares up Over 71%, But Strong Cash Position & Relative Fundamental (PE of 10) Allow Us to Maintain BUY Rating Long term (Flash Update)
- Canada’s Largest Facilities Maintenance Company Posts Strong 2009 Results, 25% Gain Prompts Near-term Ratings Change, Long-term Remains the Same (Flash Update)
- Pure Play Chinese Construction Company, Strong EPS Growth, Growing Backlog, PE of under 8 – Initiate Coverage with BUY (Flash Update)
- Micro-Cap Environmental Company Generates 7 cents in Earnings for 2009; Trades At $0.32 with $3.2 Million in Cash, No Long-Term Debt and Good Prospects for Growth in 2010 and Beyond (Flash Update)
By late 2009, as the U.S. dollar flirted with multi-year lows against most foreign currencies, big investment players crowded into trades that shorted the greenback. Commentators noted that the anti-dollar momentum had taken on a life of its own and that the trade had become too crowded. It is true that markets have a nasty tendency to move against the crowd. When a lot of traders agree on a particular trade, it’s more likely that in the short-run the opposite trade will be a winner.
Charts inserted by Money Talks (commentary continues below)
 The 2008 “flight to safety” rally of the U.S. dollar was a once in a lifetime event that presented huge opportunities for aggressive currency traders. By December 2008, after rallying 25% over the previous five months, the dollar topped out. However, there were many speculators who had come somewhat late to the party, as well as many others who had ridden the dollar up and were thus sitting on huge unrealized gains.
Those technical reasons, combined with the re-emergence of strong growth in emerging markets and solid earnings from overseas companies, redirected investment flows away from the dollar. 2009 became a year of dollar weakness, with the buck giving back nearly all of its gains. At that point, most people made the reasonable conclusion that the decline would continue.
As is often the case, an unforeseen event came along that made mincemeat out of the consensus’ well-conceived strategy. Once some fiscal squabbling grabbed headlines in the eurozone, the negative sentiment that had built up on the dollar was suddenly diverted to the euro. Catalyzed by the Greek debt crisis, the greenback surged by about 8% in six weeks.
From a technical standpoint, the short dollar trade of late 2009 was too crowded; but from a fundamental standpoint, I don’t think it was crowded enough. As with stocks, there can be no long-term substitute to examining a government’s fundamentals to determine its currency’s worth. Based on the fundamentals, far too many investors remain far too confident about the greenback’s underlying viability.
In fact, I do not think I have ever seen so rapid a change in sentiment in my career. The crowd had completely switched sides, with most now betting on the demise of the euro rather than the dollar. This is looking like July 2008 all over again, with the dollar poised to put in over-sized gains. It also presents a good opportunity for those who keep their heads.
In my opinion, the market is now perfectly positioned for a massive dollar sell-off. The fundamentals for the dollar in 2010 are so much worse than they were in 2008 that it is hard to imagine a reason for people to keep buying once a modicum of political and monetary stability can be restored in Europe. In fact, the euro has recently stabilized.
My gut is that the dollar sell-off will be sharp and swift. Once the dollar decisively breaks below last year’s lows, many of the traders who jumped ship in the recent rally will look to re-establish their positions. This will accelerate the dollar’s descent and refocus everyone’s attention back on the financial train-wreck unfolding in the United States.
Any doubts about the future of the U.S. dollar should be laid to rest by today’s announcement that San Francisco Federal Reserve President Janet Yellen has been nominated to be Vice Chair of the Fed’s Board of Governors, and thereby a voter on the interest rate-setting, seven-member Open Markets Committee. Ms. Yellen has earned a reputation for being one of the biggest inflation doves among the Fed’s top players.
Looking for an ally to paper over the administration’s gaping fiscal holes, it is not surprising that president Obama made this selection. Yellen has consistently downplayed the dangers of inflation and has made statements that indicate she views the Fed as an extension of the Labor Department, rather than a guardian of our currency. Last month, in discussing what she saw as the Fed’s obligation to promote employment, she said, “If it were possible to take interest rates into negative territory, I would be voting for that.” She may very well make Chairman Bernanke look like a tightwad by comparison.
It is anyone’s guess which sparks will be responsible for igniting the falling dollar powder keg. From a trader’s perspective, a sharp reversal in the dollar will catch many investors completely off guard. Those who stepped off the short-dollar train will be stuck on the platform as it speeds away. Those who refused to give up their seats are in for a hell of a ride.
Peter Schiff, the Euro Pacific firm’s president, and a renowned pioneer in the field of international investing for individual investors, leads a team of investment professionals and support staff dedicated to the highest levels of customer service, a team literally searching the world over for valuable investment opportunities.
Founded in 1980 and headquartered in Westport, Connecticut, Euro Pacific is a full service, FINRA-registered broker/dealer that has historically been recognized for its expertise in foreign markets and securities. Through its direct relationships with countless foreign trading desks, the firm’s clients are able to avoid the large spreads often imposed by domestic market makers of foreign securities, thereby substantially reducing overall transaction costs. See The Euro Pacific Advantage
Though we offer access to all U.S. stocks and bonds, and are certainly knowledgeable in domestic investments, we specialize in international securities. By trading foreign stocks and bonds through Euro Pacific Capital, individual investors can benefit from our extensive experience in this highly specialized area. Euro Pacific Capital’s clients gain access to foreign markets which are out of reach for most individual investors trading through traditional brokerage firms. With Euro Pacific’s guidance, buying foreign stocks and bonds, and building a truly global portfolio, has never been easier. Let us put our experience to work for you.
Euro Pacific Capital does not engage in any market making activities, thus the firm’s individual and corporate clients can be assured that any recommendations given are free from the various conflicts of interest so prevalent among Wall Street brokerage firms.
-
I know Mike is a very solid investor and respect his opinions very much. So if he says pay attention to this or that - I will.
~ Dale G.
-
I've started managing my own investments so view Michael's site as a one-stop shop from which to get information and perspectives.
~ Dave E.
-
Michael offers easy reading, honest, common sense information that anyone can use in a practical manner.
~ der_al.
-
A sane voice in a scrambled investment world.
~ Ed R.
Inside Edge Pro Contributors

Greg Weldon

Josef Schachter

Tyler Bollhorn

Ryan Irvine

Paul Beattie

Martin Straith

Patrick Ceresna

Mark Leibovit

James Thorne

Victor Adair