
Daily Updates
Economists to Miss the Next Financial Crisis
03/15/10 Mumbai, India – Beware the Ides of March…and the rest of the year too!
This is the day Caesar was assassinated. What’s it to us?
Well, it just reminds us that things go wrong. Even when you’re on top of the world. There are always countercurrents…undercurrents, beneath the surface, where you don’t see them…plots…conspiracies…and just bad luck.
On the surface, the US economy is recovering. Well, not even. It is stabilizing.
The Dow has been creeping up. It rose 12 points on Friday. Gold fell $6. Oil held at $81.
The most recent figures show the consumer becoming a little freer with his money. But look beneath the surface and you find government statisticians juking and jiving with the numbers. They seasonally adjusted downward the figures for January…which boosted the figures for February. Had they not done so, the figures for February would have been negative!
….read more HERE
Intro from John Mauldin:
Long time readers of Thoughts from the Frontline will be familiar with the name The Liscio Report. It is one of my “secret” sources of high quality analysis on a wide range of topics including taxes, employment and the underpinnings of the economic headlines that we read which can be so distorted. I say secret because they get nowhere near the attention their work deserves. Philippa Dunne & Doug Henwood, authors of The Liscio Report, do actual on the phone conversations with each of the various states on their tax collections, employment and so on. I find their primary research to be invaluable. Their real time proprietary research based on state withholding and sales tax receipts gives their clients a unique insight into the state of the US economy.
I have talked them into letting me send out their most recent letter, which I found very informative. While their work is not inexpensive ($7,500 annually), for hedge funds, banks, proprietary trading desks and those who need to know what is actually happening as opposed to whatever spin is being put out in the press, you should check them out at www.theliscioreport.com.
And before we jump into their report, I feel the need to comment on the revelations this last week about Lehman and what looks like can only be called fraud. How much more of this is going on? Regulators now have a road map to know what to look for. Auditors are now on notice that this lack of transparency and cooking the books at quarter’s end must not be condoned.
And while we re on the topic of transparency, for God’s sake, can’t we get credit default swaps on an exchange before they blow us all up again? Please? Someone? Anyone? It’s been two years. It’s what brought Bear and Lehman down. Bluntly, the reason the banks oppose this is that the commissions for an OTC credit default swap are astronomical when compared to what will become a $10 commission on an exchange.
OK, I’ll now stop my rant, and allow you to enjoy The Liscio Report. Have a great week.
John Mauldin, Editor
Outside the Box
Revenues stabilizing, though it helps to be rich
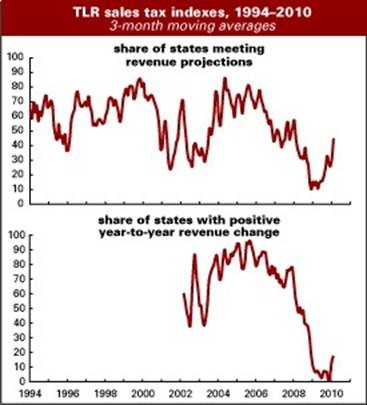
In February, 56% of the states in our survey met or exceeded their forecasted sales tax collections, up from 50% in January, and 13% reported positive collections over the year, down from 30% in January. Our intensity index, over-the-year rate of change weighted by state population, was –2.33%, about even with January’s –2.28%, and the aggregated divergence from forecast held in the positive range at 0.26%, down a bit from January’s 0.5%.
Both of the two last measures are showing real improvement: the over-the-year change, although still negative, is well off its record-setting lows (see below) and the divergence from forecast, with a few small exceptions, hasn’t been positive since the fall of 2006.
For the various geographic regions, the good news is generally of a muted variety, and uneven no matter how you break them up. The best results came from states with large investment banking sectors–a few were both positive over the year and above forecast, one quite substantially so. The housing-bubble states without such sectors are slowly clawing back in the long, slow haul they anticipated, with one actually beating forecast by a hair.
The Midwestern manufacturing states continue to report mixed results. One reported the strongest year-over-year gains in the survey, and our contact there believes the relative stability of the major auto-makers is allowing “those who have jobs” to spend a bit more freely. Other states in the region did not do so well, but continue to report a stabilizing trend.
Greatest impatience was expressed by revenue officials around the country in smaller states with mixed economies. They expect to see revenues now moving into positive territory and another month of disappointing results is hard to take.
affluent tightwads
For the last two years, Gallup has been asking 1,000 Americans every day how much they’ve been spending at stores, restaurants, gas stations, and online. The average for upper-income households–those with incomes above $90,000–in February plunged to a new low of $98, down 13% from January. The numbers aren’t seasonally adjusted, so the monthly changes have to be taken with a grain of salt, but the yearly change is a sharp –19%.
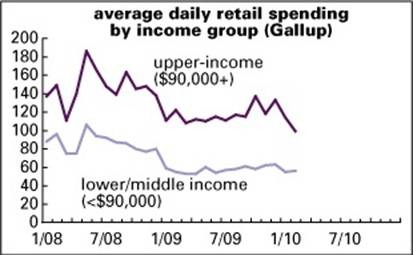
By contrast, spending by middle- and lower-income households has been more or less flat for a year. Both are way off their May 2008 peaks–down by almost half for both groups.
As Gallup’s chief economist, Dennis Jacobe, pointed out in reporting these results on Wednesday, the retail economy badly needs freer spending by the well-off. That’s where most of the discretionary juice is; households of more modest means just don’t have the money to ramp up spending beyond the level of basics.
Jacobe attributes this tight-fistedness to “the new normal”–a general cautiousness born of economic uncertainty. Upper-income households are much less exposed to the vagaries of the job market than middle- and lower-income ones. For example, as a study by the Center for Labor Market Studies at Northeastern University reported in February, at the end of 2009, the average unemployment rate for the upper fifth of the income distribution was 2%; for the middle fifth, it was 6%; and for the bottom fifth, it was 19%.
the new normal
It’s not just Gallup that’s talking about a new regime of lower spending. In a new joint report, the consulting firms Kantar Retail and Price Waterhouse Coopers declare that “an enduring shift has taken place as a result of the Great Recession.” Conspicuous consumption will give way to a more mindful sort of spending, and “rampant deal-seeking will be replaced by more purchases selectivity.” Over the near future, people will apply the tools and consciousness they learned during the recession even as the economy recovers. Shoppers will put more effort into buying. Gone are the days of recreational browsing and impulse buying; shoppers will plan their purchases more, making lists and Googling for deals. There will be a stigma attached to wasteful spending–and purveyors of luxury goods will have to content themselves by selling to the actually rich alone, without any help from the aspirationally affluent. “Good enough” will take the place of the very best. The mix of goods may change. As Boomers approach retirement, they’ll spend less and save more, ceding the cyclical lead to Gens X and Y–which means a bigger role for high-tech gadgetry. But overall spending is likely to remain muted.
Or so they say. The older among us, or the subset of those with still-intact memories, will recall that similar things were said in the early 1990s, when private labels and generic goods were all the rage. That trend faded as the job market recovered, the stock market bubble got going, and the former Chevy driver eventually just had to have an Escalade. Still, this sobriety is likely to be with us for some time–at least until the job market seriously recovers.
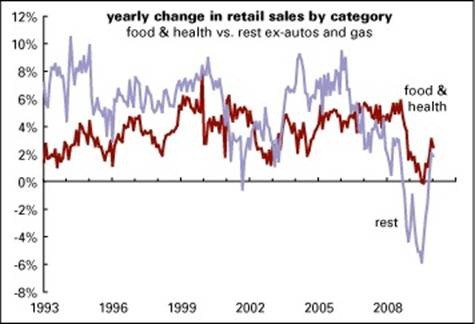
That said, spending on nonessentials has been recovering in recent months. Its growth rate is still lagging that of essentials, but the gap is closing. That’s to be expected, but a return to 2006 certainly isn’t.
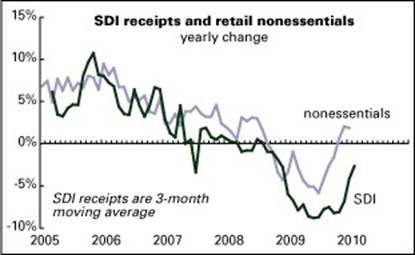
By the way, as the graph below shows, the yearly change in sales tax collections in the SDI’s universe correlates very nicely with movements in spending on nonessentials (r=0.87). This makes sense, since so many essentials are exempt from sales tax, but it’s always gratifying when you can confirm good sense empirically.
Is this recovery secretly strong?
Every now and then you hear respectable analysts claiming that this recovery is stronger than anyone knows, or admits, or wants to contemplate. Rodney Dangerfield, who couldn’t get no respect, is invoked in support of this claim.
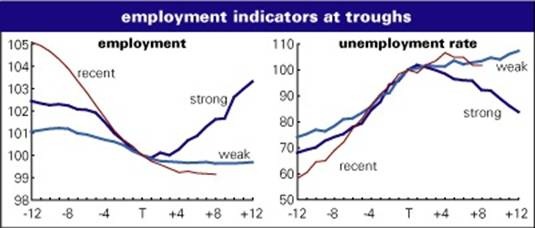
We wish we could find something this encouraging in the data. To take the measure of the recovery, we’ve put together four cycle graphs, showing the behavior of some important indicators for the year before and after business cycle troughs. In all but one case (more on that one in a bit), values are indexed so that the trough month = 100. (We’re assuming that the trough of the recent recession was in June 2009.) But instead of the usual recovery average, which blends together all upturns since the end of World War II (and which is how we’ve done this exercise most times in the past), we’ve done two averages–one representing the weak recoveries of 1991–1992 and 2001–2002, and the other, the strong recoveries of 1975–1976 and 1982–1983.
Graphed below are payroll employment and the unemployment rate. The recent trajectory of both measures is a lot closer to the “weak” line than the “strong.” Employment is actually weaker than the “weak.” In fact, if employment were hugging the “weak” line, there’d be over 600,000 more jobs in the economy than there were in February. If it were following the “strong” path, there’d be 3.2 million more jobs. Unemployment is close to the “weak” line; if it were following the “strong” path, the jobless rate would be a full point lower than it was in February.
Of course, the job market is only one part of the economic picture–though it’s a very important part. What about the broad business cycle indexes? These have the virtue of giving a composite picture of all the economy’s major aspects–and using them is a nice check on the temptation to cherry-pick data to prove the point you want to prove.
Two of those composite indexes are graphed below–the Conference Board’s coincident index and the Chicago Fed’s National Activity Index (CFNAI). The Conference Board index, after having fallen hard in the recession (like the employment indicators), is almost a dead-ringer for the “weak” line.
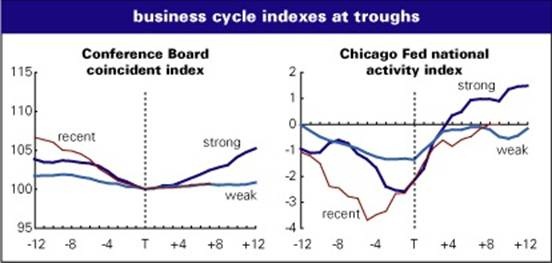
The CFNAI is the only one of these indicators that isn’t indexed so that the trough month is set to 100. The reason for that is that the index itself is normalized over time so that its long-term average is 0, which is also the economy’s long-term trend growth rate. Any value above 0 is over trend; any under 0, under trend. A value of 1 is a standard deviation above average. Values above .70 are thought to be where the economy is running far enough above trend that inflation is a worry. Historically, the CFNAI has proven to be a good real-time measure of the state of the business cycle.
Here too, we’re much closer to “weak” than “strong”–and still below 0. Seven months into a strong recovery, the CNFAI has averaged 1.0–meaning that we’re more than a standard deviation below a strong recovery’s reading.
So, no, this is not a Rodney Dangerfield recovery. Maybe it will become one–but we doubt that the markets will be inclined to badmouth the strength of the thing in the coming months.
Philippa Dunne & Doug Henwood
Disclaimer
John Mauldin is president of Millennium Wave Advisors, LLC, a registered investment advisor. All material presented herein is believed to be reliable but we cannot attest to its accuracy. Investment recommendations may change and readers are urged to check with their investment counselors before making any investment decisions.
Opinions expressed in these reports may change without prior notice. John Mauldin and/or the staffs at Millennium Wave Advisors, LLC and InvestorsInsight Publishing, Inc. (InvestorsInsight) may or may not have investments in any funds, programs or companies cited above.
PAST RESULTS ARE NOT INDICATIVE OF FUTURE RESULTS. THERE IS RISK OF LOSS AS WELL AS THE OPPORTUNITY FOR GAIN WHEN INVESTING IN MANAGED FUNDS. WHEN CONSIDERING ALTERNATIVE INVESTMENTS, INCLUDING HEDGE FUNDS, YOU SHOULD CONSIDER VARIOUS RISKS INCLUDING THE FACT THAT SOME PRODUCTS: OFTEN ENGAGE IN LEVERAGING AND OTHER SPECULATIVE INVESTMENT PRACTICES THAT MAY INCREASE THE RISK OF INVESTMENT LOSS, CAN BE ILLIQUID, ARE NOT REQUIRED TO PROVIDE PERIODIC PRICING OR VALUATION INFORMATION TO INVESTORS, MAY INVOLVE COMPLEX TAX STRUCTURES AND DELAYS IN DISTRIBUTING IMPORTANT TAX INFORMATION, ARE NOT SUBJECT TO THE SAME REGULATORY REQUIREMENTS AS MUTUAL FUNDS, OFTEN CHARGE HIGH FEES, AND IN MANY CASES THE UNDERLYING INVESTMENTS ARE NOT TRANSPARENT AND ARE KNOWN ONLY TO THE INVESTMENT MANAGER.
Communications from InvestorsInsight are intended solely for informational purposes. Statements made by various authors, advertisers, sponsors and other contributors do not necessarily reflect the opinions of InvestorsInsight, and should not be construed as an endorsement by InvestorsInsight, either expressed or implied. InvestorsInsight is not responsible for typographic errors or other inaccuracies in the content. We believe the information contained herein to be accurate and reliable. However, errors may occasionally occur. Therefore, all information and materials are provided “AS IS” without any warranty of any kind. Past results are not indicative of future results.
We have been HARD on Japan over the last two decades of publishing macro- market research … calling it the “Land of the Rising Deflation”, and riding the multi-decade long “Deflation Tsunami” … years before the dreaded d- word (deflation) was at all considered “acceptable” lingo in “proper circles”.
The occasions upon which we have been “bullish” on Japan, from either a macro-perspective, or a market-angle … have been few and far between.
With that in mind, we note that the Land of the Rising Sun may be on the cusp of experiencing a “Sunshine Daydream”, to borrow a lyric from the Grateful Dead, providing a moniker – “dead” — that we could associate with Japan’s macro-market situation since 1990.
Could it be time for a Japanese Sunshine Daydream ???
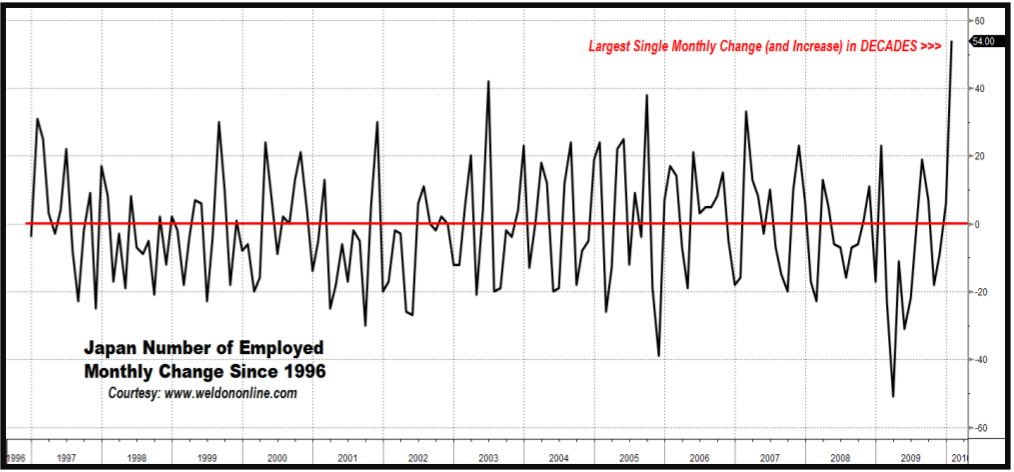
Indeed, the chart below implies that the answer is YES !!!
We shine the spotlight on the month-to-month change in Japanese Employment, revealing that January’s HUGE monthly increase of +540,000 in the number of Employed represents THE HIGHEST single-month job gain in decades, if not ever.
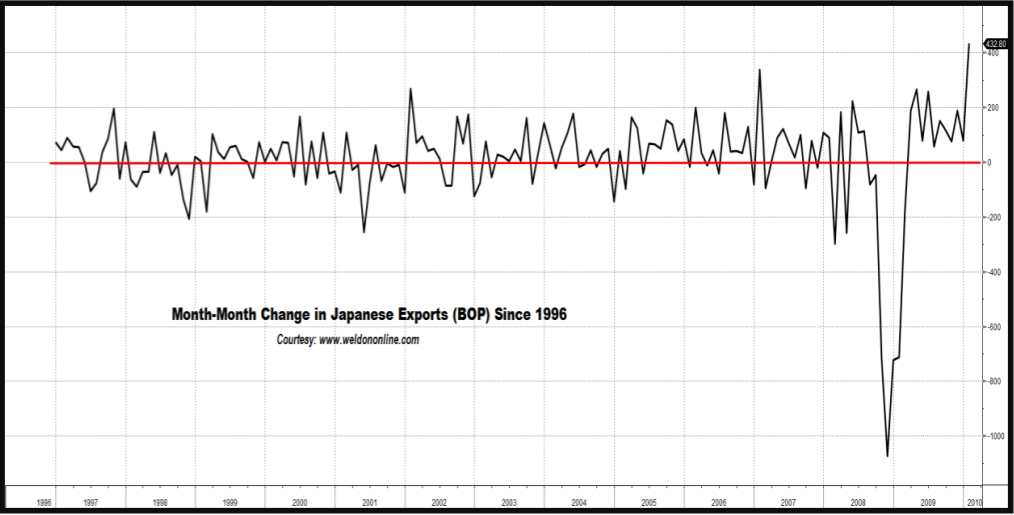
Evidence the chart on display below plotting the month-to-month change in Japanese Exports as reported within the Balance of Payments data (BOP, as opposed to the Merchandise Trade figures) … revealing January’s massive expansion, as the Japanese export machine climbs back from the brink.
This brief comment from the extensive analysis contained in Greg’s 13 page Weldon’s Money Monitor. Michael Campbell calls Greg Weldon – “The One Analyst other Analysts can’t Wait to Read.”
Weldon’s Money Monitor offers a FREE 30 Day Trial Subscription. For subscription information contact Eileen @Weldononline.com or Visit www.Weldononline.com for a FREE Trial.
A FREE 30 Day Trial Subscription is defined as a single Trial that is limited to a one-time Signup. Signing up for multiple trials under different names, Fraudulent contact information is illegal. Weldon’s Money Monitor takes this seriously..
The Bottom Line
The recovery in equity markets since February 5th was the start of an intermediate move by North American equity markets that is expected to last until May. However, equity markets have become short term overbought. Preferred strategy is to purchase equities and Exchange Traded Funds on weakness in sectors with favourable seasonality including silver, platinum, mines & metals, oil services, energy and materials.
A small sampling of the 50 Charts Don Vialoux analyses in this great Monday comment HERE.
The Canadian Dollar rose 0.98 last week. On Thursday, it broke above resistance at 97.79 cents U.S. and resumed an intermediate uptrend. Short term momentum indicators are overbought, but continue to trend higher. Seasonal influences have just turned positive. Current intermediate upside potential is to 103.75 cents U.S.
Interesting observation: Wholesale gasoline prices in the U.S. have increased 24.9% since their lows in the first week in February. During the same period, the price of gasoline in the Greater Toronto Area has increased only 6.5% from $0.94 to $1.001 per litre. The difference is strength in the Canadian Dollar. If the Canadian Dollar had remained at its low set in early February, the price of gasoline in the GTA area would be $1.06 per litre.
Gold fell $32.30 (2.85%) last week. Short term momentum indicators are neutral. Support is at $1,044.80 and at its 200 day moving average at $1,040.67.
The Shanghai Composite Index slipped 17.65 points (0.58%) last week. Support is at 2,890.02. Resistances are at 3,306.75 and 3,334.01. The Index has developed an intermediate triangle pattern. Short term momentum indicators are mixed. MACD has recovered from oversold to neutral. RSI is neutral. Stochastics have rolled over from a short term overbought level. Strength relative to the S&P 500 Index remains negative.
The TSX Composite Index gained 38.68 points (0.32%) last week. Intermediate trend is up. The Index closed at a 17 month closing high and is testing its January inter-day high at 12,070.20. Support is at 10,990.41. MACD, RSI and Stochastics are short term overbought, but continue to trend higher. Strength relative to the S&P 500 Index has changed from up to neutral. Seasonal influences remain positive. Strength in the Canadian Dollar curtailed performance last week. Current intermediate upside potential on a break above resistance is to 12,500, the bottom of a previous trading range.
The NASDAQ Composite Index gained 41.31 points (1.78%) last week. The Index continues to advance following a breakout above resistance at 2,326.28. Intermediate trend remains up. Support is at 2,100.17. MACD, RSI and Stochastics are short term overbought, but continue to trend higher. Strength relative to the S&P 500 Index remains positive.
The S&P 500 Index added 11.29 points (0.99%) last week. An upward intermediate trend was confirmed last week when the Index traded above resistance at 1,150.45 to reach a 17 month high. Support is indicated at 1,044.50. MACD, RSI and Stochastics are short term overbought, but continue to trend higher. Seasonal influences remain positive. Current intermediate upside potential is to 1,220.
All 50 Charts Don Vialoux analyses in this great Monday comment HERE.
Don Vialoux has 37 years of experience in the Investment Industry. He is a past president of the Canadian Society of Technical Analysts (www.csta.org) and a former technical analyst at RBC Investments. Don earned his Chartered Market Technician (CMT) designation from the Market Technician Association in 1995. His CMT paper entitled “Seasonality in Canadian Equity Markets” was published in the Spring-Summer 1996 edition of the MTA Journal. Don also has extensive experience with Exchange Traded Funds (also know as Index Participation Units) as well as conservative option strategies. In 1990 he wrote a report that was released in the International Federation of Technical Analyst Journal entitled “Profiting from a Combination of Technical and Fundamental Analysis”. The report introduced ” The Eight Phases of the Stock Market Cycle”, an investment concept that continues to identify profitable entry and exit points for North American equity markets. He is currently a member of the Toronto Society of Fundamental Analyst’s Derivatives Committee. Now he is the author of a daily letter on equity markets available free on the internet. The reports can be accessed daily right here at www.dvtechtalk.com.
Ed Note: Clips from an excellent article “It’s Going To Implode: Buy Physical Gold – NOW”. Full article HERE. Be sure to read Paper Gold Will Fail below. Peter Grandich’s Website HERE
Evidence seems to be mounting that we are headed towards some sort of implosion in the paper Gold market, and perhaps the currency/bond markets in general. Let’s take a look:
Jacksonville, FL based EverBank – a bank with approximately $8 billion in assets and 1800 employees according to the company website – recently sent this notice to customers…
“Non-FDIC Insured Metals Select Changes” –
Section 6.3.7. General Terms: We may close your Metals Select Account at anytime upon reasonable notice to you. (Ed Note: a fraction of the notice, the rest HERE)
“If you have a “Non FDIC Insured Metals Select” account with these people, you can pretty much say goodbye to any chances of ever seeing your metal. This is a clear sign that the (already tight) availability of physical metal at the manipulated Comex futures paper price is in danger of vanishing altogether. Think about it. What is the scenario in which they avoid catastrophic losses while at the same time sending you the US dollar value of the metal? When the official or Comex price has fully decoupled from the physical price. Expect to see more such notices from banks offering Metals “Investments”.
“Citibank recently issued this notice to its checking account (remember the type of account where you thought you could withdraw your money whenever you wanted? Well, not anymore) customers (via Market Ticker):”
Withdrawal Notice:
We reserve the right to require seven (7) days advance notice before permitting a withdrawal from all checking, savings and money market accounts. We currently do not exercise this right and have not exercised it in the past.
“Hmm…let me see. Why would a bank need to impose withdrawal restrictions? Has this kind of a thing happened before somewhere? Could it be because of the danger of a bank run/capital flight from the United States? Why would Citibank fear bank runs? Why would money flee the US banking system/US? Could it be because the entire US banking system and the US Government is INSOLVENT and people – fearing a collapse in the dollar’s value (in terms of real goods i.e. for all you Prechterites out there) – rush to withdraw money convert it into real goods such as precious metals? You tell me. Also, could they maybe increase this notice period from seven to whatever the hell they want whenever they want? What will you do then? Even if you don’t buy Gold with it, withdrawing your cash from America’s insolvent banks is a very wise strategy at this point.”
“Any unbiased observer who knows how to put two and two together will be able to tell that something very fishy is going on. The urgency with which trillions in debt is being shoved down the market’s throat at the worst possible time for the US Economy has the distinct smell of the government trying to extract every last bit of money from those stupid enough to buy the bonds before it all blows up. Rest assured, a huge chunk of this money is being funneled to the insiders who are most likely covertly using it up to buy real assets for themselves while keeping the crowds distracted with the stock market circus.
The bond market is the backbone of the US Ponzi Finance system. When it goes – and the day is not far in my opinion – the whole enchilada will come crashing down. Any type of financial asset that has a counterparty – which is pretty much all the paper assets in the world – bonds, futures, any and all derivatives and yes, even the paper currency – will crash. What will they crash against? Yes, that’s right – Gold. All the world’s capital – trillions, perhaps quadrillions of it – will come rushing into the very tiny physical (NOT paper) Gold market. Remember, the world’s real physical capital – real assets such as land, oil-refineries, mines, infrastructure, etc. will not vanish, only it will be re-priced in terms of Gold and its ownership transferred to those who hold it. Since everything stays on this planet, it is a zero-sum game and the winner will be Gold. In other words, an ounce of physical Gold will command a lot more in real purchasing power than it does today. Just like a national currency is a claim on goods and assets within that country, Gold will be a claim on global goods and assets worldwide.”
Paper Gold Will FAIL
Today what you think of the price of Gold is nothing but the price of paper Gold. “What is the difference between the two? We are still getting the metal at the price we see on the COMEX, are we not?”, you may ask. Sure, but the key word is still. Even today you have to pay “premium” to the futures price to get physical ranging from about $50 for some coins to about $10 for bars. When it all blows, these “premiums” will skyrocket and the price of physical WILL decouple from the official paper price (this is what the guys at EverBank are scared s–tless about), as we already witnessed in 2008 – and this is the good scenario. Indeed, we may have a situation where there is no physical available at any paper price.
1. The GLD ETF
The problems with the GLD ETF are too numerous to enlist here but why bother when they have already mentioned ’em all in their prospectus! It is simply another Wall Street scam designed to rip off the retail investor and rest assured, when the SHTF, you will be the last in line since the insiders need somebody to hold the bag in order for them to get bailed out. YOU will be the one left holding the bag. Unless you have a direct line to Ben Bernanke, I suggest you get the hell out of any paper ETF’s such as GLD, SLV, etc. Remember AIG? It’s all good until it isn’t.
2. The Gold Futures Market
The futures market is nothing but a tool for the dollar managers (US Government/Fed/Bullion banks) to manage/control the price of Gold. Any rational observer with an iota of brain who has watched the gold market for any reasonable length of time can tell that the price is intentionally driven down during the Comex trading hours. If you don’t believe this, either you’re in denial or worse – collusion – and IT WILL end up costing you big time. Given the massive, concentrated and long-term (the entire past decade – they haven’t been net-long – not once – during that time period) nature of their short positions, it really isn’t that hard to deduce that the banks do not nearly have enough metal to cover their shorts and that the sole intention of the massive short position is to control the price. Whenever the price rises (or threatens to rise) the big bullion banks ala JP Morgan create massive naked shorts introducing fake supply of Gold in the market, thus driving the price down. “But the price has been rising for the past decade, hasn’t it? So how can you say they are driving it down?”, many people ask. Well, the constraint on the bullion banks has been the availability of the physical metal. If the metal is not available, the fraud of the paper market is exposed and they lose their price managing ability. So they allow the price rise to a level at which there are some weak hands willing to sell and then they hold it there till all the sellers have been exhausted (I am assuming the Fed has already sold all the US Gold during the past decade). So strong are Gold’s fundamentals that despite the massive rigging, all they have been able to do is slow its rise. The weak hands who sell the physical metal at every price rise have helped them in this endeavor. But soon, as the bond market implodes, they will run out of sellers. Treat the availability of real metal at today’s paper price a gift and buy as much as you can.
To those who think that the Comex shorts will be crushed one day and the price of paper Gold will do a moonshot, to them I will say that you are dreaming. The Comex shorts will be crushed, but not in their own casino! If and when a majority of paper Gold longs demand delivery a force majure (who do you think the US Government will side with?) will be declared with cash settlements and/or offers of equally worthless GLD shares (don’t tell me you didn’t know about this). By some accounts, this is already happening. What will happen to the paper price then? That’s right – it will utterly collapse even as the physical’s price is rocketing. Paper gold holders will dump it all to buy the physical – which, unfortunately – will most likely not be available at all. Yes, yours truly has been trading the paper [Gold] markets himself, but only with the objective of converting the paper profits onto the metal. Having said that, in light of the sum total of the recent developments mentioned in this update I think it is too risky to be trading right now and one should just sit 100% in physical Gold and some currency for day-to-day needs.
Additionally, there is increasing evidence that the Europeans have withdrawn support from Wall Street’s paper Gold market (COMEX and the LBMA, which also operates on a fractional reserve basis as documented here) and are in favor of setting up a physical only Gold market (this is quite a long story – for details, I suggest you go through FOFOA’s blog). Jim Willie had this to say in a recent piece (he’s been accurate on many things so far, so I at least pay attention when he has something to say):
Fast approaching is the event of GAME OVER for London, a condition that has already reached critical level, according to a key reliable source of information with London connections and direct experience with its market events. How long can a major metals exchange sell contracts but have miniscule supply of gold in their vaulted possession? The paper gold market and the physical gold bullion market have finally separated in a practical manner, meaning actual gold has almost no role anymore in London paper contract settlement. The absence of gold in London requires extraordinary tactics to settle contracts and to obtain gold bullion. Red tape procedures delay delivery for individuals, and bribes accompany gold delivery demands as standard practice. The London Bullion Market Assn has almost zero gold, its supply having been drained in high volumes since early December, a process currently in acceleration. The opportunity to convert fiat money into precious metal at prices considered reasonable is also vanishing. The London gold banker said,
“There is going on a lot more than meets the eye. The physical system is actually consolidating bigtime and is organizing itself with lightning speed, totally hidden from pretty much anyone, even the so-called insiders. The paper precious metal market and the physical precious metal market have defacto disconnected. The paper and physical gold markets currently operate in parallel universes. The outflow of physical metal from bank vaults is happening at a mind bending pace.”
Wall Street and the US Dollar are being increasingly marginalized at the global level with China having instructed its companies to renege on Wall Street’s derivative contracts last year; Russia, Middle-East and China setting up their regional currency blocs; Germany calling for an end to the CDS casino and the recent exclusion of Wall Street banks from European Government bond market. For obvious reasons, none of this is getting much play in the lapdog US media.
Physical Gold in your personal possession is the only thing that will survive the coming financial Armageddon. What we are witnessing right now is nothing but the calm before the storm. Keen observers are hearing rumblings beneath the ground signaling an imminent volcanic eruption. Once it blows it will be too late to take action. Trading paper markets for paper gains is like picking up pennies in front of the steamroller. It’s time to stop trading and just buy the physical metal. The window of opportunity to convert your casino chips (fiat money) into real money, i.e. Gold, is getting smaller by the hour. He who panics first, panics best.
GET. GOLD. NOW.
…..read the entire article HERE (there is quite a bit more about the signals showing up in the Bond Market)
Peter Grandich’s Website HERE
-
I know Mike is a very solid investor and respect his opinions very much. So if he says pay attention to this or that - I will.
~ Dale G.
-
I've started managing my own investments so view Michael's site as a one-stop shop from which to get information and perspectives.
~ Dave E.
-
Michael offers easy reading, honest, common sense information that anyone can use in a practical manner.
~ der_al.
-
A sane voice in a scrambled investment world.
~ Ed R.
Inside Edge Pro Contributors

Greg Weldon

Josef Schachter

Tyler Bollhorn

Ryan Irvine

Paul Beattie

Martin Straith

Patrick Ceresna

Mark Leibovit

James Thorne

Victor Adair