
Daily Updates
This article came the the attention of Money Talks via Don Vialoux of Timing the Market
Can precious metals and U.S. Treasury bonds fall together? You bet.
April 8, 2010
By Editorial Staff
Enjoy this excerpt from Elliott Wave International’s free Club EWI resource, Independent Investor eBook (Now With 6 New Chapters!). Please see details on how to read the entire eBook below. Article via The Equity Clock
This section will offer a novel viewpoint. Can you imagine a scenario under which precious metal and Treasury bond prices would fall together? Most people would think such an event would be impossible. After all, as we showed in our study of March 2008, bonds do well during deflationary recessions, and gold goes up during inflationary booms. Shouldn’t they be contra-cyclical?
Look at Figure 3 and realize that gold and T-bonds have been going up together for an entire decade.
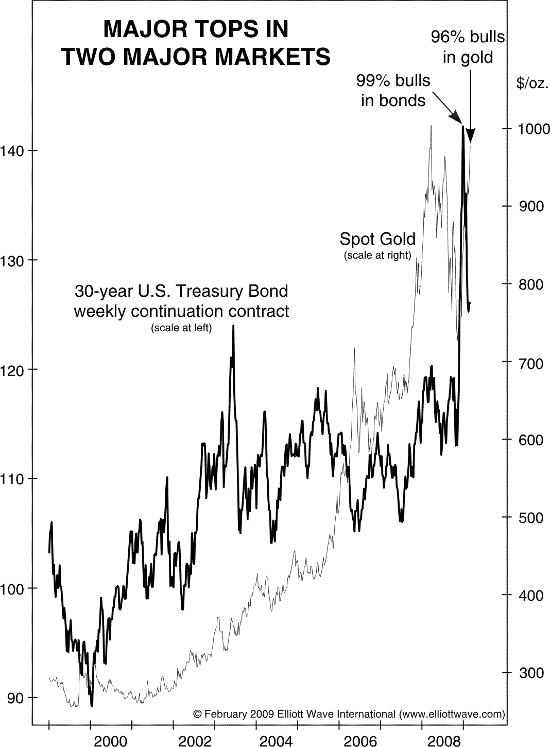
This is completely normal behavior according to our liquidity theory of market movement at the end of credit bubbles and their aftermath, as proposed in Conquer the Crash back in 2002. If gold and T-bonds can go up together for ten years, they certainly can go down together as well.
[Here is a scenario that] is likely to occur later, but since it could happen now, let’s review it. …U.S. Treasuries cannot hold up forever, particularly given the drunken-sailor approach to fiscal management that Congress has practiced over the past century and which has accelerated madly in the past eight years and even more outrageously since last September. At some point, Uncle Sam’s credit rating will begin to slip. According to the price of credit-default swaps on U.S. Treasury debt, it is already slipping.
When the monopoly issuing agent of dollar-denominated debt — the Federal government — begins to lose credibility as a debtor, the U.S.’s great experiment in fiat money will end. Read it here first: The U.S. government is the borrower of last resort. When it can’t borrow any more, the game will be up, because the government’s T-bonds are the basis of our “monetary” “system.”
What will happen when creditors begin to smell default? They will demand more interest. At first, it might not be much: 4%, 6%. But as the depression spreads, spending accelerates, deficits climb and tax receipts fall, the rate that creditors demand might soar to 10, 20, 40 or even 80%. In 1998, annual bond yields in Russia reached over 200% before the government finally threw in the towel and defaulted.
Prices of outstanding bonds, of course, collapse when yields surge. As rates rise, many people will sell other investments to lend at these “attractive” rates. In such a situation, T-bonds would be the primary engine of falling prices, as they suck value from other investments. So, this is another way that gold and bond prices can go down at the same time. …
Finish reading this groundbreaking and powerful 118-page eBook now, free! Here’s what else you’ll learn:
Why Buy and Hold Doesn’t Work Now
How To Invest During a Long-Term Bear Market
The Biggest Threat to the “Economic Recovery” is …
The Errors in “Efficient Market Hypothesis”
How To Be One of the Few the Government Hasn’t Fooled
MUCH More!
Keep reading this free 118-page eBook now — all you need to do is create a free Club EWI profile.
Elliott Wave International (EWI) is the world’s largest market forecasting firm. EWI’s 20-plus analysts provide around-the-clock forecasts of every major market in the world via the internet and proprietary web systems like Reuters and Bloomberg. EWI’s educational services include conferences, workshops, webinars, video tapes, special reports, books and one of the internet’s richest free content programs, Club EWI.
While some analysts are touting natural gas as the substitute for oil, BMO Capital Markets’ Oil and Gas Analyst Mark Leggett says he doesn’t see natural gas replacing oil in the near term. In this exclusive interview with The Energy Report, Mark says that the infrastructure isn’t in place to allow natural gas to become a tangible replacement for oil any time soon. Mark is also still a big fan of oil sands projects in Canada and says that production from those projects can help meet the demand for oil in the coming years.
The Energy Report: Oil is now trading at around $80 a barrel. Is $80 a barrel a sustainable price? Do you expect it to trade higher this year?
Mark Leggett: I think $80 is about the right price, given the current economic conditions. We still don’t really have a strong visible demand recovery and we are still sitting on above-average petroleum product inventories. Eighty dollars or just above $80 may be the top end of the range. The average cost to produce a barrel of crude oil globally is above $75. That tells us that the range that makes sense to us on a sustainable basis is $75 to $80.
TER: Do you see us breaking through the January highs?
ML: I don’t think so. I think the market is trying to. The only wildcard out there that may try and push oil toward $85, or perhaps higher, is the impact of a weak U.S. dollar. When that is the main story in the market, crude oil does try to push higher. However, the market has to turn back to the fundamentals and it’s difficult to see fundamental support at those levels. So don’t expect to maintain a sustained higher level.
TER: Where do you see the price of oil at the end of 2010?
ML: I think $80 makes sense. We’re carrying $80 as an average price in 2011 and we’re being cautious in our outlook and looking for an improvement in demand and inventory levels in the second half of 2011. It speaks to more of an expectation of a modest economic recovery before oil prices move up higher on a sustainable basis.
TER: You said the high-end production cost is $75 a barrel and it’s at $80 a barrel. How are these companies surviving?
ML: Just to be clear, $75 includes a 10% economic rate of return on producing that barrel. That’s basically the hurdle rate that the industry needs to make money. Companies can make money at $75 to $80, but if we do see upward pressure on the cost structure, again, over time we do see a rise in oil price—just not yet.
TER: Do you see upward pressure on the cost structure in 2010 or 2011?
ML: Maybe a little bit. It will be up gradually heading into 2011. As you see more confirmation of a sustained gradual economic recovery, that will put pressure on the cost. Over time, we do see cost pressure on producing a barrel of oil, ultimately leading to a higher oil price.
TER: In our last interview with you (Dec. 2008), we discussed oil sands and you noted that because oil prices were down at that point, many companies had scaled back their spending on those projects. Now that the price of oil is back up in the $80-a-barrel range, has there been an increase in those oil sands projects?
ML: Yes there has. We’ve seen BP (NYSE:BP) enter into two oil sands joint ventures recently and that speaks to the company trying to establish an oil sands portfolio. Also, Athabasca Oil Sands is a private company that’s recently announced that they plan to execute an initial private offering. Another major Canadian integrated oil sands company is Cenovus (NYSE:CVE;TSX:CVE). They are accelerating development plans on two of their projects.
TER: If oil sands production was in full swing, how much would that increase the worldwide level of production?
ML: The way we model it is company by company, and add up all the projects’ production impact. Given the length of time it takes to bring these projects on stream, it’s probably best to look out to about 2015. When we see the bulk of these projects on stream, it would add an increment of 3 million barrels a day of production to the global crude oil supply.
TER: Do you think that would affect the price of oil at that point if we saw that sort of an increase?
ML: No, I think it would be meeting demand. Not necessarily creating excess supply. We do think that non-OECD demand will be strong over time—in particular, China and India and emerging markets.
TER: In addition to the oil sands that you were talking about in Alberta, Canada, are there any other large deposits of oil sands in other parts of the world? If so, are their projects online in those areas?
ML: The other part of the world that does come to mind is the Orinoco Belt in Venezuela. Those projects have recently been nationalized by that government. So the immediate economic impact is a stalled development timeline. Industry now has to renegotiate terms with the government of Venezuela. Usually when you’re working with the government’s projects, they do take longer to come on stream. That means that while there is other big project potential elsewhere, the timeline is not visible.
TER: Extracting a barrel of oil from oil sands produces more greenhouse gases than producing a barrel of conventional oil. If the current administration in Washington were to clamp down more heavily on greenhouse gases, what effect would that have on all these oil sands projects, or on other oil projects in general?
ML: It definitely would have a negative impact on oil sands producers. It did overhang the market last year and into the early part of this year. Nothing came out of the recent Copenhagen United National Climate Change Conference. That global conference was looking to put an idea on what kind of costs oil sands producers may face.
In terms of what the administration in Washington may be implementing, the market may have tried to assume a similar cost impact on these oil sands producers. As of now, there is no clarity on the environmental impact. That being said, all that will do is just increase the cost of these oil sands projects. That effectively increases the costs of crude oil going forward. As long as there is no tangible visible substitute to meet the petroleum product demand, crude oil will be required from the oil sands. At the end of the day, the environmentalists may be just pushing up the price of crude oil.
TER: Are you suggesting there is no tangible visible substitute on the horizon at this time?
ML: It’s interesting to look at the hypothesis of using natural gas. It is becoming very visible, and a lot of respected people in industry are pointing that out. However, when you look at the ramifications of building out infrastructure in places like Pennsylvania, where there are no pipelines or gas plants, it takes a while to build those up. Then more importantly, the infrastructure needed to supply transportation throughout the United States is significant and it will take a long time for that to be put in place. So that day may come, but I don’t think that date is visible at this point.
TER: From your viewpoint, should the oil sands from Canada be considered part of the U.S. energy supply because there is no ready substitute for it?
ML: Yes.
TER: That should be good for those companies.
ML: It should be. Plus you have the various Chinese entities that are continuing to execute M&A transactions to build out their interests in the oil sands. Global oil companies are establishing positions in the play. They see the need for those barrels over time. It confirms demand for oil sands barrels.
TER: Of the companies that have oil sands projects in the works, or maybe just even on the drawing board, are there any that are interesting to you right now?
ML: The ones that we like to highlight are companies with existing operations, strong balance sheets and that have below-average execution risks. The three companies are Canadian Natural Resources (NYSE:CNQ;TSX:CNQ), Suncor Energy Inc.(NYSE:SU;TSX.V:SU) and Canadian Oil Sands Trust (TSX:COS.UN).
TER: And what do you primarily like about those companies?
ML: They all have existing operations that are producing oil sands. As our prior conversations alluded to, the costs of projects in the past have always come in higher than originally budgeted. Sometimes they’ve been delayed as well. When you have certainty of production and associated cash flows, usually those companies are rewarded with better multiples.
TER: So you tend to not look at the companies that are just in the discovery mode?
ML: You have to be selective and careful. Usually the companies that have existing operations plan to build out additional projects, which will provide that growth element for you. Cenovus is another company that I mentioned earlier that is accelerating development plans on a couple of their projects. Typically, these oil sands companies are always looking to grow their own oil sands production over time. They still do provide the investor with a growth profile and we prefer the risk/reward profile for these types of companies.
TER: As far as extracting the oil from the oil sands, it’s a relatively complicated process. It’s very energy intensive. Is there any additional work being done in terms of technology to try to find easier and less costly ways of doing that extraction?
ML: You need natural gas to run oil sands mines. Using energy to get energy is a bit of a challenge in itself when the input cost is rising somewhat. Natural gas supplies are up and the price is coming down, and we believe it will be lower long term. That’s actually a positive for the oil sands. They’re not as desperate to find a different input energy source to natural gas. We’ll see over time if industry comes up with modifications to the process. One thing that people tend to underestimate is the oil and gas industry’s ability to adapt and create economically viable new technology.
TER: There’s been a lot of activity in the natural gas market lately. For example, Royal Dutch Shell (NYSE:RDS-B) and PetroChina Company Ltd.’s (NYSE:PTR) joint proposal to acquire Arrow Energy (ASX:AOE), and the ExxonMobil (NYSE:XOM) merger with XTO Energy (NYSE:XTO). Do you see natural gas as a good place for investors this year?
ML: No. We’ve been conservative on natural gas and are definitely not suggesting to clients to enter into that segment of the market. We could see another 10% to 15% downside from current share price levels.
TER: With the price being as low as it is right now, do you see some companies starting to take rigs offline?
ML: Not yet. We continue to see rig counts increase very marginally. Louisiana is probably the most robust profile, with the Haynesville Shale Gas developments unfolding. The way the regimes are set up, the companies are required to drill the well in order to hold onto the land. They’re being economically incentivized to drill wells when the macro environment doesn’t require it. There’s a disconnect. We need to see that rig count pullback harder, or at least start declining.
TER: Are there other types of rigs that have been taken offline other than the horizontal that are in production now?
ML: We pretty much zero in on the horizontal rigs for the most part because that’s definitely the manner in which those shale wells are drilled. Vertical well productivity is a tenth of what a horizontal rig can do. Even if you see some verticals come off, it won’t be significant enough to make an impact.
TER: The reason I ask that question is we chatted with somebody recently who was looking at natural gas rig counts and indicated that the natural gas rig counts have gone down.
ML: Baker Hughes (NYSE:BHI) put out the numbers and there’s been a steady climb. From a natural gas standpoint only, we’ve seen week-over-week increases in rig counts.
Source: Baker Hughes
TER: Are there any companies in the natural gas sector that you’re watching even though things are not that great at this point in your opinion?
ML: Even when we may not prefer natural gas, you have to keep your eye on the ball. When all the negativity is priced in maybe it is a good time to be buying. Progress Energy Resources Corp. (TSX:PRQ) is probably the company that I would highlight. They’re 90% levered towards natural gas on a production and a reserve basis. They have built out a significant northeast British Columbia natural gas play targeting the Montney Shales, which can be very economic at low gas prices.
TER: Since the price is relatively low right now with natural gas, how do you explain the activity going on with those mergers and such?
ML: It’s a bit of a two-pronged answer. Big oil needs to grow their reserves and they seem to be entering into a number of these joint ventures or M&A transactions. It’s partly big oil replacing and growing their own reserves and that is the most visible way of doing it. Secondly, international companies are coming into U.S. shale joint ventures to learn how to apply that technology in other countries.
TER: How much of an impact will other countries such as China, Russia and India have in the natural gas marketplace? Will it drive up demand?
ML: The Chinese are definitely going to be a source of demand growth and so will India, but the international liquefied natural gas (LNG) market is very much well supplied as well. China and India will be a source of demand, but the industry will be able to provide a supply to meet it with no problem.
TER: Natural gas has been trading at or below some prices of coal. It’s been suggested that there might be the potential to switch to natural gas over coal for electricity generation. That could increase demand and drive the price up. Do you see that as a possibility?
ML: Absolutely. That transpired last summer and we still filled up natural gas storage. With levels in the $4 to $4.25 range for NYMEX Henry Hub gas prices, switching to natural gas from coal makes sense. We did have a lot of switching last year. You almost need to have that switching happen to prevent any further negative downside. But when you had a lot of gas/coal switching last summer, and you still filled up storage, that tells you industry’s capability of putting on a lot of supply onto the market.
TER: So do you see natural gas still being right around $4 by year end?
ML: That’s a difficult call to make right now because it really depends on the weather. We could be around $5 in December, but if the winter heating season gets off to a slow start, it could be closer to $4.
TER: If natural gas goes up, will there be a switch back to coal? Is it so easy to switch back and forth that they go with whichever is cheaper?
ML: At the margin. However, in terms of a significant new source of demand, it’ll take some time for the utilities to be able to adopt that policy. The historical volatility of natural gas prices has prevented utilities from finding comfort in using natural gas as an energy input source. Additionally, a significant amount of infrastructure is being brought on stream utilizing coal. With billions of dollars already spent for coal-fired infrastructure, it’ll take some time before natural gas can replace it.
TER: With a lot of these natural gas plays, the companies are also starting to look for oil. What’s your view on that?
ML: Anytime you can get your hands on oil, that is always a positive. Some of the most prolific or highlighted natural gas wells are such because they include high liquids content. It’s effectively an oil well within the natural gas well. What that is telling you as an investor is oil is the key. You want to have exposure to oil because that’s what drives the value. Companies that are working their way to a 50/50 split between natural gas and oil give you exposure to an oil growth profile.
TER: Where is Progress in that?
ML: Progress is only in natural gas 90%. They’re only identifying a natural gas play. So they’re sticking to what they know how to do.
TER: Do you have some gas/oil plays that you are recommending?
ML: Crew Energy Inc. (TSX:CR) is 50% oil, 50% gas. They are having very good success on a horizontal heavy oil program that’s not capital intensive. It’s less than a million dollars to drill their wells. The wells pay out in about three quarters. It’s a free cash flow asset. They can generate free cash flow to fund the drilling of more oil wells.
TER: Has the market priced in this free cash flow?
ML: Somewhat. I think they need to see more data. It’s still early.
TER: Are there other companies in this gas/oil sector that you’re watching?
ML: Crew is the dominant player there. We’ve just seen other companies begin to license wells targeting the same formation. The Pekisko formation in that region has been successful for Crew. When you see industry follow up another company’s success by licensing more wells, it’s confirmation that they do see the visibility of a good oil play.
Another company that we also like that is 90% oil levered is PetroBakken Energy Ltd. (TSX:PBN). They have exposure to the Bakken light oil resource play in southeast Saskatchewan. That’s a shallow extension of what companies are drilling in North Dakota that’s migrated up into Saskatchewan. The company has also recently built out a strong Cardium light oil inventory in Alberta through acquisitions. The stock has actually traded down recently, despite strong crude oil prices. That is largely reflective of the company completing M&A transactions as well as a lack of data points on well productivity levels. We maintain a positive expectation on the Bakken and Cardium plays that we think over time will reward investors, and they do pay a dividend that yields just above 3½%.
TER: How are these light oil plays in the Bakken compared to the oil sands in terms of the cost of extraction?
ML: I personally prefer the Bakken because you can turn them on and off like a light switch. They’re not capital intensive and you have long life reserves. The breakeven requirement in Saskatchewan is typically about $40 WTI. It was a play I liked early in the recovery last year because it didn’t need big oil prices to generate a strong rate of return. It’s definitely a play I like when we’re in the $80 environment. The Petrobakken stock has retraced recently. It’s been forming a bottom and it’s an opportunistic time to be looking at it.
TER: Any other Bakken plays that you’re watching?
ML: Legacy Oil & Gas Inc. (TSX:LEG) is another Bakken player that we like. We’re expecting them to unlock the Taylorton area, which is on the Saskatchewan/North Dakota border. We expect the Taylorton wells to be the best Bakken wells drilled over the last five or six years. The Taylorton economics should be top decile and Legacy holds an inventory of about 100 locations. They also have three light oil exploration plays in their back pocket. They’re not providing any detail, but management does have a long-standing record of success in light oil resource plays.
TER: If an investor were ready to get into doing some of these oil plays, is the Bakken investment superior to the oil sands?
ML: It is on a near-term basis. The oil sands plays are a bit more of a longer-term view on the commodity.
TER: Thank you for your time.
Oil and gas analyst Mark Leggett joined BMO Capital Markets as an integrated oils associate in 2002. He was promoted to analyst in 2004. Based in Calgary, he covers Canada’s intermediate and junior oil and gas producers. A Chartered Financial Analyst (CFA), Mark’s previous 12 years’ industry experience was primarily at Canadian Natural Resources. The University of Calgary awarded Mark his Bachelor’s of Commerce degree in finance in 1990.
Want to read more exclusive Energy Report interviews like this? Sign up for our free e-newsletter, and you’ll learn when new articles have been published. To see a list of recent interviews with industry analysts and commentators, visit our Expert Insights page.
Paul Krugman argues that best solution for Athens would be to simply inflate away its debt burden. He is wrong.
In a commentary two weeks ago, I rebutted dangerously silly arguments put forward by New York Times columnist Paul Krugman about how the United States should pressure China to drop its support for the U.S. dollar (click here to view). Although there is far more happening in the world outside of Mr. Krugman’s brain than within it, fresh drivel from the acclaimed Nobel Prize winner compels me to turn my focus there once again.
In today’s column, Krugman analyzes the Greek debt crisis, arguing that the best solution for Athens would be to simply inflate away its debt burden with printing press money. Krugman laments that this sensible option is being foreclosed by the monetary priggishness of the German heavyweights in the European Union, who are ‘foolishly’ seeking to prevent inflation and impose fiscal discipline.
His theoretical justification is put forward in a familiar Keynesian recipe: deficit spending leads to inflation and growth, which leads to greater employment and rising GDP, which makes debt payments much easier to bear in relative terms. He laments that Greece does not control its own currency and is therefore unable to pursue such a policy on its own accord. He implores U.S. policy makers, who do control their own monetary policy, to take heed of the danger and avoid such a course.
In simple terms, Krugman believes that inflation is the best cure for burdensome debt problems. To prove his arguments, he points to the course followed by the Unites States in the decade after the Second World War. In 1946, due to unprecedented military spending during the war, U.S. public debt as a percentage of GDP came in at a staggering 122 percent – which is even higher than the 113 percent currently weighing on Greece.
Krugman endorses U.S. policy at the time which, he claims, concentrated on fostering growth instead of taking measures to drastically cut the post-war debt. He notes that by the end of 1956, the federal debt had not diminished in nominal terms, but had become much easier to bear because of the decade of GDP growth that inflationary policies had created.
He neglects to mention that during the five years from 1945 to 1949, federal spending dropped by 58% and taxes fell by 12%. Meanwhile, the budget deficit fell by 66% in 1946 and was in surplus from 1947 to 1949. [i] In other words, although we did not pay down our nominal debt in the decade after the war, we did succeed in massively shrinking government and the burden that it places on society. Could it be that this had something to do with the post-war boom, or should we give all the credit to the monetary policy? (It is important to point out that our national debt did initially decline from 1945 to 1949, but the extra spending necessary to finance the Korean War reversed that trend.)
Also, after the war ended, American factories quickly retooled production from military hardware to consumer goods. The products not only created a domestic boom in living standards, but were also in high demand in war-ravaged Europe. The late 1940’s and 1950’s produced some of the largest U.S. trade surpluses (in relative terms) in our history.
Today, government spending is rising at the fastest pace on record (not fast enough for Krugman) and our trade deficit is growing as well. In 2011, the government is forecast to spend $3.8 trillion.[ii] To truly replicate post-war fiscal policy, in the next four years: federal spending would have to be slashed by $2.1 trillion to $1.5 trillion, tax revenues would have to be lowered from $2.4 trillion to $2.1 trillion, and the federal budget would have to record a $650 billion surplus. [iii] [iv] Since Krugman would never support these spending and tax cuts, he must feel that similar success can be achieved solely through the monetary policy of inflation.
In his column, Krugman warns that the biggest danger of the austerity measures necessary for Greece (and the United States) to pay down debt organically is the deflation that would ensue. Like most of his academic peers, Krugman believes that falling prices are the economic equivalent of kryptonite, guaranteed to bring low even the mightiest economy.
He is wrong. We need deflation. As a result of a phony boom in assets, prices levels are still too high relative to the earning power and productivity of American workers. Falling prices will cushion the blow of recession (by allowing people to buy more with their paychecks and savings) and will eventually encourage people to spend when prices fall low enough. Deflation is the only way to save us from the much greater horror of inflation, or hyper-inflation, which Krugman argues is not actually that bad.
Inflation can’t save us from lower real wages and falling living standards, it will simply change the manner in which we are impoverished. With deflation, workers’ wages fall; with inflation, consumer prices rise. Deflation hurts, but inflation can spiral out of control, especially with an Administration addicted to spending.
In Paul Krugman’s world, deep structural problems can be solved simply by printing currency. I wonder whether he thinks all the Americans in debt should be given little basement printing presses to counterfeit away their troubles.
Krugman’s advice will appeal to his fans in government and academia, but won’t help the average American. If we dare to follow his lead, a Greek tragedy will be played out in American garb.
Euro Pacific Capital was founded in 1980 and headquartered in Westport, Connecticut, Euro Pacific is a full service, FINRA-registered broker/dealer that has historically been recognized for its expertise in foreign markets and securities. Through its direct relationships with countless foreign trading desks, the firm’s clients are able to avoid the large spreads often imposed by domestic market makers of foreign securities, thereby substantially reducing overall transaction costs. See The Euro Pacific Advantage
Though we offer access to all U.S. stocks and bonds, and are certainly knowledgeable in domestic investments, we specialize in international securities. By trading foreign stocks and bonds through Euro Pacific Capital, individual investors can benefit from our extensive experience in this highly specialized area. Euro Pacific Capital’s clients gain access to foreign markets which are out of reach for most individual investors trading through traditional brokerage firms. With Euro Pacific’s guidance, buying foreign stocks and bonds, and building a truly global portfolio, has never been easier. Let us put our experience to work for you.
Euro Pacific Capital does not engage in any market making activities, thus the firm’s individual and corporate clients can be assured that any recommendations given are free from the various conflicts of interest so prevalent among Wall Street brokerage firms.
Peter Schiff, the firm’s president, and a renowned pioneer in the field of international investing for individual investors, leads a team of investment professionals and support staff dedicated to the highest levels of customer service, a team literally searching the world over for valuable investment opportunities.

The Big Picture shows The CRB Index going all the back to the year 1,450 – courtesy of Bianco Research
About now, you may be saying to yourself, “How on earth could anyone find this ancient data — and can it possibly be accurate?”
The answers might surprise you:
The chart uses the following series (plotted monthly):
• 1749 to date: The Wholesale Price Index (now called the Producer Price Index) as calculated by the Bureau of Labor Statistics.
• 1749 to 1861: Statistical Tables of Commodity Prices from: Wholesale Commodity Prices in the
United States, 1700 to 1861, by Arthur Harrison Cole (Harvard University Press, 1938)
• 1749 to 1932: The Warren And Pearson Index of Commodity prices in New York, by George F. Warren and Frank A. Pearson (Wiley, 1933)
• 1782 to 1820: Jeavons Index compiled in 1865
• 1821 to 1929: Sauerback-Statist Index of Commodities in England The following commodity prices (start date): Gold and Silver (1749), Platinum (1938), Copper (1784), Crude Oil (1859), Heating
Oil (1923), Gasoline (1920), Lumber (1890), Wheat (1749), Corn (1749), Soybeans (1914), Cattle
(1749), Hogs (1749) and Pork Bellies (1949).
• 1956/57 to date: The monthly average of CRB BRIDGE futures index as calculated by the Commodity Research Bureau.
• 1450 to 1956: A “Reversed Engineered” CRB using the wholesale/Producer Price Index and 11
commodities as calculated by the Foundation For The Study Of Cycles. (The correlation between
this index and the “real” CRB BRIDGE since 1957 is well over 95%).
Much of this data is available from: The Foundation For The Study Of Cycles.
And yes, it seems to be fairly accurate.
The Big Picture is written by and for investment professionals, as well as anyone else interested in investing, markets, and the economy. We key in on what you should — and more importantly, what you should not — do with your money. I have been writing about these topics for ~15 years, and blogging since 2003.
By sheer accident, it has become one of the best reviewed finance blogs on the web.
The writing is designed to be very accessible — no PHD required. Hell, no college degree is required. If I can make this stuff understandable to my right brain art teacher wife and my 74 year old retired real estate agent mom, then I can help you learn the basics of markets, investing and the economy.
Over the years,we have put up a fair bit of content:
Over 12,000 posts
250,000 comments
53 million page views
The readership of The Big Picture ranges form Mom & Pop, to Wall Street asset managers, economists, strategists, individual investors, print & tv & radio journalists, Professors, researchers, and analysts. Traffic logs show regular visitors come from the Federal Reserve, Goldman Sachs, the Joint Economic Committee of Congress, as well as Dr. Wu’s statistic class at Sonoma State University.
AS WELL as being close to each other on the periodic table, copper, nickel and zinc share several traits. Like other commodities such as oil and gold, the prices of all three are soaring again after a crisis-induced collapse (see chart). In an astounding recovery, metals prices have almost doubled over the past year.

……read more HERE
-
I know Mike is a very solid investor and respect his opinions very much. So if he says pay attention to this or that - I will.
~ Dale G.
-
I've started managing my own investments so view Michael's site as a one-stop shop from which to get information and perspectives.
~ Dave E.
-
Michael offers easy reading, honest, common sense information that anyone can use in a practical manner.
~ der_al.
-
A sane voice in a scrambled investment world.
~ Ed R.
Inside Edge Pro Contributors

Greg Weldon

Josef Schachter

Tyler Bollhorn

Ryan Irvine

Paul Beattie

Martin Straith

Patrick Ceresna

Mark Leibovit

James Thorne

Victor Adair