
Daily Updates
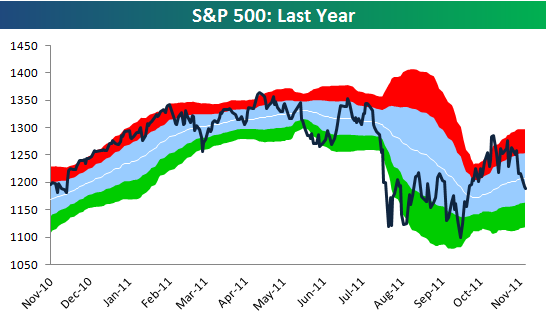
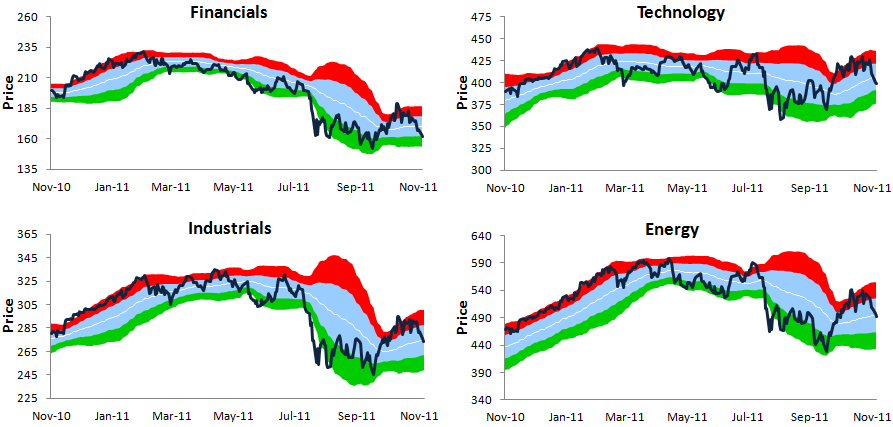
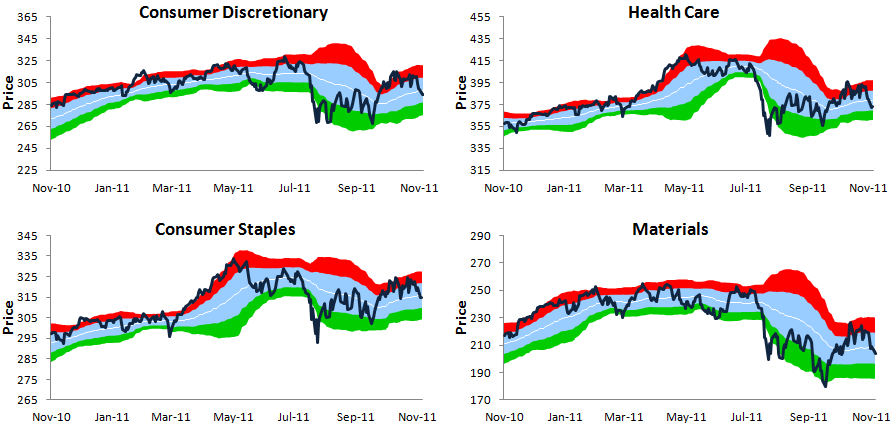
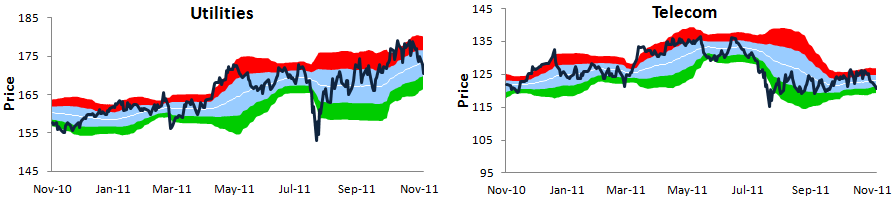
One-Year Trading Range Charts for the S&P 500 and Its Ten Sectors
Below we provide our one-year trading range charts for the S&P 500 and its ten sectors. In each chart, the blue shading represents the sector’s “normal” trading range, which is between one standard deviation above and below the 50-day moving average (the white line). The red zone represents between one and two standard deviations above the 50-day, while the green zone represents between one and two standard deviations below the 50-day. Moves into or above the red zone are considered overbought, while moves into or below the green zone are considered oversold.
While the S&P 500 has pulled back more than 8% since its intraday high on October 27th, it’s still trading within its “normal” trading range. To get to oversold, the index needs to fall another 2.11%. For bears that are hoping for farther declines, there is still quite a bit of downside room to run before an oversold bounce would be expected.
For larger images click HERE
For larger images click HERE
For larger images click HERE
To receive and analyze these charts on a regular basis, sign up for a Bespoke Premium membership today. Please call 914-315-1248 with any questions.
During the recent gold bull run, investors interested in gold flocked to a variety of investment options including bullion and ETFs. Gold prices have made historic gains, but the performance of gold equities has not followed suit. In an attempt to become more attractive for gold investors, miners, both large and small, have grown more inclined to share their wealth through dividend payments.
Gold mining companies haven’t always shown their current enthusiasm for cutting investors in on the profits, but then again, most didn’t have nearly as much cash to share. Soaring prices led to margins that swelled far above costs resulting in record revenues for many miners. This has given them the ability to dole out more cash to shareholders, invest in projects and still have ample cash for comfort.
Dividend increases
Barrick Gold (TSX:ABX,NYSE:ABX) is a prime example. The company, which says it has a practice of paying a progressive dividend, recently announced a boost in its dividend from .12 to .15 cents per share while also noting that it could continue to make high return investments in its project pipeline.
Yamana (TSX:YRI,NYSE:AUY,LSE:YAU) which earlier this month announced its second dividend increase for the year, from .18 to .20 cents is another miner that has also made a commitment to continue the trend of returning greater value to shareholders.
All gold mining companies have not employed the same strategy with regards to making dividend payments, which may be a good thing for investors. That they are forming dividend policies more on an individual basis than on a competitive basis may reduce the risk of investors getting lured into offerings that are unsustainable.
Newmont (NYSE:NEM), which announced that its fourth quarter dividend would move up to .35 cents from the third quarter rate of .30 cents, made a record-setting move this year by linking its dividend to the gold price. The company later sweetened that deal with a “step up” feature that boosts the dividend even further when its realized quarterly gold price exceeds $1,700 per ounce.
However, Gold Fields (NYSE:GFI,JNB:GFI) CEO Nick Holland said he has looked at what others are doing and made it clear that gold linked dividends aren’t his company’s style. Holland said Gold Fields pays dividends out of earnings, not based on gold price and they do so annually, not quarterly.
While some miners have been in the habit of offering dividends for years, for others the practice is new.
Earlier this month, SEMAFO (TSX:SMF), which operates in West Africa, announced its inaugural dividend of .02 per share.
Nevsun (TSX:NSU,AMEX:NSU,NYSE:NSU) announced that it would starting paying a semi-annual dividend of .03 cents per share in May, noting that the successful startup of the high grade, low cost Bisha mine in Eritrea was the start of significant cash flow for the company. Yesterday, the company announced an increase to .05 per share.
Though there are critics who point out that the dividends from gold mining equities can’t stand up to those offered in some other industries that so many miners are doling out more of their cash to shareholders is a positive showing.
The trend reveals that gold mining companies are optimistic about the future.
When announcing the company’s dividend increase, Peter Marrone, Chairman and CEO of Yamana expressed confidence in the commodity price environment and the company’s ability to execute future growth and continued growth in cash and cash flow.
Gold miners positive attitudes toward dividend payments also helps to sell the case of those who insist that gold mining equities are growing increasingly attractive.
Miners and market watchers point the industry’s lagging share prices, production increases and the accrual of cash as proof that gold mining stocks are deeply discounted. And, if predictions are correct, and 2012 holds an even brighter future for gold prices, there will be an even larger cushion of cash between the amount it costs to pull gold out of the ground and the amount it is sold for, which should translate into even more phenomenal profits.
The U.S. Thanksgiving holiday arrives this Thursday. Historically, equity markets on both sides of the border have moved higher during the day before and the day after Thanksgiving. Will it happen again this year?
Two of the strongest days of the year for U.S. equity markets are the day before and the day after U.S. Thanksgiving Day. Thackray’s 2012 Investor’s Guide notes that, “The day before Thanksgiving and the day after have had an average cumulative return by the S&P 500 Index of 0.8 percent per period”. During the past 61 periods, the Index gained in 50 periods, was unchanged in three periods and slipped in eight periods.
Performance of the TSX Composite Index during the U.S. Thanksgiving rally period also has been positive. The TSX Composite Index since its relaunch in March 2000 has advanced in nine of the past eleven periods.
Strength during the period is influenced by a difference in sentiment between institutional and individual investors. Most institutional investors and market makers have a diminished impact on equity markets because they close their books at midday on Wednesday, the day before Thanksgiving. They take an extended long weekend including a holiday on Friday, the day after Thanksgiving. Individual investors have a greater impact on equity markets. They are in a buoyant pre-Christmas mood. Thanksgiving Day in the U.S. is the start of the Christmas shopping season. The day after Thanksgiving Day is known as “Black Friday” and traditionally has been the busiest shopping day of the Christmas season. It became known as “Black Friday” because historically that is the date when retailers finally turn a profit for the year. Their profit and loss statement literally turns from red to black.
Prospects for a Thanksgiving rally in U.S. and Canadian equity markets from Wednesday to Friday this week are better than average. October retail sales in the U.S. reported last week were higher than consensus implying that consumers are returning to the stores for the Christmas season. In addition, retail merchandisers such as Target Stores and Wal-Mart offered positive guidance for the fourth quarter after releasing third quarter results last week. Consumer electronic goods are a particularly hot item this year. In order to prepare for the annual crush on Black Friday, at least some stores have decided to open on Thanksgiving Day for the first time. Others have decided to open at 12:01 AM on Friday.
On the charts, the retail merchandising sector has a positive technical profile reflecting an encouraging fourth quarter outlook. Investors interested in the sector tend to focus on two actively traded Exchange Traded Funds, Retail HOLDRs (RTH $109.78) and S&P Retail Index SPDRs (XRT $51.34). Retail HOLDRs touched an all-time high early last week despite a significant decline by equity markets around the world. According to Thackray’s 2012 Investor’s Guide, seasonal influences for the retail merchandising sector are particularly strong from October 28th to November 29th. Average gain per period during the past 21 periods was 6.2 percent. The trade has been profitable in 19 of the past 21 periods.
Retail HOLDRs holds 18 retail merchandiser stocks. Largest holdings and their portfolio weights are Wal-Mart (18.3 percent), Home Depot (13.6 percent), Amazon.com (13.4 percent) and Target (7.6 percent). Management expense ratio is zero.
S&P Retail Index SPDRs holds a more diversified portfolio with 96 retail merchandiser stocks listed on U.S. exchanges. Largest holding is Aeropostale with a 1.6 percent weight. Management expense ratio is 0.35 percent.
Preferred investment strategy is to defer the sale of equities, Exchange Traded Funds and mutual funds until after the U.S. Thanksgiving rally period.


Don Vialoux is the author of free daily reports on equity markets, sectors, commodities and Exchange Traded Funds available atwww.timingthemarket.ca He also is a research analyst for Horizons Seasonal Rotation ETF (HAC). All of the views expressed herein are his personal views although they may be reflected in positions or transactions
in various client portfolios managed by Horizons Investment.
My review of the markets is weighed heavily by the belief that liquidity should become less and less as we moved through December. Here in the U.S., this is really a three-day trading week as Friday’s half-day is usually on very light volume.
Yours truly shall be taking a vacation from December 10th to January 3rd.
U.S. Stock Market – The “Don’t Worry, Be Happy” crowd on Wall Street would very much like to get their greatest fable into full gear – the Santa Claus rally. Unfortunately, a few silly matters they would like us to consider unimportant, like the financial crisis in Europe and the coming debt disaster here in the U.S., has caused a flight delay of Santa’s ride over Wall & Broad.

But with “Gobble, Gobble” day near, I suspect the “happy” people and their favorite landing place for Santa’s reindeers, CNBC-TV, shall help accomplish their yearly feat (albeit somewhat subdued) starting today.
The 50-Day M.A. is holding (for now). And while the “happy days are here again” sentiment has yet to be fully worked-off, we’re oversold very near-term. I suspect we shall see a “turkeys can fly” (but don’t ask Les Nessman) attitude for the balance of the week.
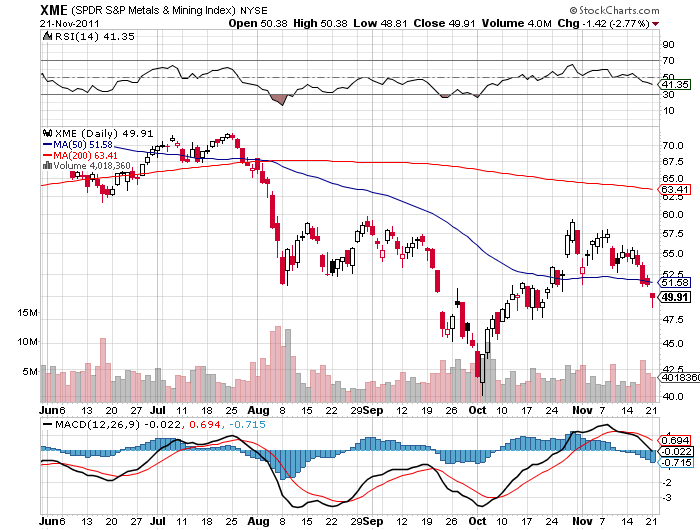
Gold and Silver – Some unanticipated near-term technical damage has been done. And while the decreasing liquidity through years-end can exaggerate any moves, the longer term picture remains as bright as ever.

U.S. Dollar – You would think with the Euro apparently disintegrating and the only real money (gold) under pressure, good old Uncle Sam could manage to at least get above it’s fairly tight trading range. Again, while lack of liquidity can lead to such a feat, I would look to short the terminally-ill dollar if it got much above 81-82 on the U.S. Dollar Index.

U.S. Bonds – Death, taxes and actual losses over the next ten years to anyone who purchases a 10-year Treasury bond today are sure things in my book.

Oil and Natural Gas – Oil did briefly get above my target of $100. 2012 could see an historic military fight in the Middle East. $100 oil could be cheap if such an event occurs. Stay tuned.

Natural gas is building a very long base in its infant bull market stage. Unfortunately, most natural gas stocks are overpriced in my eyes.
Mining and Exploration Shares – Look for continuing tax-loss selling right up to the last days of December. I’ve an increasingly long list of attractive companies I hope Santa can bring me for Christmas. I shall make it known in the coming days.
Quotable
“Shut up! Shut up! I am busy. I am working Cape Race!”
– John Phillips (chief radio officer aboard the Titanic), in reply to Cyril Evans Ice warning.
Commentary & Analysis
There is nothing new flowing from world leaders in an effort to fend off yet another bout of “risk off” and a nasty contagion except the same old policy; this time with the ECB taking a broader role:
Get the Fed and ECB to buy huge amounts of bonds is the déjà vu all over again solution to our woes. It’s been a movie played twice in the US so far and is ending badly.
Effectively more bond buying does little to solve the long-term structural problem facing the globe. Which, more than incidentally, is the same problem that led to the credit crunch in the first place-there is too much debt in the system. Period! End of story!
So, might we see QE3 from the Fed and the ECB now that Europe’s latest “summit to end all summits” has proven a failure? Yup! If the latest budget huddle in Washington is any indication, it proves politicians do not have the will to make real changes; so why not fall back on central banks.
….read more HERE
-
I know Mike is a very solid investor and respect his opinions very much. So if he says pay attention to this or that - I will.
~ Dale G.
-
I've started managing my own investments so view Michael's site as a one-stop shop from which to get information and perspectives.
~ Dave E.
-
Michael offers easy reading, honest, common sense information that anyone can use in a practical manner.
~ der_al.
-
A sane voice in a scrambled investment world.
~ Ed R.
Inside Edge Pro Contributors

Greg Weldon

Josef Schachter

Tyler Bollhorn

Ryan Irvine

Paul Beattie

Martin Straith

Patrick Ceresna

Mark Leibovit

James Thorne

Victor Adair