
Daily Updates
May 23 2010
The stock market topped in April which was expected from analyzing stocks and the indexes. Back in April I posted a few reports explaining how to read the charts to spot market tops. Today’s report is about identifying market bottoms. For the May 2nd Market Top Report: Click Here
It does not get much more exciting than what we have seen in the past 2 months with the market topping in April and the May 6th mini market crash. This Thursday we saw panic selling which pushed the market below the May 6th low washing the market of weak positions.
For those of you who have been following me closely this year I am sure you have noticed trading has been a little slower than normal. This is due to the fact that the market corrected at the beginning of the year and we went long Feb 5th and again on Feb 25th. Since then the market rallied for 2 months and never provided another low risk entry point. In April the market became choppy and toppy and we eventually took a short position to ride the market down. Now were we are looking at another possible reversal to the upside.
Only a few trades this year which I know frustrates some individuals but if you step back and look at my trading strategy you will learn that we only need to trade a few trades a year to make some solid returns. I don’t know about you but I would rather trade a few times a month and live life between trades… not trade all day every day getting bug eyed in front of the computer.
Ok enough of the boring stuff let’s get into the charts…
…..read more and see the charts HERE
In this issue:
The Case for a Fed Rate Hike
Employment Is Turning the Corner
The Headwinds of Money Supply
Who Stole the Inflation?
The Fed Is On Hold
An Inverted Yield Curve?
LA, Vancouver, San Francisco, and a First
Often Wrong, Seldom in Doubt
Everywhere there are arguments that we are in a “V”-shaped recovery. And there are signs that in fact that is the case. Today we will look at some of those, and then take up the topic of when the Fed will raise rates. We open the case and look at the evidence. Is there enough to come to a real conviction? I think there is. (And at the end of the letter I mention two conferences I am speaking at in the next few months, in Vancouver and San Francisco.)
But first, a little housekeeping. The delivery rate for this letter has not been good for some time now and we are aware of it. We get tons of letters and calls from long-time readers who want to know why we have dropped them from the list. They keep resubscribing but not getting the letter. It is a problem. I was not getting delivery on my own personal accounts from well-known email providers. We apologize for any inconvenience. Please know that we do not drop anyone from the list unless they request it or we get hard bounces or undeliverable messages.
Hopefully that has all changed with this letter. The problem has been that the list is so large that it is blocked long before the letter ever hits your inbox. The computers at service providers just assume anything this large can’t be for real. We are now using a service that is a third-party verification of our letter, which hopefully will fix the problem (not a cheap solution, by the way!). So, there may be a lot of you for whom this letter is (hopefully) a pleasant surprise after not getting it for some time.
If that is the case, we would like to know. If you have the time, drop me a response that says “got it” in the subject line. And of course, if you don’t want to get the letter you can hit the unsubscribe button at the bottom. But even better, why not forward this to a friend and tell them to subscribe?
For the record, we are working on a MAJOR revision of the website and the letter. There will be a lot more ways for you to interact with me and each other. A lot more information and capabilities. We are excited. It should be here by the fall. Tiffani and I think you are really going to like it. And now to the letter.
Employment Is Turning the Corner
There is a little-known employment report that the BLS (Bureau of Labor Statistics) releases late in the month that is a summary of the employment reports from the 50 states. Of late, this number has been higher than the federal government survey. Adding the states together, we find that 412,200 jobs (non-seasonally adjusted) were created in April, higher than the establishment survey (which for whatever reason gets the headlines) and more in line with the household survey, which showed an employment gain of 550,000 (seasonally adjusted).
I think it is well established by now that I am not a fan of the birth/death employment estimates in the establishment survey. That is where the BLS estimates the number of new jobs created by the birth or death of new businesses. It is often a significant portion of the jobs survey and it is a seasonally adjusted guess. There really is no alternative but to make this estimate, but at the beginnings of recessions it always overestimates the number of jobs, and at the beginnings of recoveries it will underestimate them.
Remember the “jobless recovery” of 2002-2004? Eventually (several years later) the BLS gets hard data from tax and other sources and goes back and revises the employment numbers. No one cares, because it is “old news.” But we can now look back and see the jobless recovery we thought we were in was not all that bad. The birth/death estimates decidedly understated the growth that was going on at the time.
That may be the case now, too. The much stronger state and household surveys suggest that we *may* be at the beginning of a labor recovery that will be understated by the establishment survey, as the birth/death model just won’t catch that growth. If this pattern continues for the next few months, I think we should begin to pay more attention to the state and households surveys. Let’s hope it does.
That being said, the level of reported increases is not showing up in the income tax reports. There may be several reasons for that, one of which is that people are going back to work for less money and thus paying less taxes. And that would make sense, as there are now five out of work people seeking jobs for every job opening. The employers have the negotiating power.
Businesses are cautiously building inventories and bringing people back to work. Sales-to-inventory levels are not out of line and suggest we may see more inventory building this quarter, which will directly help boost GDP. Retail sales growth is modest by previous recovery standards, but there is at least growth.
The Headwinds of Money Supply
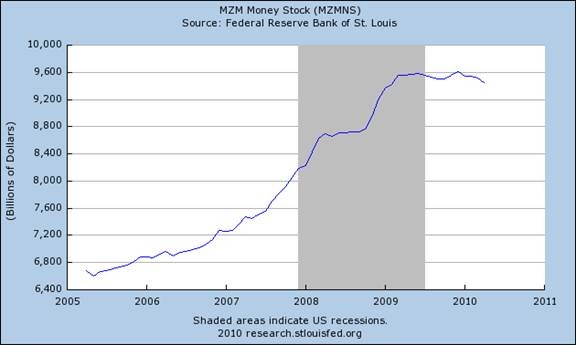
But (and you knew there would be a but coming), there are some headwinds we need to deal with before we can sound the all-clear horn. First, growth in the money supply is slowing. Let’s look at the measure of money supply called MZM, or Money of Zero Maturity. Notice it was flat for well over a year and actually down the last two months.
A broader measure of money is M2. Notice that it too has flat-lined for well over a year. If we look at the last 30 years, there is nothing you can see in the chart that even comes close to this.
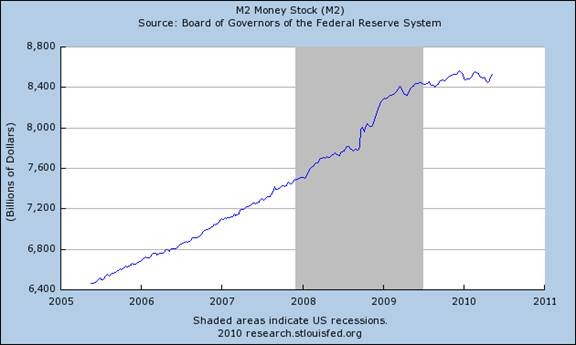
I don’t have access to a graph of M3, though it is still produced by several groups (the Fed stopped several years ago), but that chart would show that even M3 has gone negative. Remember the conspiracy guys who thought the Fed stopped reporting M3 because they thought the Fed wanted to hide the fat that it was going to increase the money supply by large amounts and destroy the dollar? Hardly. The economists at the Fed simply felt for a number of very public reasons that M3 doesn’t have any real meaning any more. They have a strong case, although I never understood why they just didn’t go ahead and keep publishing it anyway. It was just a few computers programs. But what do I know?
Now, notice that with both graphs you see a large increase beginning in the middle of 2008 as the Fed pumped the money supply in order to inject liquidity into the system. This was basically the $1.25 trillion purchase of mortgages, but toward the end even that was not boosting the money supply as much as it did in the beginning. Why? Partially, because of the following graph.
This shows total commercial lending at US banks. It is down almost 25% in less than a year and a half. Notice that in the last recession commercial lending dropped by “only” 18% in 3.5 years.
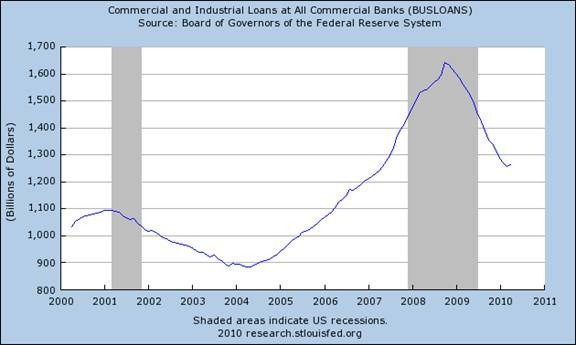
Lending to consumers is also down in a similar fashion. Notice that money supply begins to go flat in 2009, just a little after bank lending dried up.
Remember our old friend the equation that GDP is equal to the money supply times the velocity of money (GDP=MV)? If GDP is growing and the money supply is slowing, that means the velocity of money is starting to turn back up. That would be a good thing, but we must be somewhat cautious, in that the velocity of money is mean reverting over time, and it is still well above its mean. If it started to once again slow down, as it has for several years now with the current slow or no growth in the money supply, that would not be good for GDP growth.
As a practical matter, that means the Fed will not be reducing its mortgage holdings any time soon. They will wait until it is obvious that a recovery is firmly entrenched. I don’t see how they can risk reducing the money supply any more than they already have, especially given the next few charts.
Who Stole the Inflation?
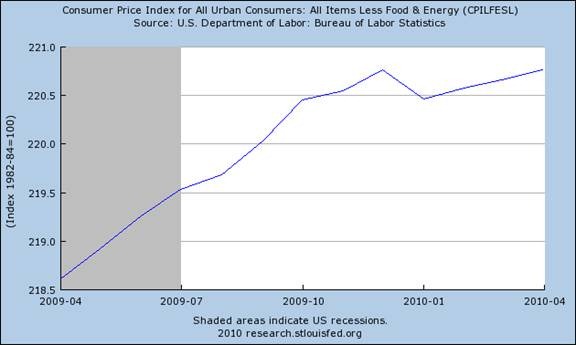
Inflation just isn’t what it used to be. Core inflation is basically flat over the last year. We haven’t seen that since the ’50s. Since the beginning of 2009 it is only up around 0.1%.
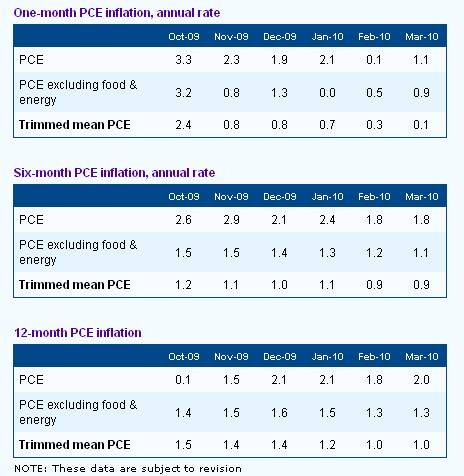
About five years ago, the Dallas Fed developed a new methodology for measuring inflation, called the Trimmed Mean PCE. It was developed by Dallas Fed economist Jim Dolmas.
Dolmas notes (quite correctly, I think) that to exclude food and energy, just because they are volatile, ignores that other quite volatile measures of inflation are still left in. Further, energy and food inflation do have meaning in the real world.
What Dolmas does is use a statistical device called “trimming.” From the field of statistics, trim analysis borrows the idea of ignoring a few “outliers.” A trimmed mean, for example, is calculated by discarding a certain number of lowest and highest values and then computing the mean of those that remain.
How accurate is his measure? Dolmas suggests it is a lot more accurate: “That is to say, compared to the usual … measure, on average the monthly Trimmed mean measure would be expected to come closer to true monthly core inflation by roughly .75 of a percentage point, when the inflation rates are expressed in annual terms.” That is huge, at least in my book, especially when we look at how great the difference is with the Fed’s favorite methodology.
In 2006, the trimmed-inflation methodology suggested the core inflation was understating inflation. Today, the same methodology suggests that core inflation is overstating inflation. Look at the tables below, which were last updated in March. The trends in inflation are clearly down, and when the April data comes out it will be down again.
My good friend David Rosenberg pointed out this morning a new study by the Cleveland Fed on inflation, which concludes that: (i) the decline in recent months has transcended the housing effect; and, (ii) the principal risk is for a further slowing. Treasury yields are likely headed even lower. The title of the report is Are Some Prices in the CPI More Forward Looking Than Others? We Think So, by Michael F. Bryan and Brent Meyer. It’s well worth a read. ( http://www.clevelandfed.org/Research/commentary/2010/2010-2.cfm)
“Abstract: Some of the items that make up the Consumer Price Index change prices frequently, while others are slow to change. We explored whether these two sets of prices – sticky and flexible – provide insight on different aspects of the inflation process. We found that sticky prices appear to incorporate expectations about future inflation to a greater degree than prices that change on a frequent basis, while flexible prices respond more powerfully to economic conditions-economic slack. Importantly, our sticky-price measure seems to contain a component of inflation expectations, and that component may be useful when trying to gauge where inflation is heading.
“Conclusion: Where is inflation heading? Well, the last FOMC statement held the view that ‘inflation is likely to be subdued for some time.’ We certainly don’t have reason to question that outlook. Indeed, while the recent trend in the core flexible CPI has risen some recently (it’s up 3.3 percent over the past 12 months ending in March) the trend in the core sticky-price CPI continues to decline. Even excluding shelter, the 12-month growth rate in the core sticky CPI has fallen 1.1 percentage points since December 2008, down to 1.8 percent in March. So on the basis of these cuts of the CPI, we think ‘subdued for some time’ sums up the price trends nicely.”
And speaking of the latest minutes from the last Fed meeting, which came out this week, let’s review a paragraph.
“In light of stable longer-term inflation expectations and the likely continuation of substantial resource slack, policymakers anticipated that both overall and core inflation would remain subdued through 2012, with measured inflation somewhat below rates that policymakers considered to be consistent over the longer run with the Federal Reserve’s dual mandate.”
The Fed Is On Hold
Let’s review. Economists tell us it will take GDP growth rates of 3.5% or more to have any real impact on employment. As I have noted elsewhere, that is 300,000 jobs a month for five years to get us back to where we were in 2007. Losing 8 million jobs is a big hole. What are the prospects for 3.5% GDP growth, with high unemployment and large tax increases coming in 2011from not only the Fed but state and local governments? My thought is, not so great.
The trend in inflation is down. Unemployment is way too high. The money supply is somnolent.
The Fed is on hold for the rest of the year and well into 2011.
Case closed.
An Inverted Yield Curve?
A quick thought on inverted yield curves. As long-time readers know, I have written extensively about research done on the inverted yield curve, that condition where short-term rates are higher than long-term rates. It is the best single indicator of recessions, and following it allowed me to “predict” the last two recessions a year in advance. We won’t go now into why it seems to work, but it is useful, or has been in the past.
Clearly, if the Fed is on hold for at least another year, it will be impossible for quite some time to get an inverted yield curve. Obviously, long-term rates will not go below zero. Yet long-term rates are headed down of late, and are lower than they were when we last had an inverted yield curve in 2006. What would the yield curve look like without the Fed massively intervening? Is there a way to “normalize” the short-term rates that would give us a proxy for short-term rates without active Fed intervention? Would it matter? If you have any thoughts on that topic, feel free to share.
LA, Vancouver, San Francisco, and a First
Often Wrong, Seldom in Doubt
I am off to LA tomorrow with son-in-law Ryan to meet with the team at Fahrenheit Studios that is helping us design the new websites. Then home for ten days, and then it’s some much-needed vacation time with the family (kids and spouses and grandbabies – a total of 12 of us), to Italy.
I will be speaking at the Agora Financial Investment Symposium in Vancouver July 20-23rd. There are some really great speakers and this is a fun crowd. I got them to knock off $200 for my readers if you use the link and order form below. You can find a link to the list of speakers a little ways into the link. Hope to see you there!
http://agorafinancial.com/reports/vancouver/2010/vancouver2010_2.php?pub=C2010AFVAN&code=E400L5NC
I will also be speaking at the San Francisco Money Show August 19-21. I will have more on that show in the coming weeks, and links for registration.
And a big thanks to Greg Buoncontri and his team at Pitney Bowes. I spoke there last Wednesday and was made to feel quite special. It was a very upbeat conference with great speakers on how the world is changing. I learned a lot.
Finally, after ten years of writing this letter, I had a first tonight. At 9:30 I realized what I was writing was just not ready for prime time. You can’t take the cake out of the oven until it is fully baked. I have had some half-baked ideas before, but never knowingly. As I say, I am often wrong but seldom in doubt. I really thought I knew where I was going, but the longer I thought and the more I wrote the more I kept disagreeing with myself. I still think there is some meat in the topic, but I need to think some more on it. You, gentle reader, deserve nothing less. I take this letter seriously.
I had to stop, pour myself some scotch, take a deep breath, and start over with a brand new topic. And since I haven’t written about Fed policy for some time, a letter on it was due. It is now 1 AM and past time to hit the send button. Let’s hope this doesn’t happen for another ten years.
Your ready to begin to slow down (at least for tonight) analyst,
John Mauldin

Note: The generic Accredited Investor E-letters are not an offering for any investment. It represents only the opinions of John Mauldin and Millennium Wave Investments. It is intended solely for accredited investors who have registered with Millennium Wave Investments and Altegris Investments at www.accreditedinvestor.ws or directly related websites and have been so registered for no less than 30 days. The Accredited Investor E-Letter is provided on a confidential basis, and subscribers to the Accredited Investor E-Letter are not to send this letter to anyone other than their professional investment counselors. Investors should discuss any investment with their personal investment counsel. John Mauldin is the President of Millennium Wave Advisors, LLC (MWA), which is an investment advisory firm registered with multiple states. John Mauldin is a registered representative of Millennium Wave Securities, LLC, (MWS), an FINRA registered broker-dealer. MWS is also a Commodity Pool Operator (CPO) and a Commodity Trading Advisor (CTA) registered with the CFTC, as well as an Introducing Broker (IB). Millennium Wave Investments is a dba of MWA LLC and MWS LLC. Millennium Wave Investments cooperates in the consulting on and marketing of private investment offerings with other independent firms such as Altegris Investments; Absolute Return Partners, LLP; Fynn Capital; Nicola Wealth Management; and Plexus Asset Management. Funds recommended by Mauldin may pay a portion of their fees to these independent firms, who will share 1/3 of those fees with MWS and thus with Mauldin. Any views expressed herein are provided for information purposes only and should not be construed in any way as an offer, an endorsement, or inducement to invest with any CTA, fund, or program mentioned here or elsewhere. Before seeking any advisor’s services or making an investment in a fund, investors must read and examine thoroughly the respective disclosure document or offering memorandum. Since these firms and Mauldin receive fees from the funds they recommend/market, they only recommend/market products with which they have been able to negotiate fee arrangements.
The days of drilling a hole beneath the soil in Texas, inserting a pipe and watching oil gush out are gone. We’re never going back to those days.
It gets into what we’re dealing with here in the search for deep sea oil… The energy industry has to go deeper and deeper to make things work. Risking more and more capital – and unfortunately, lives – along the way.
Deepwater Disaster Doesn’t Change Need for Deepwater Drilling
Gary Gibson: Byron, can you start off by telling Whiskey readers a little about why we’re searching for deep sea oil in the first place? I mean, we know about peak oil already. But… is it really THAT bad that we’re having to search for oil buried beneath 12,000 feet of water? And after the water, another 10,000 feet of dense rock? That’s a lot of risk to take. Seems to be proof for the end of cheap oil theory, right?
Byron King: Exactly. The days of drilling a hole beneath the soil in Texas, inserting a pipe and watching oil gush out are gone. We’re never going back to those days.
It gets into what we’re dealing with here in the search for deep sea oil… The energy industry has to go deeper and deeper to make things work. Risking more and more capital – and unfortunately, lives – along the way.
Look at what we’ve seen in the last 20 years or so, since 1990, when the oil industry really started to go deep. There was something like an “arms race” to develop better and better deepwater technology, to go for the next levels down. We’ve seen this race to deeper and deeper water. And it’s all because the so called “cheap oil” is gone.
It used to be that drilling at 1,000 feet water depth was the edge of technology! You know, back then in the early 1990s it was 1,500 feet, then it was 2,500 feet, then it was 5,000 feet…7,500, 10,000. Now they’re drilling at 12,000 feet of water.
It’s doable. But it’s mind-blowing as well. I mean, 12,000 feet of water is where the Titanic sits. That’s how deep that water is. Let me stress: 12,000 feet is really deep water. So in 20 years, we’re gone from 1,000 to 12,000 feet: huge, huge technological leap. And the only thing that lets you do that is technology.
In the same sense you have a much, much better computer today than you did in 1990, you have much better offshore drilling equipment today than you did in 1990. You have bigger, better rigs. You have more powerful rigs. You have far better positioning, far better station keeping. You got much stronger steel. You’ve got better pipe. The way they do these risers is just astonishing. Risers are not just pieces of steel pipe. These risers are an entire, complex mechanical and hydraulic system that connects the drill ship on the surface with the workings on the sea floor 2 miles down. These things are incredible specimens of engineering.
Keeping with the risers, they’re wrapped in this stuff called syntactic foam. THis foam is super high-tech stuff. It keeps the risers buoyant. So you have riser sections that, in the air, weigh many, many tons. But in the water, it’s essentially buoyant. You can push the risers around with a little remote operating vehicle with a couple of little propellers on the back of it. So this stuff is really astonishing.
Gary: OK, so all this new technology is needed. The risks seem great. They obviously wouldn’t be doing this if the reward of finding new oil wasn’t great. But with the recent disaster in the gulf, the question on everyone’s mind is… what happens when that technology fails? So can you shine a little more light on the disaster itself. Starting maybe with all the players involved? I know you’ve recommended a lot of these deep-sea oil companies in your paid Outstanding Investments newsletter…..
…..read more HERE
Market Buzz – Seacliff Proves to be Another KeyStone Winner – Bought out at
$17.14, up 114%!
The much anticipated and long overdue (in our opinion) sell-off continuedthis week as the S&P/TSX Composite hit new 14-week lows at one point, before recovering somewhat, Friday to close down just over 4% on the week.
In the US, The Dow Jones industrial average rose 125 points by the close on Friday, after falling below 10,000 in morning trading.
The volatility comes after major indexes entered “correction” mode, having dropped more than 10% from their 2010 highs set last month. The gains on Friday technically pulled the Dow back out of correction territory and left it down 9% from its peak. The volatility stems in part from worries about how Europe is handling its debt crisis.
Fear will continue to rule the day as the markets are uncertain as to their next move.
But from fear comes opportunity. We expect these opportunities to present
themselves in the form of good companies that have or will sell-off in
sympathy with the broader market and present great long-term entry points. In fact, we have a number of companies on our radar screen at the moment and are looking for appropriate entry points over the coming months.
However, all was not negative this past week. We are happy to report that one of our top selections from 2009, Seacliff Construction Corp. (SDC:TSX), announced it was being bought out in an all-friendly takeover.
Early Monday morning, Vancouver-based Seacliff announced that The Churchill Corporation and Seacliff had entered into an arrangement agreement whereby Churchill will acquire, pursuant to an arrangement under the Business Corporations Act, all of the issued and outstanding common shares of Seacliff for total cash consideration, on a fully diluted basis, of approximately $390 million, which includes approximately $10 million of indebtedness. Under the terms of the arrangement, Seacliff shareholders will receive $17.14 in cash for each Seacliff common share.
Seacliff was recommended to our clients in April 2009, when the stock traded at $8.00. The takeover price represents a tremendous gain of over 114% (excluding dividends) in one year’s time.
Seacliff is one of the largest and most diversified construction companies
in Western Canada providing general contracting construction services and
electrical contracting services to a wide array of clients in both the
public and private sectors, including government agencies, municipalities,
corporations, property managers and developers.The much anticipated and long overdue (in our opinion) sell-off continued this week as the S&P/TSX Composite hit new 14-week lows at one point, before recovering somewhat, Friday to close down just over 4% on the week.
In the US, The Dow Jones industrial average rose 125 points by the close on Friday, after falling below 10,000 in morning trading.
The volatility comes after major indexes entered “correction” mode, having dropped more than 10% from their 2010 highs set last month. The gains on Friday technically pulled the Dow back out of correction territory and left it down 9% from its peak. The volatility stems in part from worries about how Europe is handling its debt crisis.
Fear will continue to rule the day as the markets are uncertain as to their next move.
But from fear comes opportunity. We expect these opportunities to present themselves in the form of good companies that have or will sell-off in sympathy with the broader market and present great long-term entry points. In fact, we have a number of companies on our radar screen at the moment and are looking for appropriate entry points over the coming months.
However, all was not negative this past week. We are happy to report that one of our top selections from 2009, Seacliff Construction Corp. (SDC:TSX), announced it was being bought out in an all-friendly takeover.
Early Monday morning, Vancouver-based Seacliff announced that The Churchill Corporation and Seacliff had entered into an arrangement agreement whereby Churchill will acquire, pursuant to an arrangement under the Business Corporations Act, all of the issued and outstanding common shares of Seacliff for total cash consideration, on a fully diluted basis, of approximately $390 million, which includes approximately $10 million of indebtedness. Under the terms of the arrangement, Seacliff shareholders will receive $17.14 in cash for each Seacliff common share.
Seacliff was recommended to our clients in April 2009, when the stock traded at $8.00. The takeover price represents a tremendous gain of over 114% (excluding dividends) in one year’s time.
Seacliff is one of the largest and most diversified construction companies in Western Canada providing general contracting construction services and electrical contracting services to a wide array of clients in both the public and private sectors, including government agencies, municipalities, corporations, property managers and developers. www.keystocks.com
Looniversity – Insider Trading
In the markets, there are two types of insider trading: legal and illegal. Because it’s no fun hearing about what you can do, let’s talk about what you can’t. Essentially, this is the buying or selling of a security by insiders who possess material, non-public information about the security. The act puts insiders in breach of a fiduciary duty or other relationship of trust and confidence.
A common misconception is that only directors and upper management can be convicted of insider trading. However, anybody who has material and non-public information can commit insider trading. This means that almost everybody can be considered an insider, including brokers, family, friends, employees, and yes, even you.
Having said this, there is an important thing to distinguish here: insiders don’t always have their hands tied. In fact, insiders can and do buy and sell stock in their own companies all the time, but they are restricted as to when they can execute their buy and sell orders.
In terms of legal trading, the OSC considers insiders to be company directors, officials, or any individual with a 10% or more stake in the company. Canadian company insider trading statistics can be found on the web at www.stockwatch.com (subscription), while U.S. company data is available for free on Yahoo! Finance.
Put it to Us?
Q. What do I do when a “disaster” befalls a stock I own?
– Erika Bernard; Toronto, Ontario
A. Through the course of normal business operations, companies can be stricken by extraordinary events-natural disasters, product recalls, andspecific product liability suits, for example. The common response of investors to such events is to sell without taking a rational look at what has really happened. This forces stock prices down-often significantly-in a short period of time.
When confronted by this type of reactionary selling, investors need to look past the noise and address a singular issue: Are the fundamentals of the company different than they were before the event? If the answer is no, meaning there is no indication that the company will be unable to generate earnings and operate in the same manner as it has been, there is no reason to sell. In fact, the fall in price may represent an opportunity to buy more of the stock at a discount. However, if management negligence led to the disaster, or if the earnings-generating potential of the firm has been impaired, the prudent move might be to sell.
KeyStone’s Latest Reports Section
- Infrastructure Construction Company Receives Takeover Bid at $17.14,
Shares Surge & KeyStone Clients Pocket 114.25% Gains in One Year, Close out
Position – SELL (Flash Update) <http://keystocks.com/ReportRequest.aspx> - Healthcare/Hospitality Service Trust Posts Solid Q1 2010, Total
Return Approaching 100%, Yield Remains Solid at 7.23%, Near-Term Organic
Growth Challenging – Rating Maintained (Flash Update)
<http://keystocks.com/ReportRequest.aspx> - Alternative Financial Services Provider Posts Solid Q3 2010 Revenue
& EPS Growth, Aggressive Growth Plan Intact, Stock Gains Over 152% in 10
Months – Near-Term Rating Change (Flash Update)
<http://keystocks.com/ReportRequest.aspx> - Diversified Mining & Environmental Drilling Company Posts Resilient
2009, Solid Fundamentals Relative to Peers, Produces 74% Share Price Gain in
Eight Months – Long-term Rating Upgraded (Flash Update)
<http://keystocks.com/ReportRequest.aspx> - Canada’s Leading Industrial Services Firm Posts Solid Q1 – Rating Maintained (Flash Update) <http://keystocks.com/ReportRequest.aspx>
Stockscores.com Perspectives for the week ending May 21, 2010
In this week’s issue:
Weekly Commentary
Strategy of the Week
Stocks That Meet The Featured Strategy
![]()
The market is always changing and yet the more it changes, the more it stays the same. Market participants are still guided by fear and greed, some people still get better information than others and emotion still causes prices to behave irrationally.
However, as technology has allowed more and more people to be involved in the stock market I do think that much has changed. The market moves quicker and with much greater volatility than it has ever achieved before.
And so, while the basic principles that have guided my strategies over the last 20 years have not changed, I am always modifying and adapting those strategies to fit with the current market. This week, I want to provide some insight on how I go about creating a new trading strategy.
First comes the idea; it should be possible to explain a trading strategy in one or two sentences. In light of the current volatility amidst a lack of trend, I might seek to create a strategy that buys weakness and sells strength. As the market gyrates back and forth inside a trading range, this approach would buy when fear has caused people to accept to low of a price and sell when greed kicks in and prices run up too quickly. Watching the way that the market has traded over the past few weeks, I expect this would yield good results. Continued…….
- Get the StockSchool Pro Free

DisnatDirect named the number one Canadian brokerage for Traders by Surviscor! Open and Fund a brokerage account with DisnatDirect and receive the StockSchool Pro home study course free, including special Pro level access through the DisnatDirect client website. Offer only available to Canadian residents. For information, click HERE
- Get the StockSchool Pro Free
However, thinking that something will work and knowing that it will work are two very different things. So next, I must create some rules for my news strategy and test them. At this point, my rules will have some flexibility because I won’t really know what variables are going to work best. I typically spend a few hours going through charts looking for patterns that seem to occur repeatedly and try to find common characteristics for money making moves.
I fine tune the rules for entry, risk management and exit as I work through this process and eventually have a set of criteria that appears to be sound. Next, I do some formal testing to put performance numbers to the strategy using historical data. I build an Excel spreadsheet and calculate the risk versus reward of entry signals that I find from the historical testing. What was the risk, what was the reward, how often did it work, how often it failed and at what point is it best to consider the trade a failure and exit at a loss are all questions I want to answer.
This formal testing will often further define the trading rules for the strategy, the rules will often change as the testing data shows weaknesses and strengths in the strategy. Some times this testing will just show that the strategy is not working and I have to throw out the idea and start over.
But, assuming the historical testing demonstrates that the strategy has a positive expected value, I will then go to paper trading the strategy. The problem with historical testing is that we have the benefit of hindsight and there is a bias, no matter how hard you try to avoid it, in how you judge information as you apply the rules of the strategy. When you are paper trading a strategy in real time, you have no idea of what will happen and so you have to really stick to the rules as you have defined them. Again, at this stage a strategy may show itself to be a loser and the process is stopped or at least the rules may be altered. However, if the strategy continues to work on paper then I can go to the final stage in testing which is to actually trade it with real money.
Paper trading has issues that tend to make the performance of a strategy better than they can ever be. With paper trading there is no emotion. With paper trading, there is no slippage. I have found that a successful paper trading strategy has to have an expected value that is much more positive than you think it would need to be because emotion and slippage hurts performance. A strategy that should yield 4 to 1 risk reward might only end up paying 2 or 3 to one in real market trading.
So, when I am testing a strategy with real money I only take a small amount of risk. So much of trading success relates to confidence and emotional control and I have found that putting too much risk in to a strategy in the beginning can often hinder my ability to make that strategy effective in the real market. By starting with a small amount of risk I can further develop the strategy at a lower cost. Mistakes are inevitable in the early stages of applying a new strategy.
If the strategy is working and making me money, I will begin to increase the amount that I risk on each trade. Confidence in the rules of the strategy makes it easier to apply the rules with discipline. The process of gathering momentum must be slow at first to avoid mental breakdowns that hurt performance.
There are many places in this process where a potential new strategy can fail and the idea tossed away. Most of my trading ideas never make it to be a strategy that I will use over the long run, but the work in building a new trading strategy is rewarded when I finally find something that is effective. I find it to be a fun process and hope that many of you will spend some time to work through it.
![]()
Another big week to the downside but there are signs that the market is likely to bounce back from oversold conditions. Traders who can be nimble and make quick trades can take advantage of this bounce but I recommend that more conservative traders stay on the sidelines. The price volatility should continue as investor uncertainty remains high.
The reasons I think the market is likely to bounce back are as follows. First, the downward price action has taken stocks far below their downward trend line. Consider the chart of SPY below. If you draw a line from the high of April across the peak from about May 12th, you can see that prices have fallen away from that line. Markets tend to regress back to their trend line.
Second, the S&P 500 (SPY chart below) hit support from the lows of early February.
Finally, the markets opened weak on Friday but rallied back to close up for the day and above the open. That is a strong signal of a bounce, something I call a Dead Cat Bounce.
The issue from a trading perspective is whether the reward of the trade justifies the risk. To buy at Friday’s close has support at the low of the day. The reward potential up to resistance at that downward trend line that I drew is about the same distance as the distance down to support. That means the reward potential for the risk is about one to one. I like to take trades that have reward for risk of two to one.
I entered this trade early on Friday morning before the market had really made a comeback from weakness so the distance to support was much less and the distance to resistance was much greater. That gave a better reward for risk profile and made the trade worth taking.
Looking ahead to next week, I recommend traders watch the SSO, UCO, QLD, DDM and T.HXU for intraday pattern set ups that have good reward for risk profile. By watching the intraday, 15 minute charts, you can enter on a predictive pattern with a much tighter stop to have a good reward for risk outlook.
![]()
1. SPY

2. SSO

3. QLD
4. DDM
5. T.HXU
References
Get the Stockscore on any of over 20,000 North American stocks.
Background on the theories used by Stockscores.
Strategies that can help you find new opportunities.
Scan the market using extensive filter criteria.
Build a portfolio of stocks and view a slide show of their charts.
See which sectors are leading the market, and their components.
Click HERE for the Speaker Lineup and to Purchase the video if you want to learn from some of the worlds best traders including Tyler Bollhorn.

Tyler Bollhorn started trading the stock market with $3,000 in capital, some borrowed from his credit card, when he was just 19 years old. As he worked through the Business program at the University of Calgary, he constantly followed the market and traded stocks. Upon graduation, he could not shake his addiction to the market, and so he continued to trade and study the market by day, while working as a DJ at night. From his 600 square foot basement suite that he shared with his brother, Mr. Bollhorn pursued his dream of making his living buying and selling stocks.
Slowly, he began to learn how the market works, and more importantly, how to consistently make money from it. He realized that the stock market is not fair, and that a small group of people make most of the money while the general public suffers. Eventually, he found some of the key ingredients to success, and turned $30,000 in to half a million dollars in only 3 months. His career as a stock trader had finally flourished.
Much of Mr Bollhorn’s work was pioneering, so he had to create his own tools to identify opportunities. With a vision of making the research process simpler and more effective, he created the Stockscores Approach to trading, and partnered with Stockgroup in the creation of the Stockscores.com web site. He found that he enjoyed teaching others how the market works almost as much as trading it, and he has since taught hundreds of traders how to apply the Stockscores Approach to the market.
Disclaimer
This is not an investment advisory, and should not be used to make investment decisions. Information in Stockscores Perspectives is often opinionated and should be considered for information purposes only. No stock exchange anywhere has approved or disapproved of the information contained herein. There is no express or implied solicitation to buy or sell securities. The writers and editors of Perspectives may have positions in the stocks discussed above and may trade in the stocks mentioned. Don’t consider buying or selling any stock without conducting your own due diligence.
-
I know Mike is a very solid investor and respect his opinions very much. So if he says pay attention to this or that - I will.
~ Dale G.
-
I've started managing my own investments so view Michael's site as a one-stop shop from which to get information and perspectives.
~ Dave E.
-
Michael offers easy reading, honest, common sense information that anyone can use in a practical manner.
~ der_al.
-
A sane voice in a scrambled investment world.
~ Ed R.
Inside Edge Pro Contributors

Greg Weldon

Josef Schachter

Tyler Bollhorn

Ryan Irvine

Paul Beattie

Martin Straith

Patrick Ceresna

Mark Leibovit

James Thorne

Victor Adair