
Daily Updates
……that the advance from the June lows was simply an extension of the primary bull market.”
Brief Excerpt from Richard Russell’s Dow Theory Letters. One of the best values anywhere in the financial world at only a $300 subscription to get his DAILY report for a year. HERE to subscribe. Amongst his achievements Richard was in cash before the 2008/2009 Crash and he has been Bullish Gold since below $300 Ed Note: Richard Russell is bullish Silver and holds one of the largest single positions he has held since the 1950’s in the precious metals.
July 26, 2010 — Whenever the market becomes a puzzle to me, I invariably depend on my “market bible,” the Dow Theory. I’m now going to quote from the book, The Dow Theory, written by the Dow Theory genius, Robert Rhea.
“The movements of both the Railroad (ed. now the Transport) Average and Industrial Stock Averages should always be considered together. The movement of one price average must be confirmed by the other before reliable inferences may be drawn. Conclusions based on the movement of one average, unaccompanied by the other, are almost certain to prove misleading.”
To refresh your memory, the lines below are from my site of July 9th.
Here’s where things get interesting. Both Averages proceeded to rally to highs — then they turned down again. On June 7, 2010, the Dow closed below its February 2010 low with a 9816.49 close, continuing to move lower over the course of the month. The Transports did not confirm — and still have not confirmed.
When the Dow broke to new lows on the move and the Transports refused to confirm, we experienced a sharp reversal to the upside.
Now let’s bring the whole picture to the present. As of Friday (July 25th) , the Industrial Average sat at 10424.6, a mere 26 points below10450.64. With my PTI bullish and pushing higher with positive momentum behind it, the Dow may shortly rally to close above its June high.
However, the Transports closed Friday (July 25th) at 4369.71, a full 98 points below their June high. Obviously the Transports could put on a sudden surge and confirm a potential new high in the Industrials, but let’s just wait to see the movements of the Averages actually played out.
July 26th Late Notes:
The Dow was up 100.81 to 10525.43. (74.79 above the June high 10450.64)
Transports were up 112.38 at 4482.09 ( 14.38 above the June high of 4,467.71)
The Industrials and Transports closed cleanly and decisively above their June highs, telling us that the advance from the June lows will be extended. In the big picture, we now know that the advance from the June lows was simply an extension of the primary bull market. I don’t have to go into the “internals” of today’s rally, the internals were uniformly good. My PTI was right all along, it never did close and remain decisively negative. PTI was up 7 today, leaving it bullish by 36 points, highest bullish count in months.
“they both close above their June highs, it will be particularly noteworthy, because simultaneous confirmations imply a special power.”
Question — Russell, how can yo be bearish and in a few weeks change your mind?
Answer — I base my opinions on the action of the stock market. When the stock market changes its position, I change mine. When the facts change, I change. That’s a major part of my job, and why I’ve been able to stay in business since 1958.
July 27, 2010 — “The world has been turned upside down. I guess that’s what you might think if you read yesterday’s site. But no, it’s the same old world. The difference is that on Wall Street we received a Dow Theory bull signal yesterday. This occurred when both the Industrial and Transport Averages broke out to close decisively and simultaneously above their June highs.
I’ll admit it — I really didn’t expect it. But the stock market doesn’t arrange itself to live up to Richard Russell’s expectations. The stock market is a law unto its self. The stock market owes me or anyone else nothing. The FACT is that the situation has changed. In breaking out above their June highs, the Averages are saying that the market trend has reversed from down to up. Argue with that at your own risk.”
Ed Note: Richard Russell is bullish Silver and holds one of the largest single positions he has held since the 1950’s in the precious metals.
Richard Russell: Granddaddy of the Investment Newsletter Industry
We evaluate here the stock market forecasts of Richard Russell, mostly since mid-2002. Evaluated predictions/recommendations come indirectly via MarketWatch columns, which have tracked his commentary closely in recent years. Richard Russell has since 1958 been editor-publisher of the Dow Theory Letters, which “cover the U.S. stock market, foreign markets, bonds, precious metals, commodities, economics — plus Russell’s widely-followed comments and observations and stock market philosophy.”
Here are additional notes to augment the tabular summary:
From Peter Brimelow in MarketWatch (8/6/07): “According to the Hulbert Financial Digest, Russell is tied for top place as a market timer on a risk-adjusted basis since 1980.”
From Peter Brimelow in MarketWatch (7/20/06): “Over the period since the Hulbert Financial Digest began, in mid-1980, Russell has been the top-performing market timer on a risk-adjusted basis.”
….read more Richard Russell: Granddaddy of the Investment Newsletter Industry
So said Donald J. Poitras in an email he sent me after reading an updated version of a recent article by me about the possible impact the historical gold:silver ratio could have on the price of silver should gold go parabolic to various levels. With Poitras’ permission I present below, in a reformatted and edited version, his views on why he believes there are other sound reasons why silver, in and of its self, can expect to experience a “percentage gain of extraordinary magnitude” in the years to come. As Poitras sees it:
These Facts About Silver Say It All
a) Diminishing Supply: Increasing Demand
– Only 600 million ounces of silver are mined yearly yet industrial demand, with new uses being implemented every year, is currently over 900 million ounces per year.
– Investment demand for physical silver has exploded with the advent of silver ETFs and the increase in actual ownership of the physical metal by interested parties worldwide. China, for example, is now encouraging its citizens to own silver. Demand is such in the U.S. that he U.S. mint is rationing silver coins.
– Total known world above-ground silver inventories have declined by more than 98% in the past 75 years.
b) Massive Short Position Exists
– Silver has a massive short position, probably greater than any commodity in history. If one factors in short positions on COMEX and the leasing of silver by bullion banks, banks and brokers selling silver certificates and other silver instruments with no silver to back them then it is quite possible that hundreds of millions – perhaps even billions – of ounces of silver are sold on paper that do not physically exist.
c) Inground Silver Is Limited and Will Become Much More Expensive to Mine
– The average occurrence of silver in igneous rock (igneous rock composes ~92.5% of the earth’s crust) is 0.07 PPM or 0.07grams of silver per metric ton of igneous rock, which means that on average 444.3 metric tons of igneous rock must be mined to obtain 1 troy oz of silver (1 metric ton/.07gram Ag)*(31.1gram/1troy oz)!
– Because of the geological phenomenon of epithermal deposition, very little silver remains underground.
– Only the recycling of silver-containing products, the mining of scarce surface silver veins and the silver by-product of base metal mining can provide fairly cheap silver.
– Silver is not found in placer deposits like gold but in veins and these silver veins are formed as epithermal depositions or condensation near the earth’s surface (like whipped cream on the surface of coffee). Simply put, the richest silver deposits are nearest the surface of the earth, and the deeper mines go, the less silver they tend to produce. Economically, the deeper the mine, the more expensive the silver is to obtain.
The Result: The Price of Silver Can Only Increase – Dramatically!
– As current silver is depleted from the abovementioned epithermal deposits and mined deeper at much lower grades (approaching 0.07 grams per metric ton), the costs of mining silver must skyrocket and consequently the price of silver must explode.
The stage is set for a silver price percentage gain of extraordinary magnitude! It is time to embrace the new refrain “Got silver?”
Lorimer Wilson is the Editor of both www.FinancialArticleSummariesToday.com (a sight/site for sore eyes and inquisitive minds) and www.munKNEE.com (a site consisting of edited excerpts of the internet’s most informative articles on money matters). He can be reached at editor@munknee.com
What renewable projects would you purchase electricity from?
Renewables (and particularly geothermal) are becoming a more popular talking point amongst utilities and governments these days. Just this week, America’s Geothermal Energy Association said it will tell utilities at an upcoming conference that geothermal power could create $22.5 billion in economic output in the state of Nevada alone.
Others in the southwest U.S. are taking notice of this trend. The Western Governors’ Association (WGA) has been working for some time on its “Renewable Energy Transmission Roadmap”. A study report aimed at helping renewable project developers in the western U.S. permit their power stations, and get them hooked up and producing power.
One of the major deliverables from the report is a list of factors utilities look at when deciding whether to purchase power from a renewable project.
As long-time geothermal investors know, power purchase agreements (PPAs) from utilities are a crucial component of any new project. Under a PPA, a utility agrees to buy a certain amount of power from a project for a certain number of years at a set price.
PPAs are a linchpin part of project development. Often, banks require a PPA before they will debt finance the construction of a power plant. Without an agreement, the facility may never get built.
So it’s crucial to know what utilities look for when deciding who to sign PPAs with.
The recent WGA report suggests a handful of factors. Some are obvious, like power price and the use of proven technology.
But others are more subtle. And may make or break projects over the coming years.
One of the most interesting criteria is developer experience. WGA notes that utilities will likely give PPA priority to groups that have a demonstrated track record in project finance, engineering procurement and facility operation.
This of course makes sense. The last thing a utility wants is to spend time and money on assessing and issuing a PPA, only to see the project die on the operating table due to poor construction or operation.
The implications are intriguing. Groups with a long history of building power plants have a distinct advantage over upstart management teams. By holding greater sway with utilities, experienced groups may be able to get preferred access to PPAs. And thus get projects completed faster and cheaper.
This is one more reason for consolidation in the geothermal space. The value of experience could present an arbitrage, with projects worth more (on a risk-adjusted basis) in the hands of larger companies who have a greater likelihood of getting the job done.
If this advantage does become apparent, large firms will start buying these projects from smaller groups that have done the legwork to assemble the land, complete the exploration and prove technical feasibility. A win-win for all.
Here’s to economies of scale,
Dave Forest
dforest@piercepoints.com
Copyright 2009 Resource Publishers Inc.
Note:
The information provided in this newsletter is based on the independent research of Dave Forest and Notela Resource Advisors Ltd. and is intended solely for informative purposes and is not to be construed, under any circumstances, by implication or otherwise, as an offer to sell or a solicitation to buy or trade any securities or commodities named herein. Information contained in this newsletter is obtained from sources believed to be reliable, but is in no way assured. All materials and related graphics provided in this newsletter and any other materials which are referenced herein are provided “as is” without warranty of any kind, either express or implied. No assurance of any kind is implied or possible where projections of future conditions are attempted. Readers using the information contained herein are solely responsible for verifying the accuracy thereof and for their own actions and investment decisions. Neither Dave Forest nor Notela Resource Advisors Ltd., make any representations about the suitability of the information delivered in this newsletter or any other materials that are referenced herein for any purpose whatsoever. The information contained in this newsletter does not constitute investment advice and neither Dave Forest nor Notela Resource Advisors Ltd. are registered with any securities regulatory authority to provide investment advice. Readers are cautioned to consult with a qualified registered securities adviser prior to making any investment decisions. The information contained in this newsletter has not been reviewed or authorized by any of the companies mentioned herein.
“THE FOREX MARKET IS STARTING THE WEEK QUIETLY now that the long awaited “stress tests” for the European banking system are behind us. On balance, the “Commonwealth” currencies… the Aussie, New Zealand and Canadian dollars alongwith Her Majesty’s British Pound Sterling… are generally doing better, but only modestly so, while the Yen and the EUR are doing a bit worse… again, only modestly so. The summer doldrums are setting in and the markets are preparing for the fact that European trading centres will be shutting down or going to very low levels of participation during the regular August holiday period”. – From the GARTMAN LETTER For a Trial Subscription go to The Gartman Letter)
UNDERSTANDING ROBERT PRECHTER’S ‘SLOPE OF HOPE’

Almost everybody who follows financial markets has heard about climbing the “wall of worry”: the time when prices head up bullishly, but no one quite believes in the rally, so there’s more worry about a fall than a rise.
What’s the opposite condition in the market?
Bob Prechter named it the “slope of hope,” meaning that as prices head down, no one wants to believe the market really has turned bearish, so there’s more hope for a rise than fear of a fall.
Want to Know How to Prosper in a Deflationary Depression? If you haven’t yet given Robert Prechter’s deflation argument your full attention, you should know now that yesterday was the best time to do so. Download Prechter’s 60-Page Guide to Understanding Deflation here.
The market has been rising recently, following a bearish decline from late April through the end of June, which makes now the perfect time to learn more about the slope of hope.
* * * * *
Excerpted from The Elliott Wave Theorist by Robert Prechter, published June 18, 2010
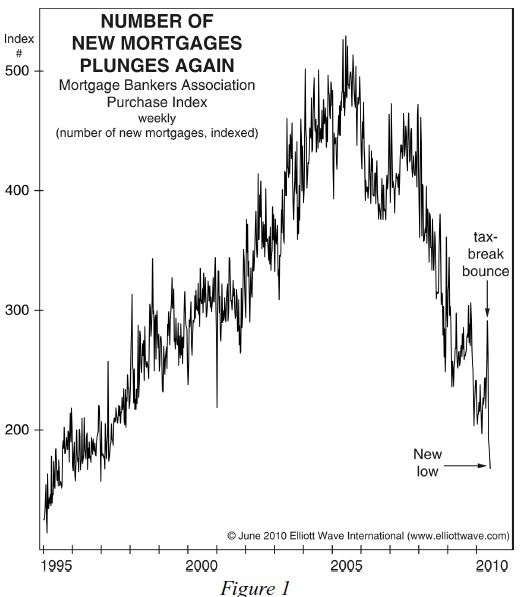
According to polls, economists are virtually unanimous in the view that the “Great Recession” is over and a recovery is in progress, even though “full employment will take time,” etc. Yet mortgage writing has just plunged to a new low for the cycle (see Figure 1), and housing starts and permits just had their biggest percentage monthly drop since January 1991, which was at the end of a Primary-degree recession. But the latest “recession” supposedly ended a year ago. How can housing activity make new lows this far into a recovery? The answer is in the subtitle to Conquer the Crash, which includes the word depression. The subtleties in economic performance continue to suggest that it “was” not a “recession.” It is a depression, moving forward, in punctuated fashion, slowly but inexorably.
Despite this outlook, keep in mind what The Elliott Wave Theorist said last month: “Even though the market is about to begin its greatest decline ever, the era of hope is not quite finished.” For as long as another year and a half, there will be rallies, fixes, hopes and reasons to believe in recovery. Our name for this phase of a bear market is the Slope of Hope. This portion of the decline lasts until the center of the wave, where investors stop estimating upside potential and start being concerned with downside potential. Economists in the aggregate will probably not recognize that a depression is in force until 2012 or perhaps beyond. That’s the year the 7.5-year cycle is due to roll over (see April 2010 issue). Stock prices should be much lower by then, but optimism will still dominate, and it will show up in the form of big rallies and repeated calls of a bottom.
Want to Know How to How to Deal with Deflation? Find out what Bob Prechter thinks about gold and what he suggests as the best antidote to deflation. The latest issue of The Elliott Wave Theorist brings you useful information for your personal financial situation. Details.
This article, Perfect Example of the Slope of Hope,was syndicated by Elliott Wave International. EWI is the world’s largest market forecasting firm. Its staff of full-time analysts lead by Chartered Market Technician Robert Prechter provides 24-hour-a-day market analysis to institutional and private investors around the world.
-
I know Mike is a very solid investor and respect his opinions very much. So if he says pay attention to this or that - I will.
~ Dale G.
-
I've started managing my own investments so view Michael's site as a one-stop shop from which to get information and perspectives.
~ Dave E.
-
Michael offers easy reading, honest, common sense information that anyone can use in a practical manner.
~ der_al.
-
A sane voice in a scrambled investment world.
~ Ed R.
Inside Edge Pro Contributors

Greg Weldon

Josef Schachter

Tyler Bollhorn

Ryan Irvine

Paul Beattie

Martin Straith

Patrick Ceresna

Mark Leibovit

James Thorne

Victor Adair