
Daily Updates
Is there a bubble in the bond market?
The historically low yields on Treasury bonds are the hallmark of a bubble, according to some commentators. This column analyses the relationship between bond yields, the stock market, and inflation over the past 50 years. It finds that the riskiness of nominal bonds changes over time and that investors and policymakers can use the changing stock-bond correlation as a real-time measure of inflation expectations.
The yields on government bonds are at their lowest levels since the depths of the financial crisis in late 2008. On Monday 18 October, the yield on 10-year Treasury notes hit 2.52%, down from 3.85% at the beginning of the year. This movement is huge by the standards of the Treasury market. An investment in 10-year Treasury notes has returned about 11.4% this year.
Moreover, nominal bonds are exposed to inflation risk. Given that the use of unconventional monetary policy has increased uncertainty about inflation (e.g. Taylor 2009), one might expect investors to regard bonds as particularly risky and demand high yields (low prices). The persistence of historically low yields in the face of such risks has led some commentators, notably Siegel and Schwarz (2010), to suggest there is a bubble in the government bond market.
Bond valuation and risk
What determines how much investors are willing to pay for nominal bonds? There are three critical factors:
* expected inflation,
* real interest rates, and
* risk premia.
Global food crisis forecast as prices reach record highs
Cost of meat, sugar, rice, wheat and maize soars as World Bank predicts five years of price volatility
Rising food prices and shortages could cause instability in many countries as the cost of staple foods and vegetables reached their highest levels in two years, with scientists predicting further widespread droughts and floods.
Although food stocks are generally good despite much of this year’s harvests being wiped out in Pakistan and Russia, sugar and rice remain at a record price.
Global wheat and maize prices recently jumped nearly 30% in a few weeks while meat prices are at 20-year highs, according to the key Reuters-Jefferies commodity price indicator. Last week, the US predicted that global wheat harvests would be 30m tonnes lower than last year, a 5.5% fall. Meanwhile, the price of tomatoes in Egypt, garlic in China and bread in Pakistan are at near-record levels.
“The situation has deteriorated since September,” said Abdolreza Abbassian of the UN food and agriculture organisation. “In the last few weeks there have been signs we are heading the same way as in 2008.
….read more A Crisis to End all Crises HERE
More From Peter Grandich’s Things
In this issue of Breakfast with Dave
• Market comment: The Dow briefly breached its April 26 interim high yesterday, but 11,205 seems to be posing some serious resistance to the upside
• Trading down: the move-up home buyer has become a very rare breed these days; yes, U.S. existing home sales did surge 10% in September, but median home prices fell 3.3% and is now down three months in a row
• The Chicago Fed National Activity Index confirms a stall-speed U.S. economy: this broad barometer weakened to -0.58% in September and is the second negative reading in a row
• ‘Real economy’ leading indicators point to anemic growth in the U.S.
…..read Market Musing HERE
On Friday, the S&P 500’s 50-day moving average crossed above the 200-day moving average. This is often referred to as a “golden cross” because it indicates that the current positive direction of the market is likely to continue. This is often a long-term investment signal and sometimes these crosses persist for years before the 50-day moving average crosses back below the 200-day moving average.
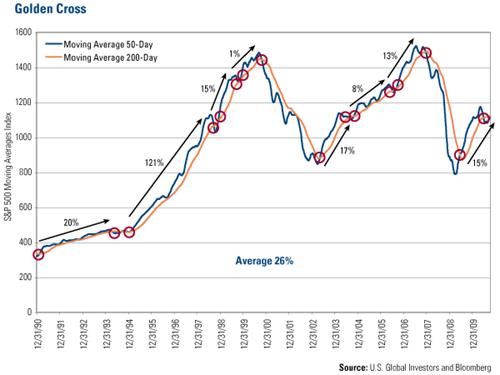
The golden cross is noteworthy because some investors use it as a trading indicator. If you had used this as a trading strategy, and bought the index when the 50-day moving average crossed above the 200-day moving average and sold when it crossed below, your average gain over the past 20 years would have been more than 26 percent.
This strategy attempts to capture long-term trends in the market, and the cross is a relatively rare occurrence. Over the past 20 years there have only been eight occurrences where the 50-day moving average crossed above the 200-day moving average and in every instance, the cross was followed by an upswing in the market.
Broad-based stock indices have experienced one of the worst decades in history and many investors are fearful and vividly remember the crash of 2008. No one knows if this is the beginning of the next major bull market but history is on your side. Putting money to work in the stock market in the current environment appears to offer a favorable risk/reward profile.
The world is full of negative headlines and reasons for you to not invest, but the old saying that the market “climbs a wall of worry” seems appropriate here.
….read more from Raymond James HERE
“Britain under its new leadership is going the austerity route. Chancellor Osborne set plans for 81 million pounds sterling of spending cuts, all in an effort to erase Britain’s deficit by 2015. Osborne’s plan will entail the loss of 500,000 jobs in Britain’s biggest austerity push since World War II. Osborrn will require larger pension contributions, and higher retirement age, Conservatives in Parliament cheered Osborn, crying “More, more” as the word of the new austerity program emerged. There was no sense of panic on the part of the British public, perhaps because Brits remember the austerity and pain they lived through during the dark and horrific days of World War II.
-
I know Mike is a very solid investor and respect his opinions very much. So if he says pay attention to this or that - I will.
~ Dale G.
-
I've started managing my own investments so view Michael's site as a one-stop shop from which to get information and perspectives.
~ Dave E.
-
Michael offers easy reading, honest, common sense information that anyone can use in a practical manner.
~ der_al.
-
A sane voice in a scrambled investment world.
~ Ed R.
Inside Edge Pro Contributors

Greg Weldon

Josef Schachter

Tyler Bollhorn

Ryan Irvine

Paul Beattie

Martin Straith

Patrick Ceresna

Mark Leibovit

James Thorne

Victor Adair