
Daily Updates
SIGNS OF THE TIMES:
“Gold to Reach $5000 Due to Supply Shortages”
“Exhaustive report by Standard Chartered rests upon ‘central banks have turned from being net sellers to net buyers of gold.'”
– CNBC, June 14, 2011
It took a long time for commonsense to overwhelm book-learning. Central banks becoming net buyers is an important and practical step away from financial demagoguery.
Standard Chartered is a big and diverse bank and their research department should be complemented for such a bold conclusion. However, we could not endorse the price target as it is based upon fundamental analysis of supply and demand, which in any metal is often treacherous.
Typically gold’s real price, as determined by a reliable consumer price index sets a significant low in the year a great financial mania concludes. This time around, the reversal occurred in May 2007. As we calculate it, our Gold/Commodities set a low of 143. On the first post-bubble recession this soared to 518 and represented an increase in operating margins for gold producers.
Then with the first business expansion this turned down as commodities enjoyed a cyclical move that ended with a mania. Gold’s real price slumped to 303 early in the year and in setting the uptrend in mid-April anticipated the selloff of stocks and commodities.
Quite likely, this is on a cyclical increase as the global economy enters a cyclical recession.
One of the features of the post-bubble world is weak recoveries and severe recessions. Even mainstream economists recognized that the last recession was the worst since the early 1930s.
Gold’s real price is anticipating the start of a recession and so is the dramatic reversal in silver prices relative to gold. The latter is a very old indicator of an important change in financial markets. Just as old and reliable as the recent reversal from narrowing credit spreads to widening.
Typically, post-bubble contractions have prevailed for some twenty years as gold’s real price improved. This has made gold mining the premier industry as orthodox business and industry suffer chronic pricing pressures.
Gold’s nominal price is of interest to traders, some of whom are positioning to “punish” the corrupt Federal Reserve System. Serious investors know the importance of gold’s real price.
Every bull market climbs a wall of worry and then in a rush of confidence leaps over – only to find Murphy waiting.
Murphy’s Law states “What can go wrong will go wrong”, and while Murphy has been reliable, unless he was an historian he could not imagine the distress of a post-bubble contraction.
* * * * *
What’s Next?
The possibility of a rebound showed best in the S&P. Two weeks ago this page noted that if the stock market remained down for a week, a Capitulation would register. We also had a target of 1250 and Thursday’s low was 1258 – close enough.
Monday’s ChartWorks reviewed the “Springboard” pattern, which usually indicates a good relief rally. This is working out and as it improves it could provide relief to base metals as well.
This could run for some weeks and generate some overbought conditions.
Excessive speculation was expected to complete in April and fail. Financial markets would rebound and then likely churn around through the summer.
May’s reversal in corporate spreads has become impressive enough to indicate further widening in September. This sector could also churn around through the summer.
Our Momentum Peak Forecaster has again earned a lot of confidence. In early December this indicated that a significant rush of speculation was building. In January it signaled that it could complete in March-April.
When the big action focuses upon commodities as in 1973 and in 1980 the signal has been close to the beginning of a recession.
Economic numbers and widening credit spreads seem to be confirming this melancholy possibility.
THURSDAY, JUNE 30, 2011
BOB HOYE
PUBLISHED BY INSTITUTIONAL ADVISORS
The Above is part of Quick Pivot that was
published for our subscribers June 22, 2011.
Link to June 24 ‘Bob and Phil Show’ on Howestreet.com:
http://talkdigitalnetwork.com/2011/06/goldman-sachs-murphy/
BOB HOYE, INSTITUTIONAL ADVISORS
E-MAIL bobhoye@institutionaladvisors.com
WEBSITE: www.institutionaladvisors.com
Buy silver if price drops: Jim Rogers
LONDON (Commodity Online): Global commodities guru Jim Rogers says that Silver remains the hottest commodity these days. Despite the current downtrend in commodities in the recent weeks, the bull market in the sector is still intact, Rogers said.
In an interview to IndexUniverse.com, Rogers who is regarded as the most authentic voice on commodities investing in the world said that the downtrend in commodities is nothing unusual.
“This is the way the world works. If you look at oil, for instance, it has gone down over 50% three or four different times since 1998. That’s what markets do, and they will continue to do that,” Rogers pointed out.
Rogers is chairman of Rogers Holdings and Beeland Interests, Inc. Rogers, the co-founder of the Quantum Fund with George Soros and creator of the Rogers International Commodities Index (RICI), said that he continues to be long on commodities.
Rogers said he regards Silver as the hottest commodity and like the white metal for the rest of the decade and is ready to buy Silver if the price comes down. He had said in May that the surge in Silver price to nearly $50 in April didn’t look healthy and hoped for a pullback to kill the froth.
“Well, I’m long silver, and if it goes down more, I hope I’m smart enough to buy more,” he said. “I didn’t particularly like seeing it spike, because anything that turns into a parabolic move has to be sold. And I don’t want to sell my silver. I want to own it 10 years from now. Fortunately, that spike did break, and I find that encouraging and bullish.”
Rogers, who is the author of the best selling books like Hot Commodities and A Bull in China, said that commodities prices will continue to rise in the years to come as populations are growing in size and prosperity in Asia, bringing with that growth an upgraded and voluminous diet—the demand side of the price equation.
On the supply side, Rogers noted the aging of farming personnel will pose challenges to the restocking of qualified talent.
“We know that there are huge shortages of agriculture developing. I don’t know if you knew this, but the average age of farmers in America is 58 years old. In 10 years, they’re going to be 68, if they’re still alive. Throughout the world, we have serious, maybe even catastrophic developments in agriculture, which is going to hurt us all over the next couple of decades,” he said.
On the Crude Oil market, Jim Rogers said: “I do not see any major new sources of supply of oil. We know that the known reserves of oil continue to decline worldwide.”
NYMEX Crude Oil (Light)

Story by the Excellent CommodityOnline.com
Technical observations of RossClark@shaw.ca
Bob Hoye
Institutional Advisors
Posted Jun 29, 2011
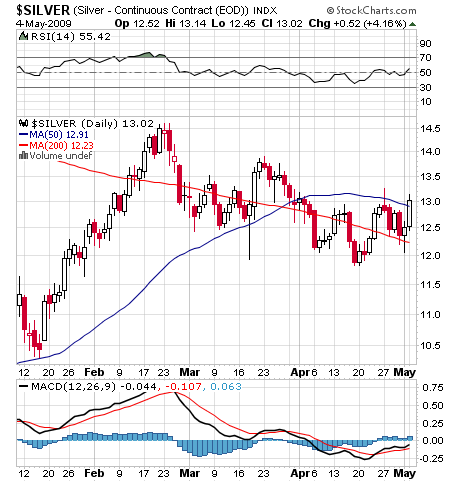
Gold and Silver – More Range Bound Activity
It is now eight weeks since the precious metals topped and gold is producing its third Springboard alert (oversold in a rising trend). The May 17th and June 13th alerts produced rallies of $70 and $43. Additionally, both gold and silver have simultaneous RSI(14) readings below 40, an occurrence we like to see once prices have been in a consolidation of five weeks or more following an RSI reading of 85 in the Silver/Gold ratio. Once this oversold reading is behind us the metals should be capable of more sustained rallies. The first day in silver with a higher high can be used to identify the upside reversal.
Gold is close to its 50 & 55 day Bollinger Band supports ($1470 & $1490) and silver is approaching its 7% moving average band (currently $31.60).
These are the type of oversold and support characteristics seen at important lows following the tops in 2008, 2006, 2004, 1995 and 1987.
Although the metals have made new lows for the month of June, the majority of the mining stocks are holding above the June 17th bottoms. This is inverse to the price action seen going into the April highs when there were bearish divergences in the miners.
Seasonally, prices should be expected to base out in late June through July.
The next important highs in silver should test the upper 7% moving average band this summer.
Click on the image for larger chart:
Silver/Gold Ratio, Gold and Silver
2008, 2006, 2004 and 1987
Click on the image for larger chart:
Click on image for larger chart
Don Vialoux of EquityClock.com
Gold Futures Continuous Contract Seasonality
Date range: January 1, 1990 to December 31, 2009
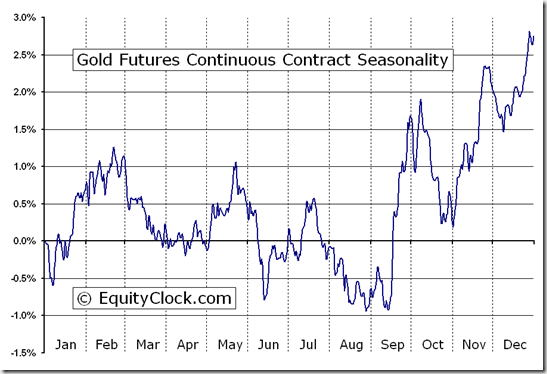
Analysis has revealed that with a buy date of September 13 and a sell date of May 23, investors have benefited from a total return of 183.61% over the last 10 years. This scenario has shown positive results in 9 of those periods.
How to Invest: Go HERE where Don Vialoux lists instruments that mirror the movement of Gold Futures
AGNICO-EAGLE MINES LTD. (TSE:AEM) SEASONAL CHART

The best return over the maximum number of positive periods reveals a buy date of July 27 and a sell date of March 18, producing a total return over the same 10-year range of 1059.65% with positive results in 10 of those periods.
Go HERE for Don Vialoux’s Seasonality Comments on Agnico-Eagle and HERE for a Seasonality search on all Gold & Silver Stocks.
The Legendary Richard Russell (86yrs old) has made his subscribers fortunes. He made a fortune for his subscribers in Gold in the original run from the 30’s to $850, got his subribers into Gold at $300 & below and still bullish @ $1,500 today. One of the best values anywhere in the financial world at only a $300 subscription to get his DAILY report for a year. HERE to subscribe.
Richard Russell 06/29/11: The deed is done. The Dow broke out above its June peak, thereby confirming the previous breakout of the Trannies. My PTI ended up 6 to 6302, leaving it bullish by 34 points. As for NYSE internals, 2093 issues ended higher, and 904 ended lower. There were 80 new highs and 13 new lows. UP volume was 80% of up +down volume. That’s two 80% up-days in a row with the Dow confirming, which adds up to excellent action and most probably a higher market. At any rate, that’s the way I read ’em.

Richard Russell 06/28/11: The Dow Theory makes note of the action of three items, (1) the Dow-Jones Industrial Average, (2) the D-J Transportation Average, (3) the daily volume of transactions on the NYSE.
True, I watch many other indicators, some of them helpful and some of them annoyingly deceptive. The secret of technical analysis is “what to keep and what to throw out.”
We already know that the Transports have been strong, and their strength seems to be transferring over to the Industrials. Below we see the Dow, up 112 points as I write), rallying off the recent June 15 low of 11862. The upside target is the little June 21 peak of 12217 (blue horizontal line). The question I ask is — “Is the market “playing with us” as if has been doing for months or are we going to make some real progress?” Real progress would entail the Dow rallying above 12217 and then climbing back above its 50-day moving average (which stands at 12367).

Now study the Transports over the same period. Here we see the Transports well off their June lows, and not even close to breaking down. Thus we have new lows for the move in the Dow with the Transports not close to confirming. This non-confirmation on the part of the Transports sets the stage for a rally, a rally which started yesterday and continues today. The question, of course, is whether the rally has legs.

From Peter Brimelow of Marketwatch:
Another down week, but now even permabears think the storm may be passing.
Two weeks ago, these letters had real fear of another 2008-style Crash ( See June 6 column. ) They’re still not happy, but they’re impressed that the world has not ended.
Dow Theory Letters’ Richard Russell wrote on Friday morning: “From a Dow Theory standpoint, I thought the action of the Dow Jones Transportation Average DJT +0.45% was significant. Not only did the Transports refuse to follow the Dow Jones Industrial Average DJIA +0.60% down, but the Transports actually rallied. …Thus, the Transports are giving the lie to the frightening performance of the Industrials.”
Even after Friday’s bad break, he merely wrote: “Dow at new low for the move, unconfirmed by the Transports. … I’m keeping my eyes on those March lows. One or the other (Industrials or Transports) better hold.”
….read more of Brimlow’s article HERE
The ETF revolution allows everyday investors to achieve the impossible. Just a few short years ago, short-selling, leverage, spreads, and commodities were practical only for the Wall Street insiders. Now, with ETFs, anyone can play.
Yet availability doesn’t guarantee success. You have new opportunities, yes, but they all have risks. You need to know what can go wrong and be ready for it — before you place an ETF order.
Lately I’ve received many questions about inverse ETFs, which are designed to go up when the indexes they track go down. With markets volatile, the economy sputtering, and a global debt crisis all over the headlines, now may be a great time to consider trading on the short side.
But inverse ETFs carry some unique risks. And today I’ll talk about three you may not have considered.
Inverse ETF Risk #1:
Bad Timing
This one may go without saying, but I’ll say it anyway. You don’t want to buy an inverse ETF (or make any kind of short sale) unless you are very confident your target market is heading down soon. Timing your entry and exit is critical.
But inverse ETFs carry some unique risks. And today I’ll talk about three you may not have considered.
Inverse ETF Risk #2:
Holding Too Long
Many inverse ETFs include a built-in leverage factor. The intent is to amplify your gains by 2X or 3X. Sounds great, right? Go 3X short and a 5 percent drop for the market turns into a 15 percent gain for you, right?
Not exactly. In most cases, the leverage factor is reset every day. This means that, over time, the value of your shares can drift down even if the market moves in your favor!
I explained this just last month in What Silver’s Recent Plunge Teaches Us about Leveraged ETFs. And for more details and examples, see my 2009 column Understanding Leveraged ETFs.
The bottom line: Leveraged and inverse ETFs are intended for quick strikes. Get in and get back out as soon as possible. If you make a mistake, admit it. Don’t just sit there and hope for a recovery.
[Money & Markets Editor’s note: For clear, concise alerts on when to get into a position — and when to get out — you should check out Ron’s International ETF Trader service.]
Inverse ETF Risk #3:
Derivative Exposure
Inverse ETFs employ various techniques to get the correct market exposure. In many cases they include derivatives like futures, options, and swaps.
The main concern in derivatives is “counterparty risk.” These instruments are nothing more than legal agreements in which two parties agree to do specific things in specific circumstances. One party is you — or really the ETF manager, acting on your behalf.
In the case of an inverse ETF, the counterparty agrees to pay your ETF if the selected benchmark goes down. Likewise, the ETF will pay the counterparty if the selected benchmark goes up. Counterparty risk is the possibility the other side won’t make good on their bet.
Most inverse ETFs achieve their desired exposure by holding swaps. And it is important to note here, that swaps typically involve only the gains and losses in an index, not the base value of the index itself.
For example, if an index has a starting value of 100 and moves 2 percent, the swap only covers the 2 percent move (4 percent if it happens to be a 2x fund).
If the counterparty were to default, the ETF might not be able to collect on the 2 percent or 4 percent gain, but it would still have the initial cash representing the original index value of 100. This example is oversimplified of course, but I think you get the idea.
Counterparty risk isn’t unique to derivatives contracts. When you buy a plane ticket, for instance, you agree to give the airline a certain amount of money. They agree to have a seat available for you on a plane going to your destination at a defined date and time.
If you don’t pay for your ticket, or the plane takes you to the wrong city, then it is a form of “counterparty default.”
Defaults on equity swaps are very rare, but there is always the possibility that it could happen. This is one factor to consider when deciding whether an inverse ETF is what you need.
Every ETF has a prospectus with detailed information on its characteristics, fees, and risks. Always read it before you invest a dime. You can find it on the sponsor’s website. If you don’t understand something, get clarification from a reliable source.
Best wishes,
Ron
Ron Rowland is widely regarded as a leading ETF and mutual fund advisor. You may have read about Mr. Rowland and his strategies in publications such as The Wall Street Journal, The New York Times, Investor’s Business Daily, Forbes.com, Barron’s, Hulbert Financial Digest and many more. As a former mutual fund manager from 2000 to 2002, Ron was a pioneer in using ETFs inside of mutual funds. Today, he is the editor of International ETF Trader, dedicated to helping investors use ETFs to profit from ever-changing global market conditions.
-
I know Mike is a very solid investor and respect his opinions very much. So if he says pay attention to this or that - I will.
~ Dale G.
-
I've started managing my own investments so view Michael's site as a one-stop shop from which to get information and perspectives.
~ Dave E.
-
Michael offers easy reading, honest, common sense information that anyone can use in a practical manner.
~ der_al.
-
A sane voice in a scrambled investment world.
~ Ed R.
Inside Edge Pro Contributors

Greg Weldon

Josef Schachter

Tyler Bollhorn

Ryan Irvine

Paul Beattie

Martin Straith

Patrick Ceresna

Mark Leibovit

James Thorne

Victor Adair