

Instant Wisdom: This Is An Incredibly Important DayDeja Vu All Over Again
08/05/2018 2:36 PM40 years and nothings changed when it comes to anti-trade policies. Milton Friedman comments on the Trump steel tariffs and you'll swear he could have said it last week. ...
read more
Shocking Stat – Forgive The Good News
08/04/2018 9:20 PMWe love our stories of doom and gloom but that doesn't change the fact that in many areas the world's getting better . Here's just a sampling of the profound progress being made. We dare you to listen. ...
read more
This Week’s Goofy – The Latest Admission of Fake Environmental News
08/04/2018 7:42 PMAre you one of the 2.5 billion people who saw the National Geographic video of the emaciated polar crossing the baren landscape last December? The editor now admits - the video was grossly...
read more
Spending Sickness, Timer of the Year With The Latest on Markets – Complete Show 08/04/18
08/04/2018 6:10 PMMike on what the $2.2 billion blown on the Phoenix Pay System Could Buy. Timer's Digest Timer of the Year, Mark Leibovit on the marijuana stocks, bitcoin, gold and oil. Plus Ozzie with the latest on real estate. ...
read more
Same Old Story – $2.2 Billion Tax Dollars Gone
08/04/2018 5:47 PMToo many people yawn and roll their eyes when they hear that the Phoenix Pay System debacle will cost taxpayers $2.2 billion tax dollars. If you're one of them I invite you to consider that money is enough to provide new housing for every homeless person in Western...
read more
Leibovit Special Summer Offer
08/03/2018 10:12 PMWhy not make some money this summer? Mark wants this to be your most profitable month of the year!...
read more
Marc Faber: Won’t be surprised if Indian markets correct 20%
08/03/2018 3:20 PMMarc Faber, editor and publisher of The Gloom, Boom & Doom Report, said he would not be surprised if Indian markets corrected 20% from current levels, but did not give a timeline for such a correction. In a phone interview from Chiang Mai, Thailand, the Swiss investor...
read more
Charts for the beach – 2018
08/03/2018 3:12 PMIt’s time for our annual August report, “Charts for the beach.” Each year we highlight five of our favorite charts we think consensus is currently overlooking. Remember to ask your RBA representative for your official RBA eyeglass cleaning cloth to keep your sunglasses spotless!
Profits (not GDP or politics) drive the stock market.
At RBA, we approach the current environment by staying disciplined, slowing down the investment process, and by staying dispassionate with respect to politics.
Along those lines, our first two charts show US real GDP and corporate profits through time. There has been considerable hoopla about the strength of GDP growth during the second quarter, but US real GDP growth remains within a slow-growth band that has existed since the bursting of the Technology bubble in 2000 (See Chart 1).
CHART 1:
US Real GDP
(QoQ % Jan. 1946 – Jul. 2018)
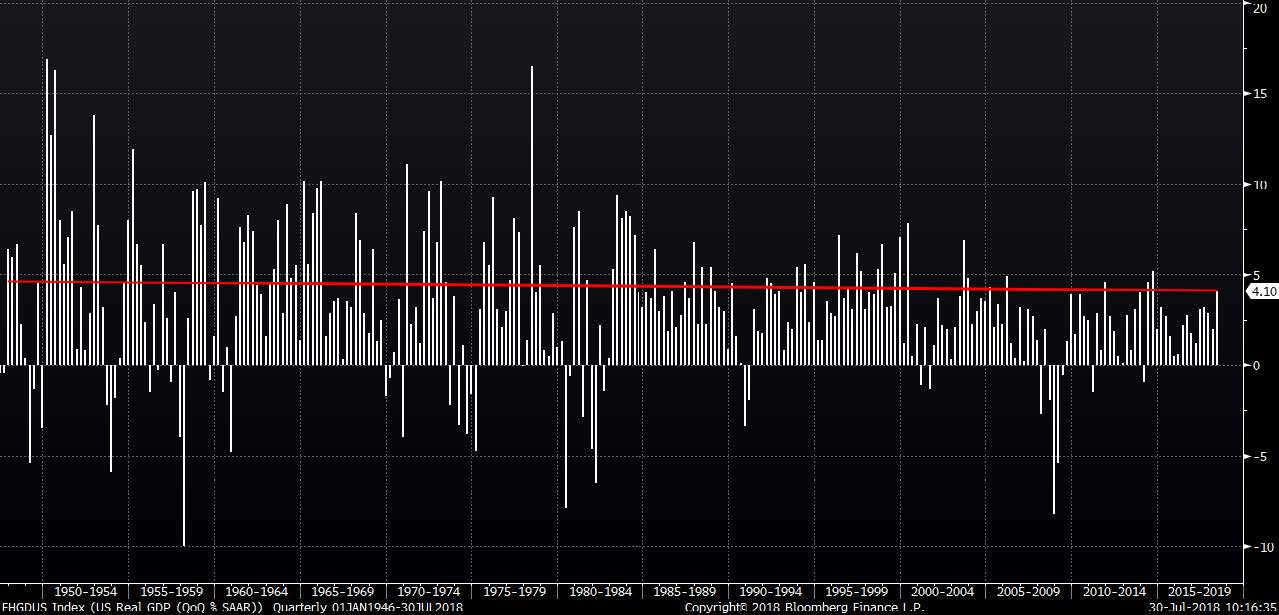
Source: Bloomberg Finance L.P.
Chart 2 helps explain why the US bull market has been so powerful despite continued anemic GDP growth by highlighting corporate profits as a percent of GDP. The corporate sector’s proportion of national income rose to all-time highs post-2010. This ratio has smartly rebounded, which has fueled the more recent leg of the bull market.
Contrary to popular belief, the corporate sector (upon which the stock market ultimately focuses) has been historically healthy relative to the overall economy. The combination of tremendous liquidity provided by the Federal Reserve and an historically healthy corporate sector seems to justify both the length and magnitude of the 9-year bull market.
CHART 2
US Corporate Profits as a Percentage of GDP
(4Q 1947 – 1Q 2018)
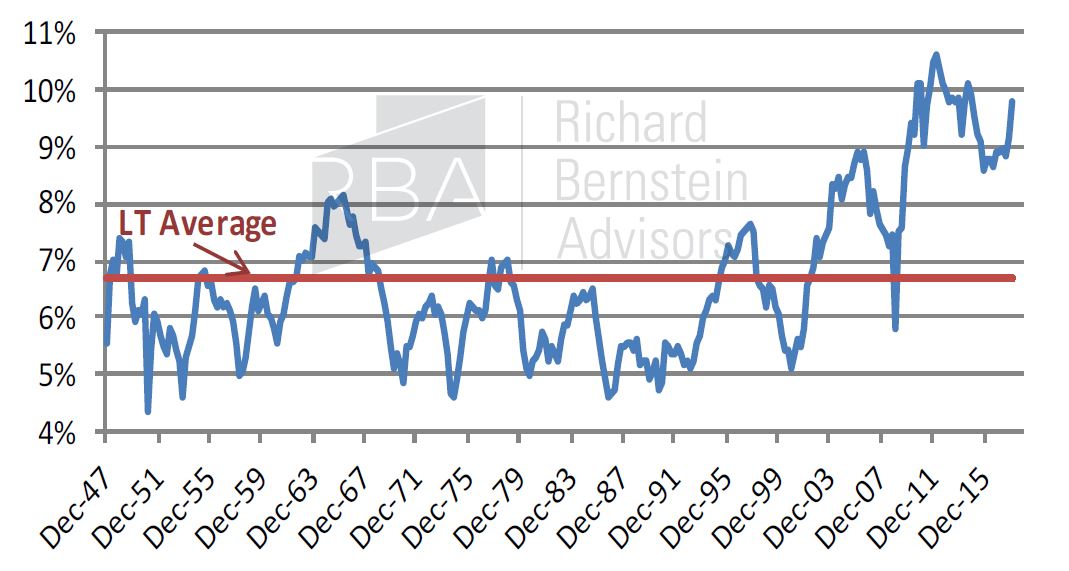
Source: Richard Bernstein Advisors LLC, BEA, Bloomberg Finance L.P.
We prefer fixed liabilities, not fixed income, during inflationary periods.
Data demonstrate that investors continue to focus on disinflationary asset classes and have yet to re-orient portfolios toward assets that outperform during periods of accelerating inflation. Unfortunately, inflation expectations troughed more than two years ago, and asset classes that benefit from accelerating nominal growth (stocks and commodities) have appreciated significantly whereas broad fixed- income has provided negative total return.
Chart 3 compares the returns of stocks, commodities, and various popular fixed-income benchmarks since July 2016. The ongoing popularity of income-oriented investments shows investors have yet to understand the implications of higher potential inflation.
Household and corporate balance sheets constructed with general combinations of fixed asset values and floating liabilities tend to outperform during periods of disinflation/deflation. However, a combination of floating assets and fixed liabilities has proven more beneficial during periods of inflation. FIXED-income is unlikely to be a successful core holding if we are correct and inflation continues to be higher than investors expect. Inflation is the kryptonite of income.
read more
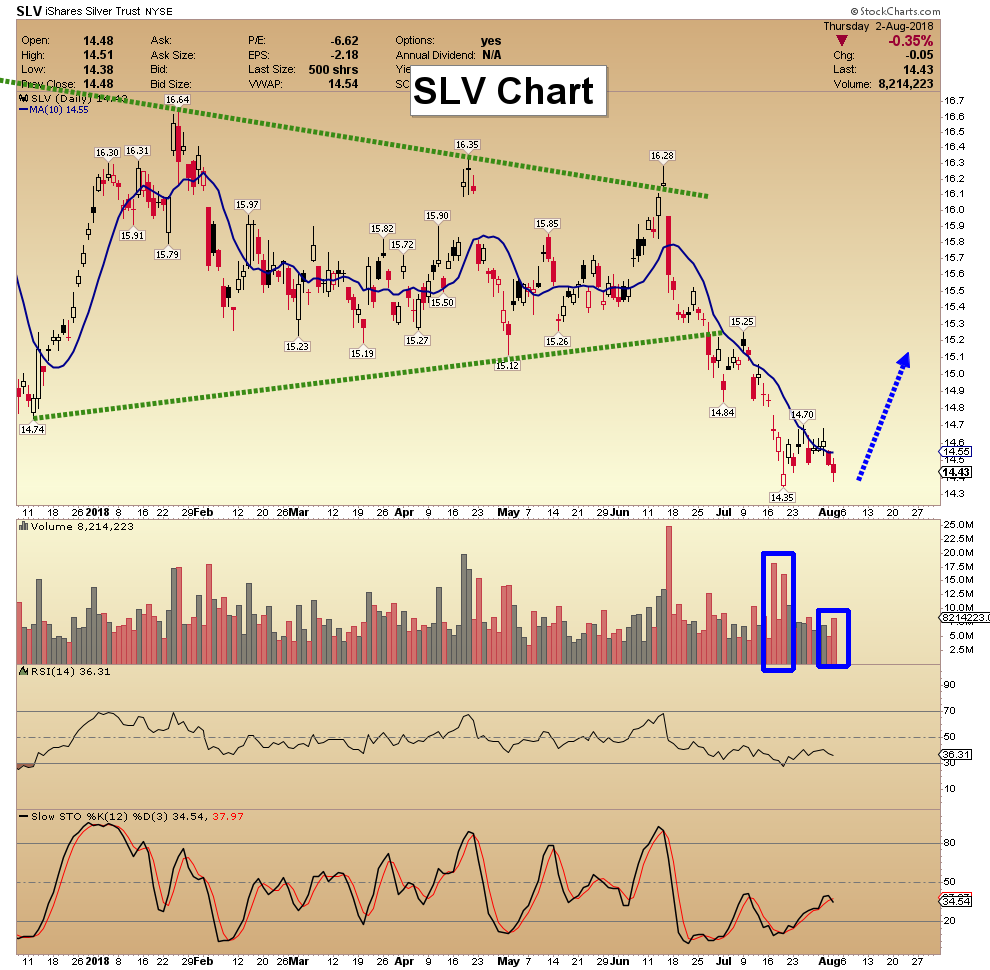
Silver Holds It’s Low & Novo Gets Interesting
08/03/2018 2:30 PMToday’s videos and charts (double click to enlarge):
SFS Key Charts & Portfolio Analysis


SF Juniors Key Charts & Video Analysis


The BS Pedalled About The Federal Debt
08/03/2018 2:23 PMSome well known economists say we can afford the federal debt. That’s true – it will be about 1% of GDP but it's BS to suggest that "we" can afford it when it will be our children and their children who'll be paying. And it's not just the federal debt - they'll also...
read more


