

A Tale of Two Charts: 2007 America or 2006 Zimbabwe?
The US equity markets are back in record territory, at least in nominal terms.
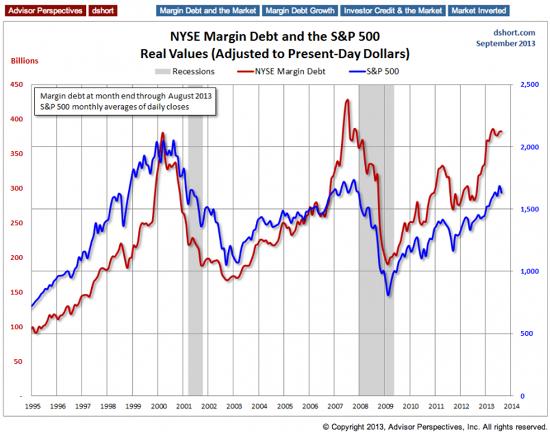
The last two times they spiked this way, the following year was pretty brutal. See the next chart, which tracks the S&P 500 and margin debt, the amount of money investors are borrowing against their shares of stock to buy more stock. The chart seems to show that when investors are optimistic enough to use leverage to invest in already-risky stocks, then the good times have pretty much run their course and something nasty is imminent. If recent history is our guide, it is now time to either take some money off the table or short the hell out of the big indexes – or whatever else you like to do when the market looks overbought.
….read more HERE


