
In this week’s issue:
WEEKLY COMMENTARY
Stockscores Market Minutes Video
This week, a look at how to know when to sell your winners plus the regular weekly market analysis. Watch the video by clicking here.
Survive and Thrive 2014 – Calgary
Tyler will be speaking at the Survive and Thrive 2014 conference in Calgary presented by Michael Campbell’s MoneyTalks. The event is free from 9 until 3 (Tyler speaks at 9:05) with a paid event on FX Trading by Jack Crooks and Michael Campbell at 3 (use the discount code MKTDG to get 25% off of that presentation). For more information and to register, click here.
When to Sell – The Technical versus Fundamental Approach
Selling your stocks at the right time is the most emotionally challenging step in the trade. There are times when we are wrong and we must exit at a loss – that is hard. There are times when we buy strong stocks that perform very well which we tend to sell too early because we doubt that the strength can last. Then there is the pain of watching a winning trade turn in to a loser because we fail to exit at all.
This makes it important to have an approach to selling that allows the trader to maximize profits over time. A tested and proven approach can help the trader take the emotion out of this difficult decision. Should the investor use fundamental or technical analysis to tell them when to sell?
Those who use the business fundamentals to make their investment decisions will typically set a price target based on their determination of fundamental value. If their fundamental analysis determines that a stock trading at $10 is really worth $15 then it makes sense to buy it at $10 and sell it when it hits $15. This is why you often hear fundamental analysis include a price target.
A technical analyst will wait for the market to give a sell signal, either by a loss of momentum, reaching an overbought state or by suffering a breakdown on the stock chart. Technicians may set price targets based on price ceilings that the market has defined in the past or they may simply wait for the market to give a signal that the buyers are losing their enthusiasm.
Whether you use a fundamental or technical approach, there are countless varieties that can be applied, making it a challenge to arrive at an answer to which approach is better. However, if we stick to a very basic set of competing definitions, it becomes possible to see the strengths and weaknesses of each.
Let’s define a fundamental approach to selling as exiting a trade when the stock’s price is greater than its fundamental value. Put that up against the technical approach which is to sell a stock when there is a signal from its trading activity that the stock is more likely to go lower than higher.
While the notion that we should sell a stock if its price is higher than its fundamental value makes a lot of sense, there are major problems in its application.
First, do stocks only rise to their fundamental value?
History is filled with stories of stocks that have enjoyed amazing upward trends that go far beyond any fundamental analyst’s estimation of value. Consider shares of Tesla (TSLA), the electric car manufacturer. This company makes about 20,000 cars a year (as a comparison, Ford makes about 2 million cars a year). TSLA has a market cap of about $20 billion dollars (that is $1 million of market cap per car for a company that sells its cars for around $100k). No matter how you crunch the fundamental valuation models, it is not possible to justify the price that TSLA shares trade at. Even the company founder, Elon Musk, has said that he thinks the shares are overvalued. Yet, the stock has continued to enjoy a strong upward trend. A shareholder that used fundamental valuations would have sold the stock very early in that upward trend and left a LOT of money on the table.
The second major issue for using fundamental analysis to determine an exit point is the actual assessment of what fundamental value is. There is no rule book which determines how the pricing model should look. Even if fundamental analysts use the exact same pricing model they could still arrive at very different valuations if they use different information to arrive at price.
If you believe in market efficiency then you have to believe that the price a stock is trading at today is correct given the information that the public has to work with. The stock’s price in the future will not depend on what the market knows today, it will be determined by what new information the market learns in the future.
A good fundamental analyst has the ability to predict what the company’s value will be in the future because they have information that the general public does not have. To be a good fundamental analyst requires the use of private information.
That is where good technical analysis comes in.
Most technical analysis uses market activity to assess what investors think of the company’s fundamentals. Momentum indicators like the MACD or moving averages judge whether the buyers or sellers are in control of the stock. Oscillators like the Stochastic or RSI determine whether the buyers or sellers have been too aggressive, pushing the stock up or down too quickly. While these indicators have some use in analyzing the stock, they are like most fundamental analysis – they don’t provide an edge.
To beat the market, you have to trade with private information. Since most of us do not have the expertise or insight to gather private information on a lot of stocks, we have to use technical analysis to figure out what the people who are doing really good fundamental analysis know.
From the sell side, we need to look for evidence that those with the best information are selling for a reason. It is normal for stocks to have up and down moves in a long term trend. What is key is to be able to figure out the difference between a pull back and a trend reversal. That is where good technical analysis comes in.
A stock that is trending higher will form an upward sloping trend line that can be drawn by placing a line across the bottoms on the stock chart. As long as that line is not violated, the buyers are in control of the stock and the perception of fundamentals is improving over time.
A trend line that is broken implies that some investors have information which justifies aggressive selling. We have to listen to those investors so sell your winners when their upward trend line is broken.
The second approach to technical selling is to establish a range of price volatility that is normal for the stock and plan to sell if the stock moves down more than that price volatility range tolerates. This is a sort of trailing sell signal concept which allows the investor to lock in more profit as the stock moves higher by establishing a higher floor price. If the stock pulls back to hit the floor it is time to exit.
Both of these exit strategies are explained visually in this week’s Market Minutes video. It is a lot easier to understand if you watch the video, which you can do on YouTube by clicking here.
This approach is not without its faults. The most common mistake that traders make is taking too short term a view for the trading style that they are applying. If you are a longer term trader looking for entry signals on a daily chart then you should not be looking for trend line breaks on an intraday chart. It is probably best to look for a longer term entry signal using a weekly chart. As good traders say, the profit is in the patience.
The two technical approaches discussed here are very simple and will be useful to anyone holding winning stocks. It is possible to improve upon them with more sophistication but without making them complex. These better selling rules are taught in the Stockscores trader training programs. The next Stockscores trading classes will be taught late in November, details coming soon.
STRATEGY OF THE WEEK
The market continues to show that it wants to continue higher, that the buyers believe that the fundamentals are improving enough to justify higher prices. The problem is the debt limit argument going on between US lawmakers. This uncertainty has brought a high degree of short term price volatility that makes the market difficult to trade.
This uncertainty has not broken the control that the Bulls have on US stocks. Canadian stocks, which have really lagged the US are showing signs that they are ready to play catch up. However, the uncertainty has prevented the buyers from acting with conviction. The market needs the debt issue to be resolved if it is going to continue its upward trend.
Therefore, I recommend some caution with stocks until the uncertainty is removed. This could be as soon as tomorrow but we could also see the process drawn out over weeks or even months.
I think there are two approaches worth considering. First, look for trading opportunities in lower priced, small cap stocks that are behaving abnormally. These stocks will have less correlation to the overall market and the swings that happen as the result of Washington’s actions (or inaction).
Second, look for opportunities to buy strong stocks that drop in price as the result of what the overall market is doing. If upward trending stocks fall lower because the market is down heavily, consider some bargain hunting as long as the long term upward trend is not broken.
This week, I share with you two stocks that have good charts with a recent show of abnormal activity. I found each of these using the Stockscores Market Scan tool and its abnormal activity filters.
STOCKS THAT MEET THAT FEATURED STRATEGY
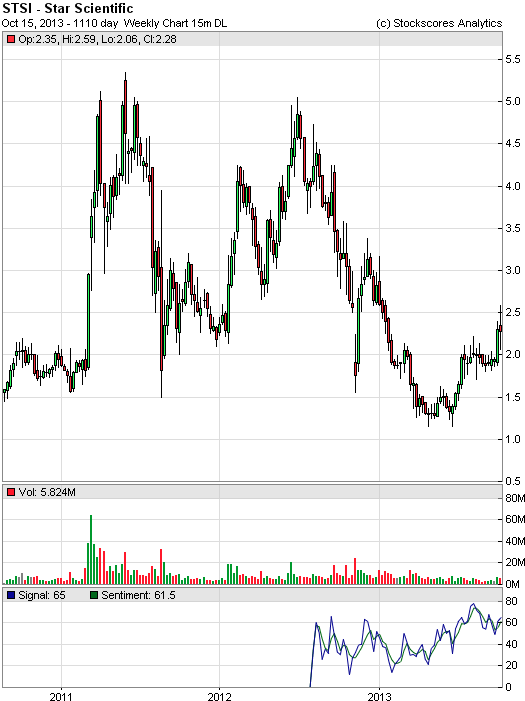
1. STSI
I featured this to my readers of the Tradescores.com Alerts newsletter a few months ago and it has already made big gains. Last week, it broke higher again, giving a signal that it is ready to continue building its upward trend. Support at $1.85.

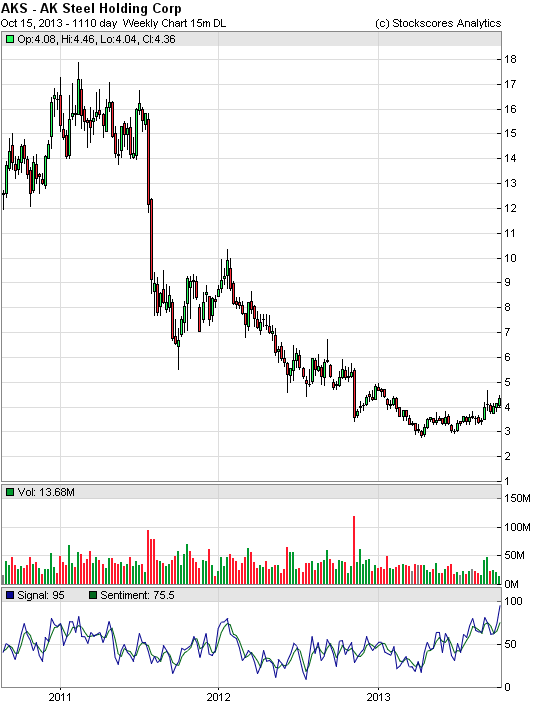
2. AKS
AKS is another newsletter feature that continues to show positive chart action. Long term, this stock has switch from pessimism to optimism over the past few months and appears to be building upward momentum. Support at $3.70.
References
- Get the Stockscore on any of over 20,000 North American stocks.
- Background on the theories used by Stockscores.
- Strategies that can help you find new opportunities.
- Scan the market using extensive filter criteria.
- Build a portfolio of stocks and view a slide show of their charts.
- See which sectors are leading the market, and their components.
Disclaimer
This is not an investment advisory, and should not be used to make investment decisions. Information in Stockscores Perspectives is often opinionated and should be considered for information purposes only. No stock exchange anywhere has approved or disapproved of the information contained herein. There is no express or implied solicitation to buy or sell securities. The writers and editors of Perspectives may have positions in the stocks discussed above and may trade in the stocks mentioned. Don’t consider buying or selling any stock without conducting your own due diligence.


