

Is the gold price trying to tell us something?
Is another 2008 lurking in the shadows?
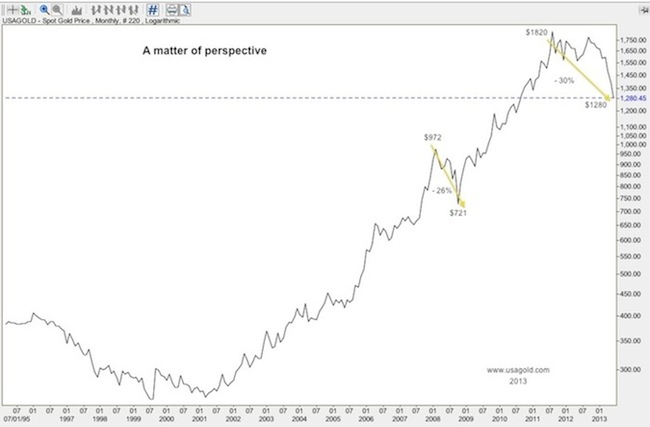
This monthly gold chart is drawn on the logarithmic scale in order to remove some of the melodrama to the latest correction. Linear charts emphasize nominal price movement while a log chart emphasizes the percentage movement. By reviewing gold’s latest correction on a percentage basis, we can put things into a little bit better perspective. The 2008 correction was 26%; the current correct thus far has been 30%. In short, we’ve been here before though you wouldn’t know it from all the catterwauling at our favorite financial cable network and other media outlets (not to mention Wall Street itself). Granted we might not, as yet, have reached bottom, but then again, we could be close.
In preparing this chart, I couldn’t help but look for similarities between 2008 and the present.
…….read it all HERE


