
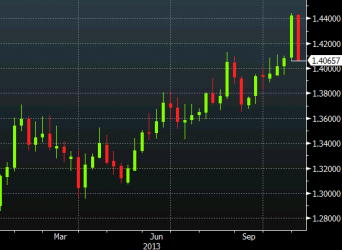
Take a look at this chart above:
See that huge drop?
That’s a collapse in the supply of silver. It began in 2010.
Tim Mittelsteadt
Editor-in-Chief, Common Sense Publishing


Posted by Investors Alley
Share on Facebook
Tweet on Twitter
Take a look at this chart above:
See that huge drop?
That’s a collapse in the supply of silver. It began in 2010.
Tim Mittelsteadt
Editor-in-Chief, Common Sense Publishing

I know Mike is a very solid investor and respect his opinions very much. So if he says pay attention to this or that - I will.
~ Dale G.
I've started managing my own investments so view Michael's site as a one-stop shop from which to get information and perspectives.
~ Dave E.
Michael offers easy reading, honest, common sense information that anyone can use in a practical manner.
~ der_al.
A sane voice in a scrambled investment world.
~ Ed R.

Greg Weldon

Josef Schachter

Tyler Bollhorn

Ryan Irvine

Paul Beattie

Martin Straith

Patrick Ceresna

Mark Leibovit

James Thorne

Victor Adair