

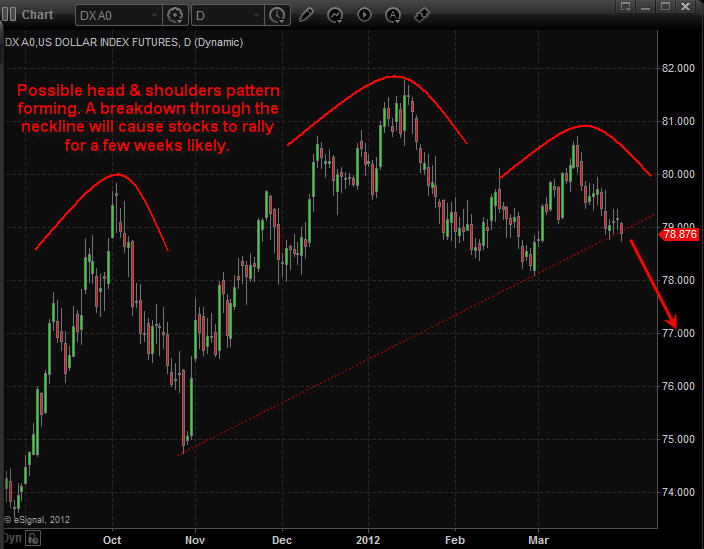
Daily Chart of US Dollar Index:
The US Dollar index has formed a possible large Head & Shoulders pattern meaning the dollar could fall sharply any day. The size of this chart pattern indicates that if the dollar breaks down below its support neckline the we should expect the dollar to fall for 2-3 weeks before finding support.
Keep in mind that a falling dollar typically means higher stock and commodity prices. If this senario plays out then we should see the market top late April which falls inline with the saying “Sell In May and Go Away”.
Via Chris Vermeulen @ www.GoldAndOilGuy.com Sign Up Today @ http://www.thegoldandoilguy.com/signup.php


